We’d like to remind Forumites to please avoid political debate on the Forum.
This is to keep it a safe and useful space for MoneySaving discussions. Threads that are – or become – political in nature may be removed in line with the Forum’s rules. Thank you for your understanding.
📨 Have you signed up to the Forum's new Email Digest yet? Get a selection of trending threads sent straight to your inbox daily, weekly or monthly!
I'm timing the market - who's in?
Comments
-
Sold everything I've got this week after the recent rally . ISA and SIPP both up nearly 10%. I could have it all wrong but that's my system. As I mentioned in the previous post I was away for a few days and missed the call to sell around 745 ish. That would have resulted in a buy around 720ish . Added to my sell call today at 7.29 I'd have a good 3% or more in the pot. But I'm still up against the FTSE index.
iShares Core FTSE 100 UCITS ETF, UK:ISF Advanced Chart - (LON) UK:ISF, iShares Core FTSE 100 UCITS ETF Stock Price - BigCharts.com (marketwatch.com)
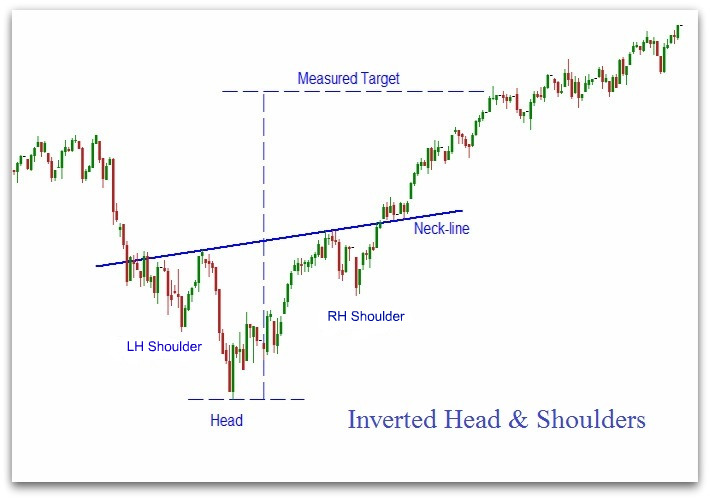
The US markets have boomed for 8 straight sessions. SP 500 is up from 4100 to 4400 in days . Overbought but who knows ? Could we be seeing an inverted head and shoulders pattern playing out next ? I'm being positive here as a pullback to say 4200-300 will look good for a year end rally coinciding with an end to FED rate rises.
S&P 500 Index, SPX Advanced Chart - (S&P US) SPX, S&P 500 Index Stock Price - BigCharts.com (marketwatch.com)
$SPX | SharpCharts | StockCharts.com
inverted-head-and-shoulders.jpg (710×500) (tradersdaytrading.com)
Well we've had the OCT low and now the rally according to the seasonality chart.
chart.png (645×468) (equityclock.com)
The Presidential Election Year & Stock Market Cycle (bigtrends.com)
2 -
Nebulous2 said:
What a difference a month makes. I'm still frustrated at myself for missing on selling out. I've now moved from selling to buying.Nebulous2 said:Nebulous2 said:
I've been intending joining in this, on a smaller scale. Up until now I've done nothing at all. Somehow it is a bigger hill to climb when it is real money on the table. I had intentions of selling at £90.00, but that hasn't materialised.Nebulous2 said:This is a bit rich and clever for me - I'm already sort of retired, so reluctant to play with my future to that extent.
However -are you using limit orders?
I've got £15k in a SIPP, which I've built up from my part-time earnings since retiring. Its building at £500 a month. I left it in cash until June, when I dipped a toe in the water by buying some VWRP at around £76.50. As luck would have it, I bought these first ones on more or less the low for the year. They went up and I set a target of £80 to buy more. At some point I got fed-up waiting for them to drop and bought some at over that, but then I got some more at under it. I'm currently £380 up with an average price under £80 and less than £1k in cash left.
What I've been doing, if they are close to my target, is setting a limit order. So they'll be at £80.50 and I'll ask to buy £3k at 79.90 first thing in the morning. I've set a limit 8-10 times and only been successful 3 times. The limit with Fidelity expires at the end of the day, but it means I can gain from any mid-day fluctuations, such as a rise in the £. On one occasion my order was filled at less than any price I saw showing for the day.
Apologies if I'm teaching my granny to suck eggs, but you could set a limit regularly, say to sell 2000 shares at 426, and leave the market to perform, or not....
Meantime my cash has been building at £500 a month until I had just over £2500.
I've bought 29 shares today at £84.79 with a limit order. I set the limit rather hurriedly at my work, when the price was £85.12.
I now have 220 shares valued at £84.68 or £18,629.60.
£194.97 still in cash.
I think I've had a lesson in being too greedy.
My target for sometime has been £90. On the 15th of September VWRP reached £89.87. I was working that day, so didn't have the opportunity to follow the market closely. I set a limit order to sell all 220 at £90.25. Unfortunately it never got there, and has since fallen back quite a bit. Maybe I should have sold at the market price rather than trying to squeeze out a bit more....
I had around £1200 in cash in my SIPP, which doesn't give a lot of scope, but I've bought 14 VWRP at £84.79
Patience is a virtue, as the saying goes. Unfortunately its not one I'm always blessed with. I set a limit order yesterday to sell at £93.10. VWRP spent most of the day yesterday at about £92.90 and I spent much of it wondering if that extra 20p was important to me. It hit the limit today however and I'm now all in cash having sold 234 VWRP for a £2800 profit.
As a recap for anyone interested. I'm retired, took a part-time job, and have been paying much of my earnings into a SIPP. I'm currently putting in £400 net a month or £500 gross. I wasn't sure what to do with it, but eventually settled on VWRP as my fund of choice. The reason I am not buying £500 worth each month is that Fidelity won't let me. They charge £7.50 a trade and wont let you setup a regular buy from cash in the account. It has to be new money. That would mean two £7.50 trades a month and a £400 followed by a £100 one.
I was stuck with building the money up and buying manually, so timing the market was built in. I've been reasonably lucky in buying dips.
Then NedS started this thread and I decided to join in, for the fun of it. This is my first time selling. I was going to at £90 a couple of months ago, but missed my chance.
My SIPP is now at just over £22800 all in cash. £16,000 contributions, £4000 tax relief and £2800 profit. Average buying price was just over £81, so I've made over £12 per share / fund.
Edited to correct the contributions / tax relief....
1 -
We need to know if you bought back in at the 710s lows of November or are still in cash waiting for the rally to end...
0 -
Best of luck, I will be watching this with interest.
I am still sore that this forum talked me out of selling to buy back later about 3 years ago, spouting the time in market mantra like a cracked gramophone record. Had i ignored their advice and followed my gut feeling I would be at least 20% better off than holding on when the market dropped soon after I was planning to sell, and it still has not got back to that same level.
That's why I don't ask here for investment advice any more.0 -
DATE BUY/SELL ISF.L UNITS VALUE
18 JAN SELL 765.40 13065 £99,987.05
14 MAR BUY 744.30 13432 £99,974.10
29 MAR DIV 4.28 13432 £100,549
31 MAR SELL 749.22 13432 £101,197.17
10 MAY BUY 756.30 13379 £101,184.22
16 JUNE SELL 747.86 13379 £100,043.23
16 JUNE DIV 10.40 13379 £101,434.65
23 JUNE BUY 725.80 13973 £101,421.70
19 JULY SELL 736.10 13973 £102,842.30
15 AUG BUY 727.20 14140 £102,829.35
30 AUG SELL 737.90 14140 £104,326,11
28 SEPT BUY 734.50 14201 £104,313.16
9 NOV SELL 729.40 14201 £103,569.14
End of year and up just 3.57% and £103,569 . Buy and hold started at 765.4p Jan 18th and finished today 753.1p. 13065 x 753.1p = £98,392 . Including 29.05 p in dividends a different story . 13065 units originally bought x 29.05p dividends adds £3,795 to the total. Grand total of £102,187 against my £103,569.
ISF Dividends - iShares ETFs (dividenddata.co.uk)
What's gone wrong and what's gone right ? Well I'm the first to say it's hardly a victory after all that effort. In the wrong camp I've failed to stick to my system and used gut feel a bit too much. Sold too early instead of using the stop loss / moving average as the guide. So there's a lesson for the future. I struggled with the banking crisis in the US early this year . Struggled with the inflation , rate rises and recession threats . Just play the system I've set up.
The positives are I missed a call as I was away which I highlighted in Oct ? Would have added at least 3% to the total . Unfair to add it so I didn't. Volatility has been dramatically reduced using the system and certainly within 5% or less. Market volatility is usually 15% in a normal year. I've never added cash on deposit either which could add 1 - 2% at todays rates. It's been a falling FTSE market all year and I'm still slightly ahead. You can time the market although most aren't convinced and never will be. I've done better in my SIPP and ISA. Here's a list of calls in 2021 and up 20% same system. Good luck 2024.
Economy crash =/= stock market crash? - Page 40 — MoneySavingExpert Forum
1 -
Haven't read the full thread but just wondered, is this all in your SIPP? which platform do you use and how bad are the trade charges for buying/selling?coastline said:
End of year and up just 3.57% and £103,569 . Buy and hold started at 765.4p Jan 18th and finished today 753.1p. 13065 x 753.1p = £98,392 . Including 29.05 p in dividends a different story . 13065 units originally bought x 29.05p dividends adds £3,795 to the total. Grand total of £102,187 against my £103,569.0 -
Stick to buy and hold as this is what I do and not the majority of investors. It shows technical analysis can play a part in investment if you are buying and selling . It highlights potential / probability and that's all it can do. No guarantees at all. I trade for £6 and platform charges are 0.1% PA which isn't the cheapest. Only have tax wrappers now EG ISA and SIPP. It's too much bother in a standard account these days.isayhello said:
Haven't read the full thread but just wondered, is this all in your SIPP? which platform do you use and how bad are the trade charges for buying/selling?coastline said:
End of year and up just 3.57% and £103,569 . Buy and hold started at 765.4p Jan 18th and finished today 753.1p. 13065 x 753.1p = £98,392 . Including 29.05 p in dividends a different story . 13065 units originally bought x 29.05p dividends adds £3,795 to the total. Grand total of £102,187 against my £103,569.
Our updated guide to help you find the best online broker (monevator.com)
0 -
NedS said:NedS said:NedS said:NedS said:NedS said:No updates from me.My position:Shares: 18,000 shares at 422p = £75960Cash: £16.09Latest hypothetical drip feeding purchase on last day of month (30/4/2023):1270 shares at 422p (last closing price) including 0.5% stamp duty and £11.95 trading fee (no £1 levy as less than £10k)Price = £5398.15CTY shares bought: 1270CTY Share Total: 6400Cash position: £48,216.30 - £ 5,398.15 = £42,818.15Total Value: (6400 x 422p) + £42,818.15 cash = £69826.15No updates from me.My position:Shares: 18,000 shares at 400p = £72,000Cash: £16.09Latest hypothetical drip feeding purchase on last day of month (31/5/2023):1350 shares at 400p (last closing price) including 0.5% stamp duty and £11.95 trading fee (no £1 levy as less than £10k)Price = £5,438.95CTY shares bought: 1350CTY Share Total: 7750Cash position: £42,818.15 - £5,438.95 = £37,379.20Total Value: (7750 x 400p) + £37,379.20 cash = £68379.20
The drip feeding strategy has closed the gap somewhat after my failure to sell at 430p (guilty of waiting for the dividend). An opportunity lost, but I did receive a healthy £909 dividend today.Updating for end of month. No changes in my position:My position:Shares: 18,000 shares at 397.5p = £71,550Cash: £16.09Latest hypothetical drip feeding purchase on last day of month (30/6/2023):1335 shares at 397.5p (last closing price) including 0.5% stamp duty and £11.95 trading fee (no £1 levy as less than £10k)Price = £5,345.11CTY shares bought: 1335CTY Share Total: 9085Cash position: £37,379.20 - £5,345.11 = £32,034.09Total Value: (9085 x 397.5p) + £32,034.09 cash = £68,146.97My position remains unchanged at 18,000 shares held. I had considered adding new capital at recent lows (which would have complicated this exercise - ignore it or maybe call it leverage). But given last month returned 6.15% on a money market fund, I'm in no hurry to put capital at risk for a lower 5% yield.I was a bit lax and missed the drip feeding update at the end of July, so adding now for hypothetical drip feeding on 31/7/23 and 31/8/23:My position (unchanged):Shares: 18,000 shares at 394.5p = £71,010Cash: £16.09Latest hypothetical drip feeding purchase on last day of month (31/7/2023):1315 shares at 402.5p (last closing price) including 0.5% stamp duty and £11.95 trading fee (no £1 levy as less than £10k)Price = £5,331.29CTY shares bought: 1315CTY Share Total: 10,400Cash position: £32,034.09 - £5,331.29 = £26,702.80Total Value: (10400 x 402.5p) + £26,702.80 cash = £68,562.80Latest hypothetical drip feeding purchase on last day of month (31/8/2023):1340 shares at 394.5p (last closing price) including 0.5% stamp duty and £11.95 trading fee (no £1 levy as less than £10k)Price = £5,324.68CTY shares bought: 1340CTY Share Total: 11,740Cash position: £26,702.80 - £5,324.68 = £21,378.12Total Value: (11,740 x 394.5p) + £21,378.12 cash = £67,692.42Updating (late again - sorry) for end of Sept.My position (unchanged):Shares: 18,000 shares at 397p = £71,460Cash: £16.09Latest hypothetical drip feeding purchase on last day of month (29/9/2023):1335 shares at 397p (last closing price) including 0.5% stamp duty and £11.95 trading fee (no £1 levy as less than £10k)Price = £5,338.40CTY shares bought: 1335CTY Share Total: 13,075Cash position: £21,378.12 - £5,338.40 = £16,039.72Total Value: (13,075 x 397) + £16,039.72 cash = £67,947.47At the close of the third quarter, I'm still well ahead of a hypothetical drip feeding strategy, despite only having made a single trade. @coastline has done even better increasing their holding (units) by 8.7% where the market price has fallen by ~4% giving net return of 4.3% and turning a loss making period into a profit.Let's see where the final quarter takes us.The end of year is upon us, so lets see how we've done.My position remains unchanged - I've not been very active at trying to trade the market in the second part of the year, and was content to hold and collect the dividend income. I did think about adding more in the lows of October, but the price never quite reached my target price, and as a result I invested new capital elsewhere.So my position remains as:My position (unchanged):Shares: 18,000 shares at 409p = £73,620Cash: £16.09Total: £73,636.09Let's update our notional drip feed exercise too, so purchases for the last trading days of Oct, Nov and Dec:31/10/2023buy 1400 shares at 375p (plus fees) for £5288.20Total shares: 13075 + 1400 = 14475Cash: £16,039.72 - £5288.20 = £10751.5230/11/2023buy 1350 shares at 392.5p (plus fees) for £5337.19Total shares: 14475 + 1350 = 15825Cash: £10,751.52 - £5337.19 = £5414.3329/12/2023buy 1314 shares at 409p (plus fees) for £5413.08Total shares: 15825 + 1314 = 17139Cash: £5414.33 - £5413.03 = £1.30Total value: 17,139 shares at 409p plus £1.30 cash = £70,099.81So I have beaten the pound cost averaging by £3520, even in a falling market where the pound cost averaging method should be able to purchase more shares at cheaper prices.The market started the year at 410.5p and ended the year at 409p, so almost flat in terms of share price. We must also consider the 20.2p paid in dividends, which gives a 4.55% total return on the year.In addition to this, I have increased my stake from 17,000 shares to 18,000 shares, so have added an additional 5.88% return by attempting to time the market, thus more than doubling my returns over a simple buy and hold or pound cost averaging strategies.This kind of performance is typical in my experience. I had the potential to perform better, but only traded once during the year. The were other opportunities during the year (as @coastline successfully showed), but I was often otherwise pre-occupied and didn't trade much as a result.I failed to meet my optimistic goal of increasing my holding to 20,000 shares, but took a good step towards that goal - lets see what opportunities the next 12 months brings.In conclusion, I think we have demonstrated that it is possible to time the market. Whether one can consistently do this and consistently add value remains to be seen. Personally, I think it is easier to beat the market in this manner than it is for an active fund manager who must remain fully invested. As a bonus, this year we have also been about to achieve ~5% on cash funds whilst out of the market in short term money market funds - this allows us to substantially de-risk when SPs look high (towards the upper end of their trading range) without substantial drag for holding cash.Thanks to @coastline others for their participation throughout the year. Happy New Year to you all.I am a Forum Ambassador and I support the Forum Team on the Benefits & tax credits, Heat pumps and Green & Ethical MoneySaving forums. If you need any help on those boards, do let me know. Please note that Ambassadors are not moderators. Any post you spot in breach of the Forum Rules should be reported via the report button, or by emailing forumteam@moneysavingexpert.com. All views are my own & not the official line of Money Saving Expert.4


Confirm your email address to Create Threads and Reply

Categories
- All Categories
- 355.1K Banking & Borrowing
- 254.6K Reduce Debt & Boost Income
- 455.8K Spending & Discounts
- 247.9K Work, Benefits & Business
- 604.9K Mortgages, Homes & Bills
- 178.8K Life & Family
- 262.6K Travel & Transport
- 1.5M Hobbies & Leisure
- 16.1K Discuss & Feedback
- 37.7K Read-Only Boards