We’d like to remind Forumites to please avoid political debate on the Forum.
This is to keep it a safe and useful space for MoneySaving discussions. Threads that are – or become – political in nature may be removed in line with the Forum’s rules. Thank you for your understanding.
📨 Have you signed up to the Forum's new Email Digest yet? Get a selection of trending threads sent straight to your inbox daily, weekly or monthly!
I'm timing the market - who's in?
Comments
-
SELL ISF.L at 737.9
DATE BUY/SELL ISF.L UNITS VALUE
18 JAN SELL 765.40 13065 £99,987.05
14 MAR BUY 744.30 13432 £99,974.10
29 MAR DIV 4.28 13432 £100,549
31 MAR SELL 749.22 13432 £101,197.17
10 MAY BUY 756.30 13379 £101,184.22
16 JUNE SELL 747.86 13379 £100,043.23
16 JUNE DIV 10.40 13379 £101,434.65
23 JUNE BUY 725.80 13973 £101,421.70
19 JULY SELL 736.10 13973 £102,842.30
15 AUG BUY 727.20 14140 £102,829.35
30 AUG SELL 737.90 14140 £104,326,113 -
NedS said:NedS said:NedS said:No updates from me.My position:Shares: 18,000 shares at 422p = £75960Cash: £16.09Latest hypothetical drip feeding purchase on last day of month (30/4/2023):1270 shares at 422p (last closing price) including 0.5% stamp duty and £11.95 trading fee (no £1 levy as less than £10k)Price = £5398.15CTY shares bought: 1270CTY Share Total: 6400Cash position: £48,216.30 - £ 5,398.15 = £42,818.15Total Value: (6400 x 422p) + £42,818.15 cash = £69826.15No updates from me.My position:Shares: 18,000 shares at 400p = £72,000Cash: £16.09Latest hypothetical drip feeding purchase on last day of month (31/5/2023):1350 shares at 400p (last closing price) including 0.5% stamp duty and £11.95 trading fee (no £1 levy as less than £10k)Price = £5,438.95CTY shares bought: 1350CTY Share Total: 7750Cash position: £42,818.15 - £5,438.95 = £37,379.20Total Value: (7750 x 400p) + £37,379.20 cash = £68379.20
The drip feeding strategy has closed the gap somewhat after my failure to sell at 430p (guilty of waiting for the dividend). An opportunity lost, but I did receive a healthy £909 dividend today.Updating for end of month. No changes in my position:My position:Shares: 18,000 shares at 397.5p = £71,550Cash: £16.09Latest hypothetical drip feeding purchase on last day of month (30/6/2023):1335 shares at 397.5p (last closing price) including 0.5% stamp duty and £11.95 trading fee (no £1 levy as less than £10k)Price = £5,345.11CTY shares bought: 1335CTY Share Total: 9085Cash position: £37,379.20 - £5,345.11 = £32,034.09Total Value: (9085 x 397.5p) + £32,034.09 cash = £68,146.97My position remains unchanged at 18,000 shares held. I had considered adding new capital at recent lows (which would have complicated this exercise - ignore it or maybe call it leverage). But given last month returned 6.15% on a money market fund, I'm in no hurry to put capital at risk for a lower 5% yield.I was a bit lax and missed the drip feeding update at the end of July, so adding now for hypothetical drip feeding on 31/7/23 and 31/8/23:My position (unchanged):Shares: 18,000 shares at 394.5p = £71,010Cash: £16.09Latest hypothetical drip feeding purchase on last day of month (31/7/2023):1315 shares at 402.5p (last closing price) including 0.5% stamp duty and £11.95 trading fee (no £1 levy as less than £10k)Price = £5,331.29CTY shares bought: 1315CTY Share Total: 10,400Cash position: £32,034.09 - £5,331.29 = £26,702.80Total Value: (10400 x 402.5p) + £26,702.80 cash = £68,562.80Latest hypothetical drip feeding purchase on last day of month (31/8/2023):1340 shares at 394.5p (last closing price) including 0.5% stamp duty and £11.95 trading fee (no £1 levy as less than £10k)Price = £5,324.68CTY shares bought: 1340CTY Share Total: 11,740Cash position: £26,702.80 - £5,324.68 = £21,378.12Total Value: (11,740 x 394.5p) + £21,378.12 cash = £67,692.42
I am a Forum Ambassador and I support the Forum Team on the Benefits & tax credits, Heat pumps and Green & Ethical MoneySaving forums. If you need any help on those boards, do let me know. Please note that Ambassadors are not moderators. Any post you spot in breach of the Forum Rules should be reported via the report button, or by emailing forumteam@moneysavingexpert.com. All views are my own & not the official line of Money Saving Expert.2 -
BUY ISF.L at 734.5coastline said:SELL ISF.L at 737.9
DATE BUY/SELL ISF.L UNITS VALUE
18 JAN SELL 765.40 13065 £99,987.05
14 MAR BUY 744.30 13432 £99,974.10
29 MAR DIV 4.28 13432 £100,549
31 MAR SELL 749.22 13432 £101,197.17
10 MAY BUY 756.30 13379 £101,184.22
16 JUNE SELL 747.86 13379 £100,043.23
16 JUNE DIV 10.40 13379 £101,434.65
23 JUNE BUY 725.80 13973 £101,421.70
19 JULY SELL 736.10 13973 £102,842.30
15 AUG BUY 727.20 14140 £102,829.35
30 AUG SELL 737.90 14140 £104,326,11
28 SEPT BUY 734.50 14201 £104,313.162 -
NedS said:NedS said:NedS said:NedS said:No updates from me.My position:Shares: 18,000 shares at 422p = £75960Cash: £16.09Latest hypothetical drip feeding purchase on last day of month (30/4/2023):1270 shares at 422p (last closing price) including 0.5% stamp duty and £11.95 trading fee (no £1 levy as less than £10k)Price = £5398.15CTY shares bought: 1270CTY Share Total: 6400Cash position: £48,216.30 - £ 5,398.15 = £42,818.15Total Value: (6400 x 422p) + £42,818.15 cash = £69826.15No updates from me.My position:Shares: 18,000 shares at 400p = £72,000Cash: £16.09Latest hypothetical drip feeding purchase on last day of month (31/5/2023):1350 shares at 400p (last closing price) including 0.5% stamp duty and £11.95 trading fee (no £1 levy as less than £10k)Price = £5,438.95CTY shares bought: 1350CTY Share Total: 7750Cash position: £42,818.15 - £5,438.95 = £37,379.20Total Value: (7750 x 400p) + £37,379.20 cash = £68379.20
The drip feeding strategy has closed the gap somewhat after my failure to sell at 430p (guilty of waiting for the dividend). An opportunity lost, but I did receive a healthy £909 dividend today.Updating for end of month. No changes in my position:My position:Shares: 18,000 shares at 397.5p = £71,550Cash: £16.09Latest hypothetical drip feeding purchase on last day of month (30/6/2023):1335 shares at 397.5p (last closing price) including 0.5% stamp duty and £11.95 trading fee (no £1 levy as less than £10k)Price = £5,345.11CTY shares bought: 1335CTY Share Total: 9085Cash position: £37,379.20 - £5,345.11 = £32,034.09Total Value: (9085 x 397.5p) + £32,034.09 cash = £68,146.97My position remains unchanged at 18,000 shares held. I had considered adding new capital at recent lows (which would have complicated this exercise - ignore it or maybe call it leverage). But given last month returned 6.15% on a money market fund, I'm in no hurry to put capital at risk for a lower 5% yield.I was a bit lax and missed the drip feeding update at the end of July, so adding now for hypothetical drip feeding on 31/7/23 and 31/8/23:My position (unchanged):Shares: 18,000 shares at 394.5p = £71,010Cash: £16.09Latest hypothetical drip feeding purchase on last day of month (31/7/2023):1315 shares at 402.5p (last closing price) including 0.5% stamp duty and £11.95 trading fee (no £1 levy as less than £10k)Price = £5,331.29CTY shares bought: 1315CTY Share Total: 10,400Cash position: £32,034.09 - £5,331.29 = £26,702.80Total Value: (10400 x 402.5p) + £26,702.80 cash = £68,562.80Latest hypothetical drip feeding purchase on last day of month (31/8/2023):1340 shares at 394.5p (last closing price) including 0.5% stamp duty and £11.95 trading fee (no £1 levy as less than £10k)Price = £5,324.68CTY shares bought: 1340CTY Share Total: 11,740Cash position: £26,702.80 - £5,324.68 = £21,378.12Total Value: (11,740 x 394.5p) + £21,378.12 cash = £67,692.42Updating (late again - sorry) for end of Sept.My position (unchanged):Shares: 18,000 shares at 397p = £71,460Cash: £16.09Latest hypothetical drip feeding purchase on last day of month (29/9/2023):1335 shares at 397p (last closing price) including 0.5% stamp duty and £11.95 trading fee (no £1 levy as less than £10k)Price = £5,338.40CTY shares bought: 1335CTY Share Total: 13,075Cash position: £21,378.12 - £5,338.40 = £16,039.72Total Value: (13,075 x 397) + £16,039.72 cash = £67,947.47At the close of the third quarter, I'm still well ahead of a hypothetical drip feeding strategy, despite only having made a single trade. @coastline has done even better increasing their holding (units) by 8.7% where the market price has fallen by ~4% giving net return of 4.3% and turning a loss making period into a profit.Let's see where the final quarter takes us.I am a Forum Ambassador and I support the Forum Team on the Benefits & tax credits, Heat pumps and Green & Ethical MoneySaving forums. If you need any help on those boards, do let me know. Please note that Ambassadors are not moderators. Any post you spot in breach of the Forum Rules should be reported via the report button, or by emailing forumteam@moneysavingexpert.com. All views are my own & not the official line of Money Saving Expert.2 -
I've been a bit hasty at times with the calls instead of letting the system do the calling. My SIPP is doing better and up another 5%. I've gathered over the years even if you call wrong the market rarely moves 2/3% against you before the next entry point. That's why I play this game. System isn't hard to understand and anybody can do it. Just need a minimum 5K to make it worthwhile.( I'm not day trading if anybody is reading). My broker charges £6 a deal.
Anyway what I see is a seasonal chart which is running to script so far. Who says you can't follow the data. ?
F7TUWR7WsAApC08 (900×696) (twimg.com)
F7jPoZdWYAAx97H (679×461) (twimg.com)
So if it plays out early OCT is a low and then a rally to the year end.( only guesswork as nobody knows)
chart.png (645×468) (equityclock.com)
Recently it's all been about "higher rates for longer" and it's clear to see the connection ( sometimes there isn't a reason ). TLT v SP500.
iShares 20+ Year Treasury Bond ETF, TLT Advanced Chart - (NAS) TLT, iShares 20+ Year Treasury Bond ETF Stock Price - BigCharts.com (marketwatch.com)
Every market is just about washed out. NYSE only 15% of stocks above 50 day MA.
Public ChartLists | StockCharts.com
Daily SP500 look at the lower indicators , STOC RSI etc.
sc.png (780×828) (equityclock.com)
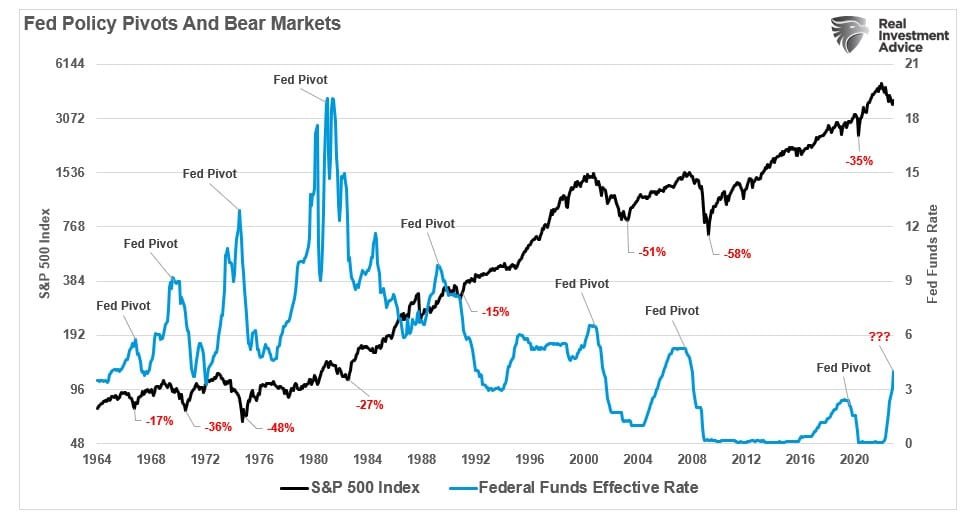
So probability suggests we go higher from here pity I called 28th SEPT. Anyway what happens when the FED pivots and then cuts as the economy struggles. Nasty at times but yesterdays job figures in the US suggest no recession at the moment . Another data set which is well highlighted. After the bond crash we don't want this.
Fed-Funds-and-Bear-Markets.jpg (968×519) (realinvestmentadvice.com)
3 -
Nebulous2 said:
I've been intending joining in this, on a smaller scale. Up until now I've done nothing at all. Somehow it is a bigger hill to climb when it is real money on the table. I had intentions of selling at £90.00, but that hasn't materialised.Nebulous2 said:This is a bit rich and clever for me - I'm already sort of retired, so reluctant to play with my future to that extent.
However -are you using limit orders?
I've got £15k in a SIPP, which I've built up from my part-time earnings since retiring. Its building at £500 a month. I left it in cash until June, when I dipped a toe in the water by buying some VWRP at around £76.50. As luck would have it, I bought these first ones on more or less the low for the year. They went up and I set a target of £80 to buy more. At some point I got fed-up waiting for them to drop and bought some at over that, but then I got some more at under it. I'm currently £380 up with an average price under £80 and less than £1k in cash left.
What I've been doing, if they are close to my target, is setting a limit order. So they'll be at £80.50 and I'll ask to buy £3k at 79.90 first thing in the morning. I've set a limit 8-10 times and only been successful 3 times. The limit with Fidelity expires at the end of the day, but it means I can gain from any mid-day fluctuations, such as a rise in the £. On one occasion my order was filled at less than any price I saw showing for the day.
Apologies if I'm teaching my granny to suck eggs, but you could set a limit regularly, say to sell 2000 shares at 426, and leave the market to perform, or not....
Meantime my cash has been building at £500 a month until I had just over £2500.
I've bought 29 shares today at £84.79 with a limit order. I set the limit rather hurriedly at my work, when the price was £85.12.
I now have 220 shares valued at £84.68 or £18,629.60.
£194.97 still in cash.
I think I've had a lesson in being too greedy.
My target for sometime has been £90. On the 15th of September VWRP reached £89.87. I was working that day, so didn't have the opportunity to follow the market closely. I set a limit order to sell all 220 at £90.25. Unfortunately it never got there, and has since fallen back quite a bit. Maybe I should have sold at the market price rather than trying to squeeze out a bit more....2 -
You're not alone in thinking round numbers as many do with targets. Trouble is the highs and lows , short or long term, are rarely like this. That's another reason I just play with the momentum indicators. Hope the link works as it's set with my system . Around MID SEPT the stochastic indicator breaks from overbought and around 89 hits the 10 day MA. Both alerts are now broken so we sell. Now we are oversold and you can either buy here or wait for conformation hitting the MA . To be honest I just buy most of the time when oversold but things can get even more oversold . Chance you take.Nebulous2 said:Nebulous2 said:
I've been intending joining in this, on a smaller scale. Up until now I've done nothing at all. Somehow it is a bigger hill to climb when it is real money on the table. I had intentions of selling at £90.00, but that hasn't materialised.Nebulous2 said:This is a bit rich and clever for me - I'm already sort of retired, so reluctant to play with my future to that extent.
However -are you using limit orders?
I've got £15k in a SIPP, which I've built up from my part-time earnings since retiring. Its building at £500 a month. I left it in cash until June, when I dipped a toe in the water by buying some VWRP at around £76.50. As luck would have it, I bought these first ones on more or less the low for the year. They went up and I set a target of £80 to buy more. At some point I got fed-up waiting for them to drop and bought some at over that, but then I got some more at under it. I'm currently £380 up with an average price under £80 and less than £1k in cash left.
What I've been doing, if they are close to my target, is setting a limit order. So they'll be at £80.50 and I'll ask to buy £3k at 79.90 first thing in the morning. I've set a limit 8-10 times and only been successful 3 times. The limit with Fidelity expires at the end of the day, but it means I can gain from any mid-day fluctuations, such as a rise in the £. On one occasion my order was filled at less than any price I saw showing for the day.
Apologies if I'm teaching my granny to suck eggs, but you could set a limit regularly, say to sell 2000 shares at 426, and leave the market to perform, or not....
Meantime my cash has been building at £500 a month until I had just over £2500.
I've bought 29 shares today at £84.79 with a limit order. I set the limit rather hurriedly at my work, when the price was £85.12.
I now have 220 shares valued at £84.68 or £18,629.60.
£194.97 still in cash.
I think I've had a lesson in being too greedy.
My target for sometime has been £90. On the 15th of September VWRP reached £89.87. I was working that day, so didn't have the opportunity to follow the market closely. I set a limit order to sell all 220 at £90.25. Unfortunately it never got there, and has since fallen back quite a bit. Maybe I should have sold at the market price rather than trying to squeeze out a bit more....
Vanguard FTSE All-World UCITS ETF (VWRP.L) Interactive Stock Chart - Yahoo Finance
This is a bit faster with the signals but the basics are there.
Vanguard FTSE All-World ETF, UK:VWRL Advanced Chart - (LON) UK:VWRL, Vanguard FTSE All-World ETF Stock Price - BigCharts.com (marketwatch.com)
2 -
What a difference a month makes. I'm still frustrated at myself for missing on selling out. I've now moved from selling to buying.Nebulous2 said:Nebulous2 said:
I've been intending joining in this, on a smaller scale. Up until now I've done nothing at all. Somehow it is a bigger hill to climb when it is real money on the table. I had intentions of selling at £90.00, but that hasn't materialised.Nebulous2 said:This is a bit rich and clever for me - I'm already sort of retired, so reluctant to play with my future to that extent.
However -are you using limit orders?
I've got £15k in a SIPP, which I've built up from my part-time earnings since retiring. Its building at £500 a month. I left it in cash until June, when I dipped a toe in the water by buying some VWRP at around £76.50. As luck would have it, I bought these first ones on more or less the low for the year. They went up and I set a target of £80 to buy more. At some point I got fed-up waiting for them to drop and bought some at over that, but then I got some more at under it. I'm currently £380 up with an average price under £80 and less than £1k in cash left.
What I've been doing, if they are close to my target, is setting a limit order. So they'll be at £80.50 and I'll ask to buy £3k at 79.90 first thing in the morning. I've set a limit 8-10 times and only been successful 3 times. The limit with Fidelity expires at the end of the day, but it means I can gain from any mid-day fluctuations, such as a rise in the £. On one occasion my order was filled at less than any price I saw showing for the day.
Apologies if I'm teaching my granny to suck eggs, but you could set a limit regularly, say to sell 2000 shares at 426, and leave the market to perform, or not....
Meantime my cash has been building at £500 a month until I had just over £2500.
I've bought 29 shares today at £84.79 with a limit order. I set the limit rather hurriedly at my work, when the price was £85.12.
I now have 220 shares valued at £84.68 or £18,629.60.
£194.97 still in cash.
I think I've had a lesson in being too greedy.
My target for sometime has been £90. On the 15th of September VWRP reached £89.87. I was working that day, so didn't have the opportunity to follow the market closely. I set a limit order to sell all 220 at £90.25. Unfortunately it never got there, and has since fallen back quite a bit. Maybe I should have sold at the market price rather than trying to squeeze out a bit more....
I had around £1200 in cash in my SIPP, which doesn't give a lot of scope, but I've bought 14 VWRP at £84.792 -
Gone from oversold 8th Oct as I mentioned to overbought mid Oct and now oversold again. Again it's all about taking the moves..Nebulous2 said:
What a difference a month makes. I'm still frustrated at myself for missing on selling out. I've now moved from selling to buying.Nebulous2 said:Nebulous2 said:
I've been intending joining in this, on a smaller scale. Up until now I've done nothing at all. Somehow it is a bigger hill to climb when it is real money on the table. I had intentions of selling at £90.00, but that hasn't materialised.Nebulous2 said:This is a bit rich and clever for me - I'm already sort of retired, so reluctant to play with my future to that extent.
However -are you using limit orders?
I've got £15k in a SIPP, which I've built up from my part-time earnings since retiring. Its building at £500 a month. I left it in cash until June, when I dipped a toe in the water by buying some VWRP at around £76.50. As luck would have it, I bought these first ones on more or less the low for the year. They went up and I set a target of £80 to buy more. At some point I got fed-up waiting for them to drop and bought some at over that, but then I got some more at under it. I'm currently £380 up with an average price under £80 and less than £1k in cash left.
What I've been doing, if they are close to my target, is setting a limit order. So they'll be at £80.50 and I'll ask to buy £3k at 79.90 first thing in the morning. I've set a limit 8-10 times and only been successful 3 times. The limit with Fidelity expires at the end of the day, but it means I can gain from any mid-day fluctuations, such as a rise in the £. On one occasion my order was filled at less than any price I saw showing for the day.
Apologies if I'm teaching my granny to suck eggs, but you could set a limit regularly, say to sell 2000 shares at 426, and leave the market to perform, or not....
Meantime my cash has been building at £500 a month until I had just over £2500.
I've bought 29 shares today at £84.79 with a limit order. I set the limit rather hurriedly at my work, when the price was £85.12.
I now have 220 shares valued at £84.68 or £18,629.60.
£194.97 still in cash.
I think I've had a lesson in being too greedy.
My target for sometime has been £90. On the 15th of September VWRP reached £89.87. I was working that day, so didn't have the opportunity to follow the market closely. I set a limit order to sell all 220 at £90.25. Unfortunately it never got there, and has since fallen back quite a bit. Maybe I should have sold at the market price rather than trying to squeeze out a bit more....
I had around £1200 in cash in my SIPP, which doesn't give a lot of scope, but I've bought 14 VWRP at £84.79
Vanguard FTSE All-World ETF, UK:VWRL Advanced Chart - (LON) UK:VWRL, Vanguard FTSE All-World ETF Stock Price - BigCharts.com (marketwatch.com)
I've missed a call to sell days ago as I was away and it's a bit unfair to use hindsight calls. It's pretty clear around 740p where both safeguards are broken. Still I'm outperforming the index and in a falling market most of the time.
iShares Core FTSE 100 UCITS ETF, UK:ISF Advanced Chart - (LON) UK:ISF, iShares Core FTSE 100 UCITS ETF Stock Price - BigCharts.com (marketwatch.com)
Around the 18th OCT all SP500 safeguards were broken . At 4350 price breaks below 10 day MA in red. Stochastic and RSI are oversold. Now into buying territory . That move alone would have been worth 4% and just shows you don't need that many in a year.
$SPX | SharpCharts | StockCharts.com
In the weekly timeframe it's down to price levels of 2 years ago. Stochastic is oversold and doesn't happen often. Last time was a year ago in Oct 2022 then a rally.
$SPX | SharpCharts | StockCharts.com
4 -
SELL ISF.L at 729.40coastline said:
BUY ISF.L at 734.5coastline said:SELL ISF.L at 737.9
DATE BUY/SELL ISF.L UNITS VALUE
18 JAN SELL 765.40 13065 £99,987.05
14 MAR BUY 744.30 13432 £99,974.10
29 MAR DIV 4.28 13432 £100,549
31 MAR SELL 749.22 13432 £101,197.17
10 MAY BUY 756.30 13379 £101,184.22
16 JUNE SELL 747.86 13379 £100,043.23
16 JUNE DIV 10.40 13379 £101,434.65
23 JUNE BUY 725.80 13973 £101,421.70
19 JULY SELL 736.10 13973 £102,842.30
15 AUG BUY 727.20 14140 £102,829.35
30 AUG SELL 737.90 14140 £104,326,11
DATE BUY/SELL ISF.L UNITS VALUE
18 JAN SELL 765.40 13065 £99,987.05
14 MAR BUY 744.30 13432 £99,974.10
29 MAR DIV 4.28 13432 £100,549
31 MAR SELL 749.22 13432 £101,197.17
10 MAY BUY 756.30 13379 £101,184.22
16 JUNE SELL 747.86 13379 £100,043.23
16 JUNE DIV 10.40 13379 £101,434.65
23 JUNE BUY 725.80 13973 £101,421.70
19 JULY SELL 736.10 13973 £102,842.30
15 AUG BUY 727.20 14140 £102,829.35
30 AUG SELL 737.90 14140 £104,326,11
28 SEPT BUY 734.50 14201 £104,313.16
9 NOV SELL 729.40 14201 £103,569.142


Confirm your email address to Create Threads and Reply

Categories
- All Categories
- 355.2K Banking & Borrowing
- 254.7K Reduce Debt & Boost Income
- 455.8K Spending & Discounts
- 247.9K Work, Benefits & Business
- 605K Mortgages, Homes & Bills
- 178.8K Life & Family
- 262.7K Travel & Transport
- 1.5M Hobbies & Leisure
- 16.1K Discuss & Feedback
- 37.7K Read-Only Boards