We’d like to remind Forumites to please avoid political debate on the Forum.
This is to keep it a safe and useful space for MoneySaving discussions. Threads that are – or become – political in nature may be removed in line with the Forum’s rules. Thank you for your understanding.
📨 Have you signed up to the Forum's new Email Digest yet? Get a selection of trending threads sent straight to your inbox daily, weekly or monthly!
The Forum now has a brand new text editor, adding a bunch of handy features to use when creating posts. Read more in our how-to guide
Economy crash =/= stock market crash?
Comments
-
coastline said:Straight forward video which is similar to what I've tried to post in chart form recently. It can go anywhere really between a P/E of 20 and 10. Just the same as buying individual shares which might even go to P/E 30 in a growth phase.Good post, as usual. If I can add to it, the video does explain (and Pensioncraft have been saying for a while) how P/E (or CAPE) valuations falling back to longer term average accounts for the drop in the first half of this year (the removal of positive sentiment mentioned by others). But that's only half the story because it assumes earnings will hold up.
That's the great unknown at the moment. The fed wants to ensure earnings don't rise (=embedded inflation), and their actions to prevent that may cause earnings to fall, in which case for the P/E to remain, if not pessimistic, then at least less ebullient, stock prices will have to fall. This is the second half fall that leads to commentators suggesting we are only half way. Such a fall would be quite reasonable and far from a disaster scenario that a few interesting people are suggesting of course!And it might well be that when this happens (=inflation under control) the fed loosens a bit, raising P/E and countering the fall in earnings meaning we don't have the second half dip, or not for as long.0 -
InvesterJones said:
Second editThe fed wants to ensure earnings wages don't rise (=embedded inflation),
0 -
"The interest is upAnd the stock market's downAnd you only get muggedIf you go downtown"Hank Williams Jr - 19810
-
Just let this thread die already6
-
Sell FTSE 7290coastline said:
I'll start again but wipe the slate clean. See if I can win just one person over . Never mind . BUY FTSE 100 at 7100.coastline said:
Sell FTSE 7250. Struggling a bit now.coastline said:
Buy FTSE 7080coastline said:
Sell FTSE 7230...coastline said:
Buy FTSE 6830 as the system goes.coastline said:
Just a little update not that anybody will be really bothered . Never mind I was asked so I'll highlight my system. Looking at the link which is not the best package the Slow Stochastic curled upwards as I explained around 6850-6900 to buy. Today we sit on the top of overbought region at 7110. Sell at 7110. Not perfect and could still go higher but 7040 down to 6900 and up again to 7110 is around 350 points.coastline said:Sell the FTSE 100 at 7040 . Right or wrong there's plenty more to go at.
FTSE 100 Index, UK:UKX Advanced Chart - (FTSE UK) UK:UKX, FTSE 100 Index Stock Price - BigCharts.com (marketwatch.com)
You could set the same on here if anybody is interested. Good luck everyone whatever your allocations are.
ISF.L | SharpChart | StockCharts.com
DATE BUY/SELL FTSE POINTS
JULY 15 SELL 7040 0
JULY 20 BUY 6900 140
AUG 5 SELL 7110 350
DATE BUY/SELL FTSE POINTS
JULY 15 SELL 7040 0
JULY 20 BUY 6900 140
AUG 5 SELL 7110 350
SEPT 20 BUY 6830 630
Set both charts with Slow Stochastic and Williams%R from the lower indicators..Good Luck everyone.
ISF.L | SharpChart | StockCharts.com
FTSE 100 Index chart, prices and performance - Investors Chronicle
DATE BUY/SELL FTSE POINTS
JULY 15 SELL 7040 0
JULY 20 BUY 6900 140
AUG 5 SELL 7110 350
SEPT 20 BUY 6830 630
OCT 15 SELL 7230 1030
DATE BUY/SELL FTSE POINTS
JULY 15 SELL 7040 0
JULY 20 BUY 6900 140
AUG 5 SELL 7110 350
SEPT 20 BUY 6830 630
OCT 15 SELL 7230 1030
NOV 26 BUY 7080 1180
DATE BUY/SELL FTSE POINTS
JULY 15 SELL 7040 0
JULY 20 BUY 6900 140
AUG 5 SELL 7110 350
SEPT 20 BUY 6830 630
OCT 15 SELL 7230 1030
NOV 26 BUY 7080 1180
DEC 17 SELL 7250 1350
DATE BUY/SELL FTSE POINTS
JUNE 16 BUY 7100 0
DATE BUY/SELL FTSE POINTS
JUNE 16 BUY 7100 0
JULY 22 SELL 7290 1903 -
My growth stocks are up 12% since one month ago.0
-
Important News this week:Earning Season of mega caps companies to be reported, US-GDP to be reported that will decide whether the US economy will be official in recession, announcement of how many basis point of the interest hike in the US.
 2
2 -
adindas said:Important News this week:Earning Season of mega caps companies to be reported, US-GDP to be reported that will decide whether the US economy will be official in recession, announcement of how many basis point of the interest hike in the US.
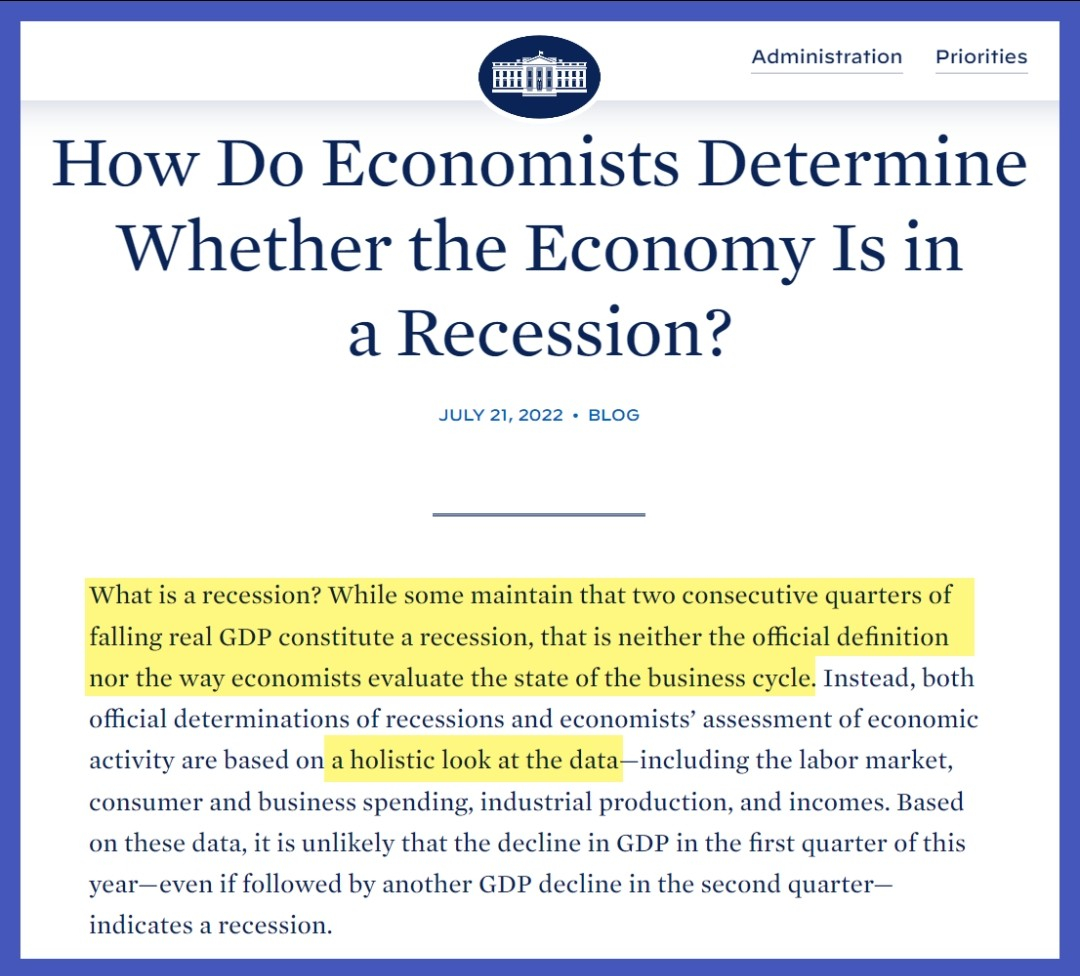
Have you not heard the definition of recession has been changed?
0 -
Type_45 said:adindas said:Important News this week:Earning Season of mega caps companies to be reported, US-GDP to be reported that will decide whether the US economy will be official in recession, announcement of how many basis point of the interest hike in the US.
Have you not heard the definition of recession has been changed?
That political definition was already known since Middle of June 2022. Which president / government want to be remembered as the party who takes the Country into recession ??
0 -
A recession is two consecutive quarters of negative growth. That has been the definition of recession for decades.adindas said:Type_45 said:adindas said:Important News this week:Earning Season of mega caps companies to be reported, US-GDP to be reported that will decide whether the US economy will be official in recession, announcement of how many basis point of the interest hike in the US.
Have you not heard the definition of recession has been changed?
That political definition was already known since Middle of June 2022. Which president / government want to be remembered as the party who takes the Country into recession ??
0


Confirm your email address to Create Threads and Reply

Categories
- All Categories
- 354.6K Banking & Borrowing
- 254.5K Reduce Debt & Boost Income
- 455.5K Spending & Discounts
- 247.5K Work, Benefits & Business
- 604.3K Mortgages, Homes & Bills
- 178.5K Life & Family
- 261.9K Travel & Transport
- 1.5M Hobbies & Leisure
- 16.1K Discuss & Feedback
- 37.7K Read-Only Boards