We’d like to remind Forumites to please avoid political debate on the Forum.
This is to keep it a safe and useful space for MoneySaving discussions. Threads that are – or become – political in nature may be removed in line with the Forum’s rules. Thank you for your understanding.
📨 Have you signed up to the Forum's new Email Digest yet? Get a selection of trending threads sent straight to your inbox daily, weekly or monthly!
The Forum now has a brand new text editor, adding a bunch of handy features to use when creating posts. Read more in our how-to guide
Economy crash =/= stock market crash?
Comments
-
masonic said:
A simpler explanation is that the yield curve reflects an expectation of more dovish interest rate policy, which could be explained by either inflation or GDP (or both) falling). US core inflation is falling, so there isn't necessarily anything more to read into that data. The trend in S&P500 over the last 5 days has been upward.Type_45 said:
I think fund managers can see the 2yr/10yr and all the other signs of where things are going and they are slowly pulling out of the market. Hence the downward trend. They can't pull it all out at once because they will lose money.GazzaBloom said:
Do you not think that there may just be other people out there, some perhaps managing billions of £$$ of investors money, that may just have come to their own conclusions on the future global economic outlook and already positioned investments accordingly? Or do you think they are likely to be seismically shocked by your unique insight?Type_45 said:
It's gone flat and there's no spread between the 2s and 10s. This is the bond market being incredibly pessimistic. It has no belief right now that the USA's economy will grow. They will accept the same amount of yield two years out as 10 years out.masonic said:
That's interesting, could you explain the reasoning behind this please, especially the 'very deep' part?Type_45 said:The 2y/10y Treasury yield confirms that not only is the US probably already in a recession, but that it will be a very deep recession.
It's very bearish and it has an almost perfect track record of forecasting recessions.
The US is already in a recession, it just hasn't been officially anointed yet.
So we can either take action, or we can ignore this and carry on as normal.
The yield curve flattening has preceded each recession in the past 40 years.0 -
Type_45 said:masonic said:
A simpler explanation is that the yield curve reflects an expectation of more dovish interest rate policy, which could be explained by either inflation or GDP (or both) falling). US core inflation is falling, so there isn't necessarily anything more to read into that data. The trend in S&P500 over the last 5 days has been upward.Type_45 said:
I think fund managers can see the 2yr/10yr and all the other signs of where things are going and they are slowly pulling out of the market. Hence the downward trend. They can't pull it all out at once because they will lose money.GazzaBloom said:
Do you not think that there may just be other people out there, some perhaps managing billions of £$$ of investors money, that may just have come to their own conclusions on the future global economic outlook and already positioned investments accordingly? Or do you think they are likely to be seismically shocked by your unique insight?Type_45 said:
It's gone flat and there's no spread between the 2s and 10s. This is the bond market being incredibly pessimistic. It has no belief right now that the USA's economy will grow. They will accept the same amount of yield two years out as 10 years out.masonic said:
That's interesting, could you explain the reasoning behind this please, especially the 'very deep' part?Type_45 said:The 2y/10y Treasury yield confirms that not only is the US probably already in a recession, but that it will be a very deep recession.
It's very bearish and it has an almost perfect track record of forecasting recessions.
The US is already in a recession, it just hasn't been officially anointed yet.
So we can either take action, or we can ignore this and carry on as normal.
The yield curve flattening has preceded each recession in the past 40 years.
So has the fact the sun rose in the East, that doesn't make it much of a predictor though!
1 -
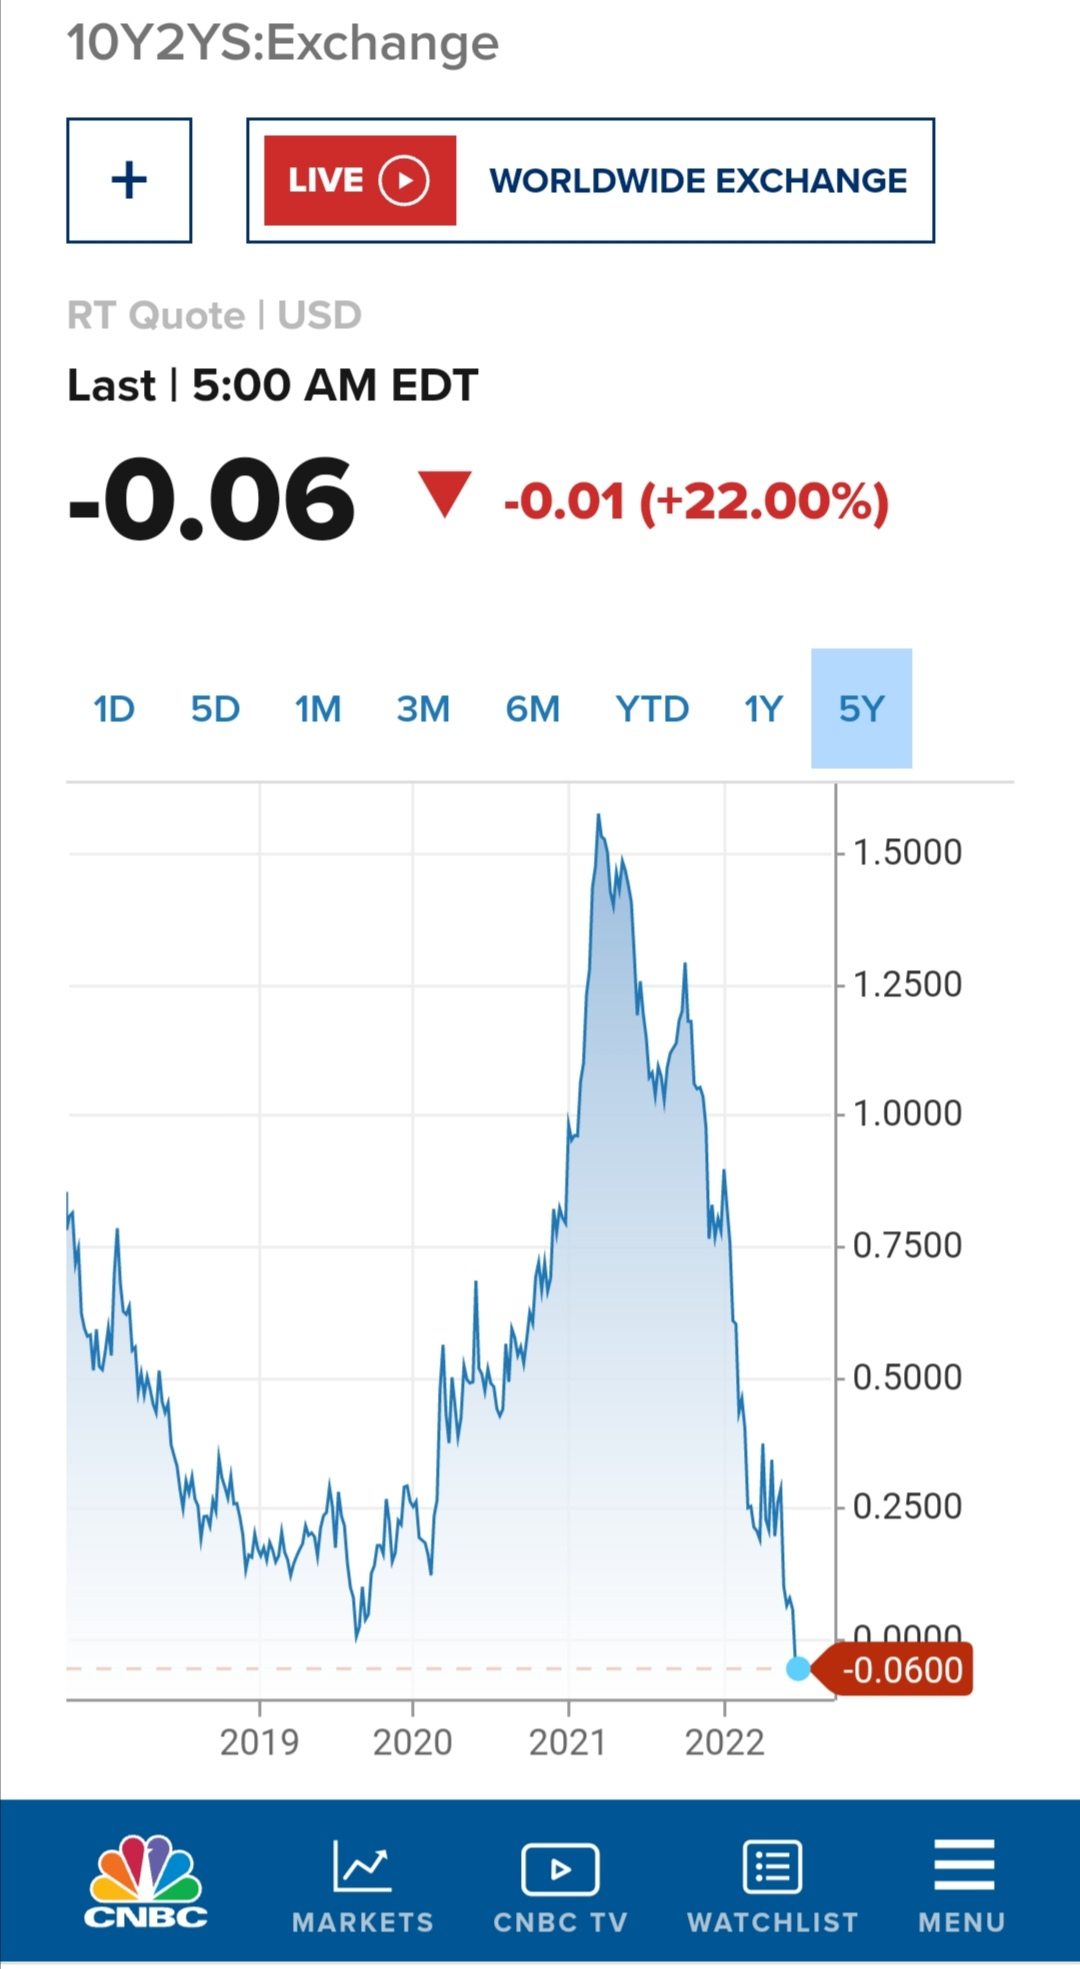
Michael Burry Market Crash 2022 - Halfway There
Michael Burry has said we are only halfway through this stock market selloff in 2022 and that’s pretty shocking given the size of the falls already. In this video, I find myself in the unusual position where I actually agree with a lot of what he says as I dig into what he thinks is going to happen and why.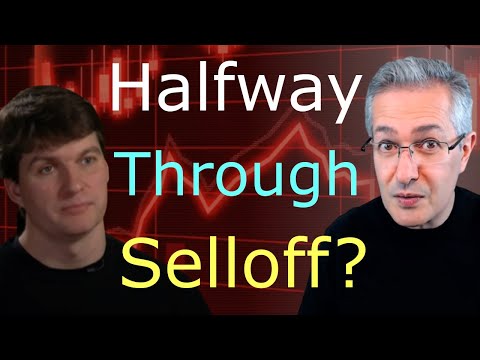 https://www.youtube.com/watch?v=KPla4wM3zOs
0 -
"You could say he wants markets to fall so he's gonna talk markets down" sounds alot like someone on here😲😲😲Type_45 said:Michael Burry Market Crash 2022 - Halfway There
Michael Burry has said we are only halfway through this stock market selloff in 2022 and that’s pretty shocking given the size of the falls already. In this video, I find myself in the unusual position where I actually agree with a lot of what he says as I dig into what he thinks is going to happen and why.https://www.youtube.com/watch?v=KPla4wM3zOs1 -
^^ Well worth a watch. Once again a very clear and considered analysis of the factors that could come into play to drive the S&P500 going forward. The deep despair GFC and deep recession scenario goes as low as a 70% drop, not quite 80%. Of course there are a range of possible outcomes, with that being the very worst. Some even predict growth from here. Mid-table puts us somewhere around 3150, which sounds quite similar to a few people's guesses.
0 -
What the presenter of the video says is that the market is still in "joy" mode. And not everything is "priced in", despite what the Priced In Brigade (TM) would have us believe.0
-
This positive sentiment about the future forms part of what is priced in. The actual future is never priced in, because nobody knows the actual future.Type_45 said:What the presenter of the video says is that the market is still in "joy" mode. And not everything is "priced in", despite what the Priced In Brigade (TM) would have us believe.
1 -
Straight forward video which is similar to what I've tried to post in chart form recently. It can go anywhere really between a P/E of 20 and 10. Just the same as buying individual shares which might even go to P/E 30 in a growth phase.
FQ45fNEXIAQZfJY (900×545) (twimg.com)
Can't remember if much was said about interest rates but when bond yields and FED rates are low then stock market valuations can be a bit higher. ? 1960's is a perfect example shown below.
EZ_91bOXQAAp1Zo (1400×1169) (twimg.com)
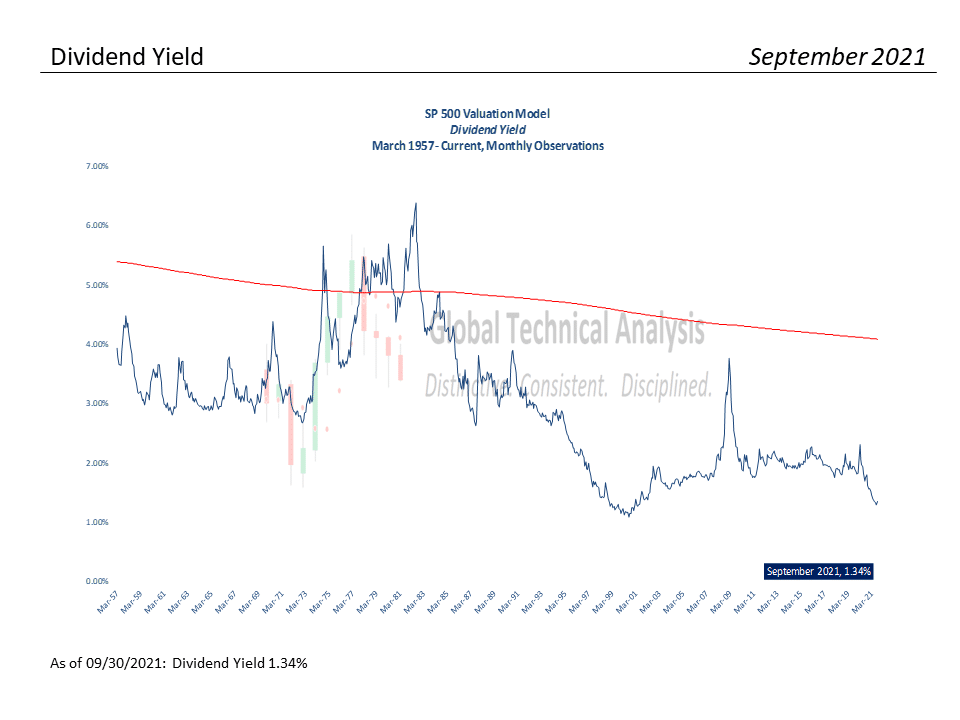
Dividend yields are much lower but I think there's a different taxation method applied today ?
Slide8.png (960×720) (realinvestmentadvice.com)
Again in the 1960's when FED rates got to 4-6% that's when the trouble started and markets fell.
FJEeOp4WQAocSbD (900×497) (twimg.com)
EwSh2S9WUAAVzU7 (900×546) (twimg.com)
Inflation figures will be out soon and will be vital to market moves. In recent days commodity prices have been falling and in some cases below the February levels during the crisis. Shock inflation below. Is history repeating itself ?
EpXz-ORVQAAGf8D (900×518) (twimg.com)
FW77TKoUsAAGXkF (680×419) (twimg.com)
2 -
This is the most important graph:
0


Confirm your email address to Create Threads and Reply

Categories
- All Categories
- 354.6K Banking & Borrowing
- 254.4K Reduce Debt & Boost Income
- 455.5K Spending & Discounts
- 247.4K Work, Benefits & Business
- 604.3K Mortgages, Homes & Bills
- 178.5K Life & Family
- 261.8K Travel & Transport
- 1.5M Hobbies & Leisure
- 16.1K Discuss & Feedback
- 37.7K Read-Only Boards