We’d like to remind Forumites to please avoid political debate on the Forum.
This is to keep it a safe and useful space for MoneySaving discussions. Threads that are – or become – political in nature may be removed in line with the Forum’s rules. Thank you for your understanding.
📨 Have you signed up to the Forum's new Email Digest yet? Get a selection of trending threads sent straight to your inbox daily, weekly or monthly!
Octopus Tracker
Comments
-
I am aware of Guy Lipman's website but have never got properly acquainted with it - amongst all the others.
What you have reported does indeed surprise me, that Agile seems to be able to maintain its advantage (16%) even when conditions are not particularly in its favour. I for one and I suspect many others would appreciate it if you could maintain your "commentary". The visuals are one thing and one can argue over lines and curves. But when you can back these up with actual tables of data, that is eye-opening.Telegraph Sam
There are also unknown unknowns - the one's we don't know we don't know0 -
Anyone else getting billed on a (roughly) daily average consumption ?On a couple of days last week, I used 0.27kWh and 17.84kWh the next. Yet on my bill, it is showing as 5.4kWh and 6.21kWh for the same days... Whilst the difference is only pennies, I find the lack of accuracy to be irksome and doesn't provide any incentive to make savings when the price surges.Any language construct that forces such insanity in this case should be abandoned without regrets. –
Erik Aronesty, 2014
Treasure the moments that you have. Savour them for as long as you can for they will never come back again.1 -
Missing data is usually responsible for this. Resulting in the index readings and typical profile being used to calculate daily consumption.FreeBear said:Anyone else getting billed on a (roughly) daily average consumption ?On a couple of days last week, I used 0.27kWh and 17.84kWh the next. Yet on my bill, it is showing as 5.4kWh and 6.21kWh for the same days... Whilst the difference is only pennies, I find the lack of accuracy to be irksome and doesn't provide any incentive to make savings when the price surges.
2 -
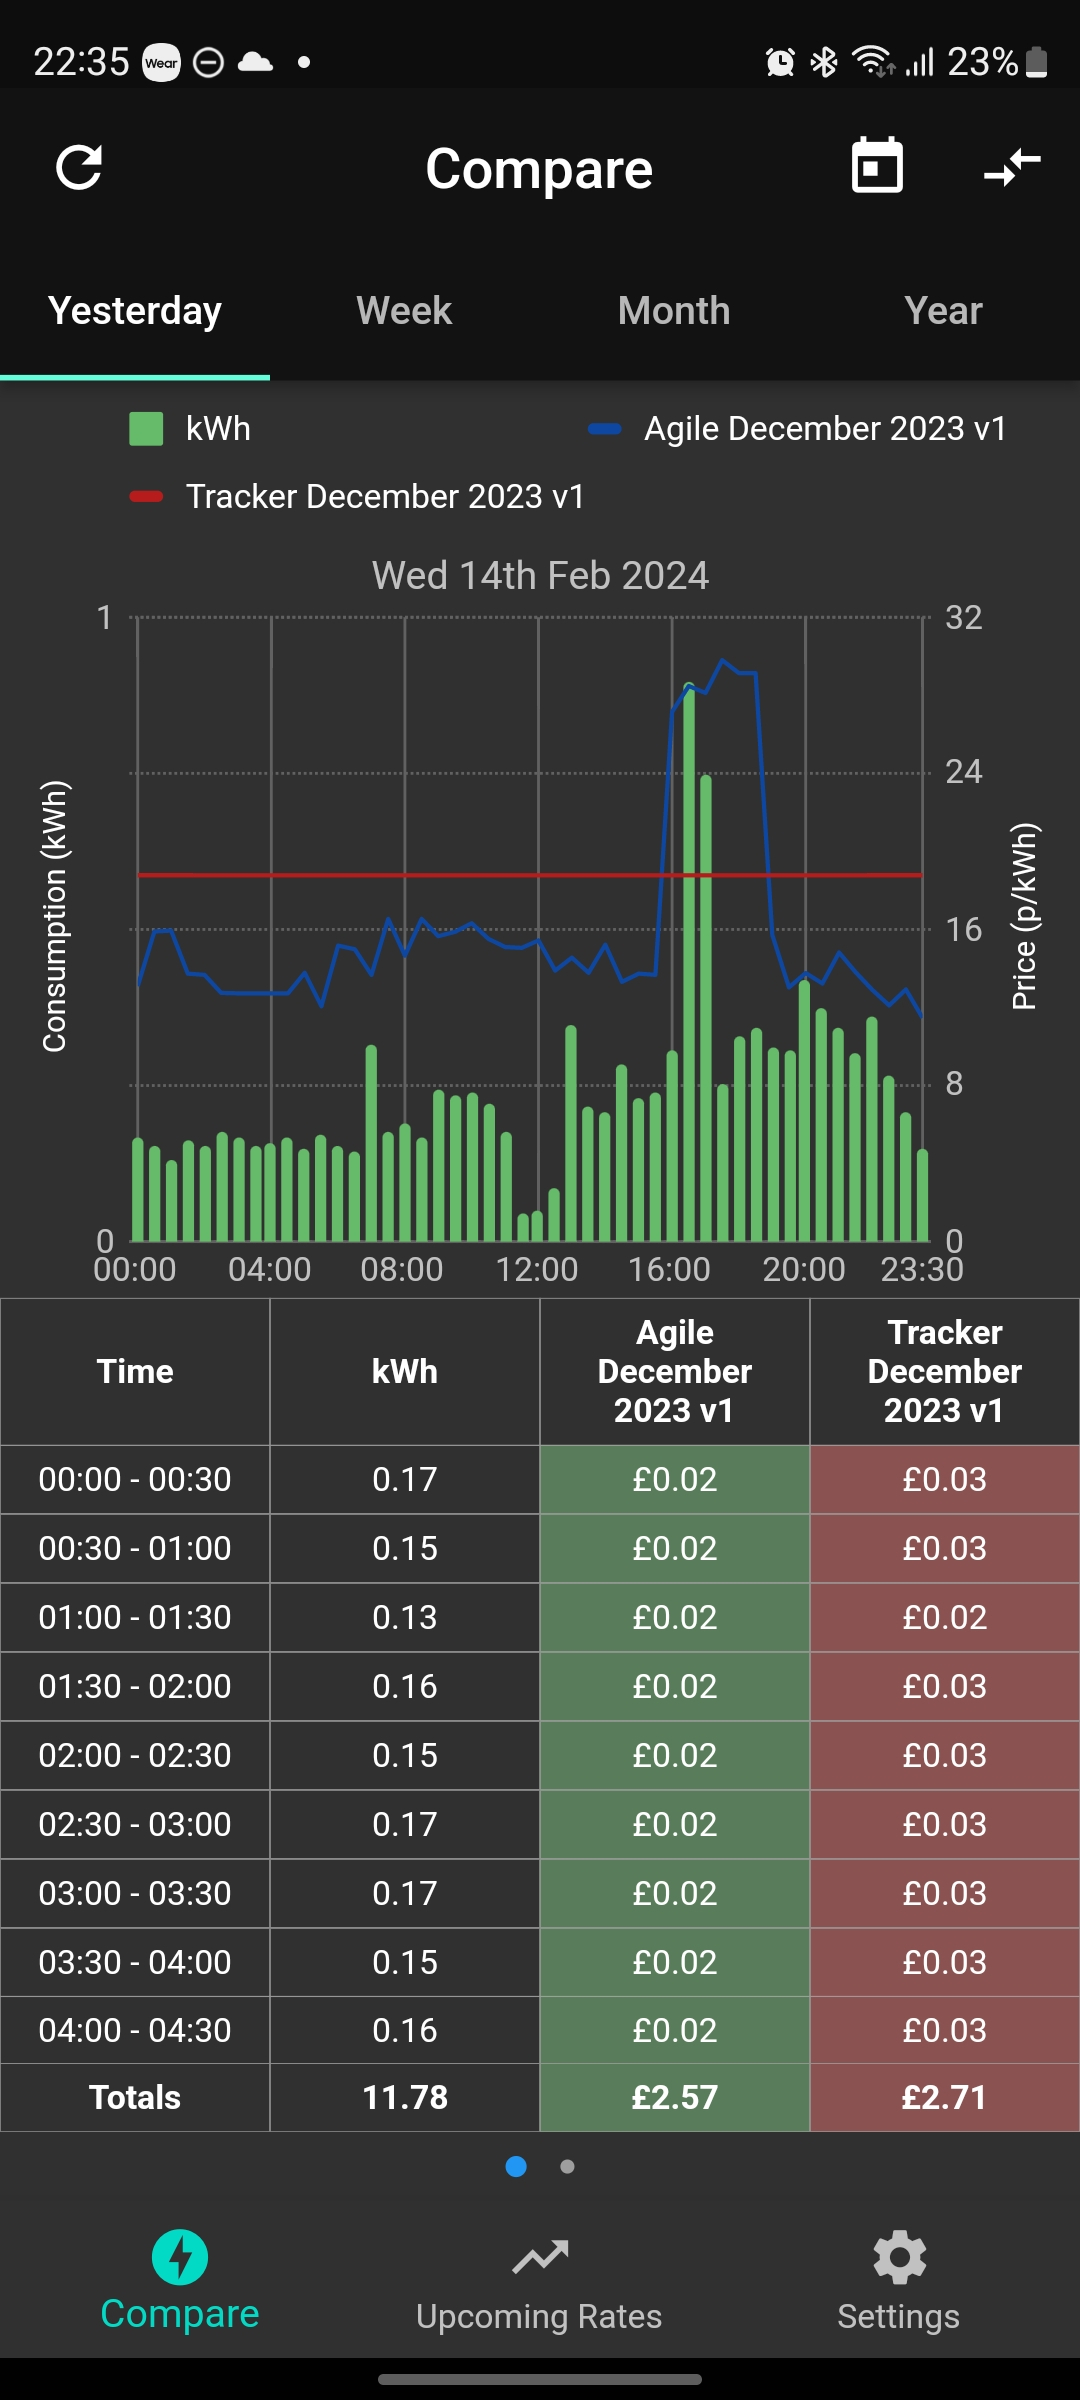
You don't have to shift out of the peak period, I would have saved yesterday on Agile vs the new Tracker formula even though the oven was used in that period.
4.29kWp Solar system, 45/55 South/West split in cloudy rainy Cumbria.0 -
How surprising! What happens if you ask it to show the longer periods?Telegraph Sam
There are also unknown unknowns - the one's we don't know we don't know0 -
My baseline works in my favour, agile without load shifting won't work for those with an extremely low baseline as yourself.masonic said:Spies said:You don't have to shift out of the peak period, I would have saved yesterday on Agile vs the new Tracker formula even though the oven was used in that period.Don't I? It seems my data suggests otherwise.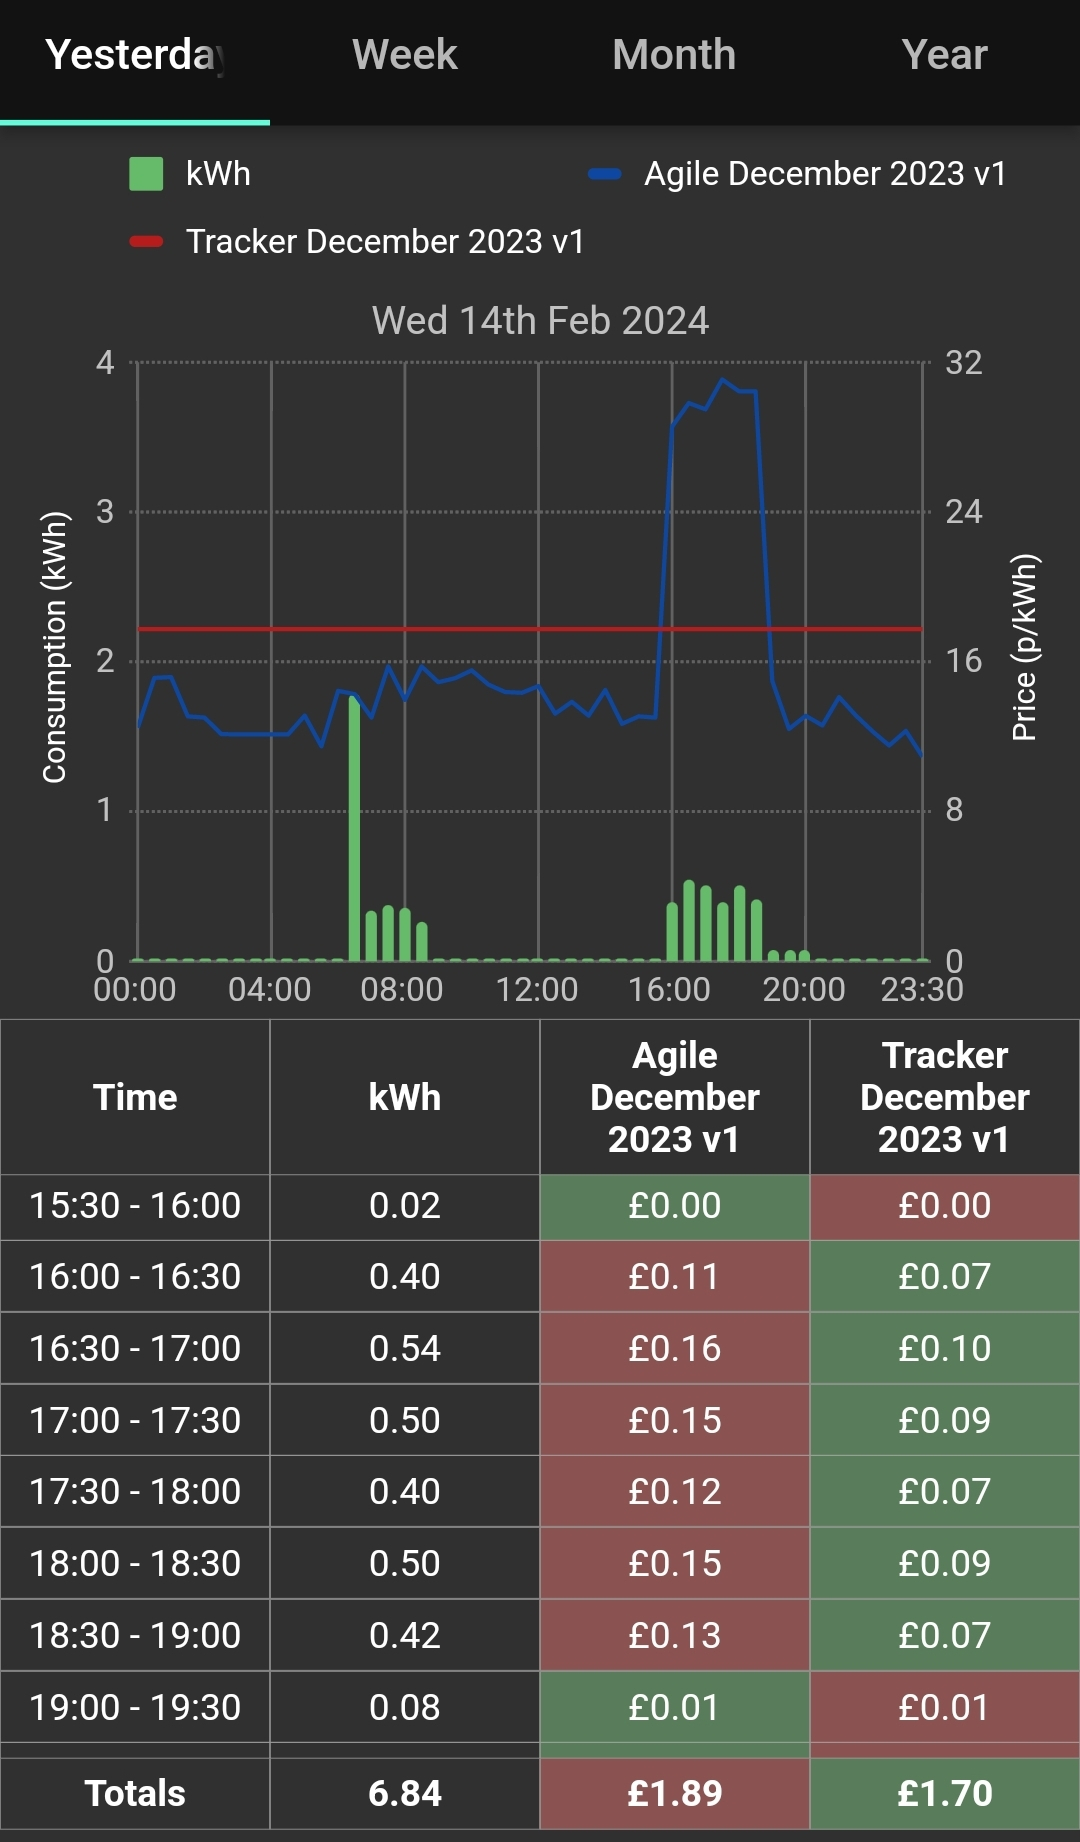 4.29kWp Solar system, 45/55 South/West split in cloudy rainy Cumbria.1
 -
masonic said:
Missing data is usually responsible for this. Resulting in the index readings and typical profile being used to calculate daily consumption.FreeBear said:Anyone else getting billed on a (roughly) daily average consumption ?On a couple of days last week, I used 0.27kWh and 17.84kWh the next. Yet on my bill, it is showing as 5.4kWh and 6.21kWh for the same days... Whilst the difference is only pennies, I find the lack of accuracy to be irksome and doesn't provide any incentive to make savings when the price surges.Sorry, I don't buy in to this missing data thing. Both Bright and the Octopus graphs show when I consumed gas to within a few minutes. Electricity consumption is also showing up (and being billed correctly).It might be that some days, I'm consuming less than 1kWh of gas - Maybe that is causing the Octopus system to conclude data is missing.. In the meantime, I'll wait for Pete to respond to my email.
Any language construct that forces such insanity in this case should be abandoned without regrets. –
Erik Aronesty, 2014
Treasure the moments that you have. Savour them for as long as you can for they will never come back again.0 -
FreeBear said:masonic said:
Missing data is usually responsible for this. Resulting in the index readings and typical profile being used to calculate daily consumption.FreeBear said:Anyone else getting billed on a (roughly) daily average consumption ?On a couple of days last week, I used 0.27kWh and 17.84kWh the next. Yet on my bill, it is showing as 5.4kWh and 6.21kWh for the same days... Whilst the difference is only pennies, I find the lack of accuracy to be irksome and doesn't provide any incentive to make savings when the price surges.Sorry, I don't buy in to this missing data thing. Both Bright and the Octopus graphs show when I consumed gas to within a few minutes. Electricity consumption is also showing up (and being billed correctly).It might be that some days, I'm consuming less than 1kWh of gas - Maybe that is causing the Octopus system to conclude data is missing.. In the meantime, I'll wait for Pete to respond to my email.You didn't mention that you were referring to gas. Price surges are something I'd associate more with electricity. Several people have had this issue with gas. With electricity, people have been able to pin it to single missing half hours, which will be entirely missing from the half hourly consumption tables. You won't see the gaps on Octopus' plots, but if you run your finger over each bar you can see if any half hours are skipped. Do let us know what Pete has to say.0 -
@masonic: My point is that you and I can look at two consumption graphs and come to different conclusions as to visually which is the more expensive in total. Particularly when longer periods are under consideration which to me makes sense. However when these graphs are backed up with kWh values, absolute totals or averages, that should remove any differences of opinion. That said I am struggling to understand why the above "Compare's" come to different totals: All bar one show period = 1 day, tariff = Dec 2023 v1.
There could be a case for a dedicated MSE guru to construct and publish a few model consumption profiles showing "typical" patterns, from which the less initiated like me could select and match their own profile to and thereby arrive at a more informed choice of tariff. Just a thought ...Telegraph Sam
There are also unknown unknowns - the one's we don't know we don't know0


Confirm your email address to Create Threads and Reply

Categories
- All Categories
- 354.8K Banking & Borrowing
- 254.5K Reduce Debt & Boost Income
- 455.6K Spending & Discounts
- 247.6K Work, Benefits & Business
- 604.6K Mortgages, Homes & Bills
- 178.6K Life & Family
- 262.2K Travel & Transport
- 1.5M Hobbies & Leisure
- 16.1K Discuss & Feedback
- 37.7K Read-Only Boards