We’d like to remind Forumites to please avoid political debate on the Forum.
This is to keep it a safe and useful space for MoneySaving discussions. Threads that are – or become – political in nature may be removed in line with the Forum’s rules. Thank you for your understanding.
Suggestions for a speculative punt?
Comments
-
mooneysaver said:
It went horribly wrong for this once great nation after been sucked in the Great War (WW1). It’s been downhill ever since, more so when the Labour party, or what ever they call themselves get in to power.
Anyway, this is not the place for global history lessons, so here is my suggested punt – Petrofac. An international service provider to the oil and gas production industry.
10 years ago worth around £1,500 a share, currently £1.43. Why the big drop? Something to do with the Tories, some bribes, and backhanders. That awful newspaper The Grauniad got a sniff and like a rancid dog with a bone wouldn’t let go. Hopefully the past is the past so onwards and upwards.
https://www.sfo.gov.uk/cases/petrofac/
https://www.theguardian.com/business/petrofac
0 -
I thing decimal point was 2 digits over, £15 per share not £1,500Thumbs_Up said:mooneysaver said:It went horribly wrong for this once great nation after been sucked in the Great War (WW1). It’s been downhill ever since, more so when the Labour party, or what ever they call themselves get in to power.
Anyway, this is not the place for global history lessons, so here is my suggested punt – Petrofac. An international service provider to the oil and gas production industry.
10 years ago worth around £1,500 a share, currently £1.43. Why the big drop? Something to do with the Tories, some bribes, and backhanders. That awful newspaper The Grauniad got a sniff and like a rancid dog with a bone wouldn’t let go. Hopefully the past is the past so onwards and upwards.
https://www.sfo.gov.uk/cases/petrofac/
https://www.theguardian.com/business/petrofac
“Like a bunch of cod fishermen after all the cod’s been overfished, they don’t catch a lot of cod, but they keep on fishing in the same waters. That’s what’s happened to all these value investors. Maybe they should move to where the fish are.” Charlie Munger, vice chairman, Berkshire Hathaway0 -
When the god casts his spell. Yesterday the stock market rallies up 4%+in the last two hours of the stock market closing.The FED is not considering hike of 75points (0.75%) this year. Also there is sign that the rate of core inflation is slowing down.
 0
0 -
Tea leaves update. In the daily timeframe all the indicators still oversold. Reversal candles with spikey tails normally clues to moves higher. There's several now around the 4150 region. Can hardly imagine much happening until the inflation figures come out this week. ?
Well the market had a go yesterday to test the lows from February ? Daily chart indicators now oversold. Tea leaves are clues and only that.coastline said:
As posted earlier " Now at 4600 and near overbought again " .Got to 4650 now down 5% at 4400 and heading for the oversold range.coastline said:
Even with lump sums in an ISA or Sipp etc there's plenty of opportunities to buy and sell an index fund. SP 500 this year using the simple Stochastic method. Sell early January 4700. Buy at 4300 around Jan 24th. There's a huge spikey candle for a clue to a bottom , I've posted this before . Rally to 4500 Sell around Feb 14th. Buy at 4200 around Feb 24th. Now at 4600 and near overbought again. Let's see next week. ?adindas said:
If you do not want volatility the best thing is to invest in index fundcsgohan4 said:Too late for Ant group, that volatility is not something I would want in my portfolio. Did flirt with the idea of Baba being so cheap when they were at 160. Glad I didn't
For instance for US stocks and ADR, it is S&P500. S&P 500 is the benchmark for the calculation of Beta Coefficient of individual stocks.
For individual stock look for the stock which has Beta Coefficient as close as 1.0.
For some people, like Peter Lynch, acute traders volatility is their friends.
$SPX | SharpChart | StockCharts.com
The likes of Greed and Fear index don't have any rules for a system just highlight sentiment. Look at the VIX chart and the Stochastic again. Exactly the opposite to what I've just posted on calling positions in the SP 500.
$VIX | SharpChart | StockCharts.com
At the end of the day what's changed. ? Still got a slowing economy . Still got inflation .Still got higher interest rates to come. Still got a crisis . Yet the market moves higher and has recovered , so far , half of the falls since December. So what's it really all about ? The long term trend is up especially over decades. The short is just a series of waves either daily, weekly or monthly. The media try to pin some news story to the moves but we've got a bit of froth off basically because it was frothy. So we see how it goes next week. Keep drip feeding monthly I say and look to the future. I Know nothing.
$SPX | SharpChart | StockCharts.com
The VIX heading up but if you look at the peaks earlier this year they are getting weaker 38 , 37, 33.Take a heavy sell off for that to change. Can only wait and see. ?
$VIX | SharpChart | StockCharts.com
The weekly was near oversold February at 4100 and maybe test it again. In general weekly oversold are normally longer term buying opportunities.
$SPX | SharpChart | StockCharts.com
I highlighted on another thread last summer that all indicators overbought in all timeframes is a rare event. Got ridiculed as ever. Market has gone sideways and down ever since. Here's the monthly chart and indicators are still rolling over. Mind if the monthly gets to oversold we've crashed that's for sure. Luckily as you can see they don't all play out. Last time that happened GFC in 2008. Good luck.
spx m apr8.png (640×614) (googleusercontent.com)
Here's the Dow leading the way as ever. Three lower peaks this year . All eyes on 32500 region. Might never get there ?
United States Stock Market Index (US30) - 2022 Data - 1896-2021 Historical (tradingeconomics.com)
Bonds yields still going up. Targets are still 3-3.5%.
United States Government Bond 10Y - 2022 Data - 1912-2021 Historical - 2023 Forecast (tradingeconomics.com)
$SPX | SharpChart | StockCharts.com
Weekly as I suggested normally a good long term buying opportunity when indicators are low.
$SPX | SharpChart | StockCharts.com
Monthly Dow indicators are still rolling lower and as I said if they get to the bottom then we've crashed. Simple as that.
usa m apr29.png (640×614) (googleusercontent.com)
Next week US data on inflation and FED rates so all eyes will be on that. Fair bit priced in as the 10 year shows just under 3% yield.
FRNrBcbWYAEjrun (900×522) (twimg.com)
FRX0GoFWUAIHoL1 (900×537) (twimg.com)
Nice little 40 year chart of SP 500 valuations . Earnings 2022 are forecast higher around P/E of 19. Note the valuations around year 1981 P/E of 10.
FQ45fNEXIAQZfJY (900×545) (twimg.com)
Interest rates peak around 1981.
FQ4t6fDWQAIrbsg (900×532) (twimg.com)
$SPX | SharpChart | StockCharts.com
Weekly again oversold. SP 500 now back to April 2021 levels which is pretty normal giving back gains for a full year. If you've been invested 3 , 5 , or more years then you're still in the money.
$SPX | SharpChart | StockCharts.com
In the monthly timeframe the SP 500 and the DOW are again drifting lower. As I said earlier if these play out we'll have crashed ? Well technically 20% or more. ? Note the Nasdaq and the RK2 smaller are drifting even further towards oversold on the indicators. RSI and Stochastic.
Trading Sunset: Weekend update - US equity indexes
So how will this all end ? Will the sectors all converge just like 2008 GFC.?
mBTDH80e (870×1087) (twimg.com)
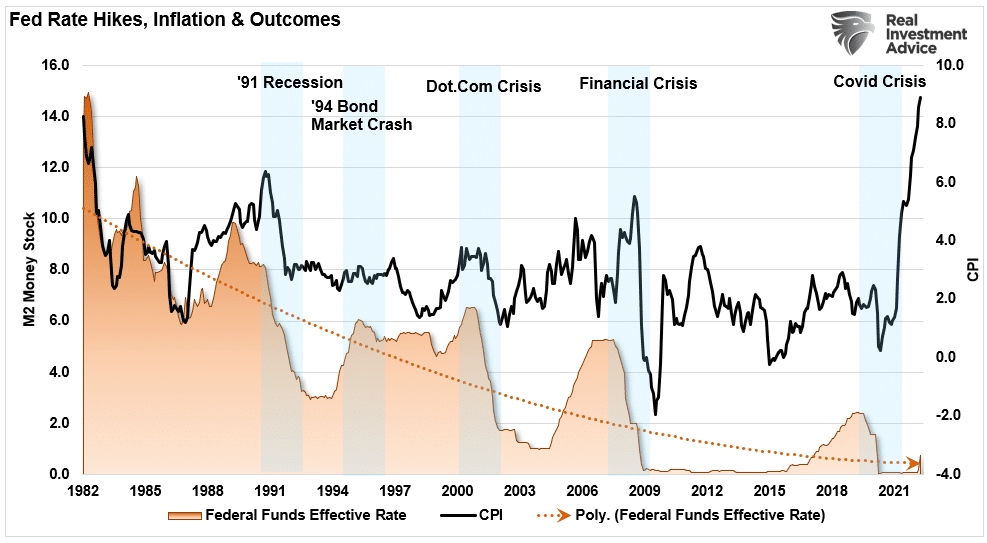
Next week the CPI figures in the US. Can you really see Fed funds following CPI. ? It's a long way up.
Fed-Funds-CPI-Inflation-Crisis.png (987×543) (realinvestmentadvice.com)
1 -
NASDAQ composite is officially already in the bear market territory since a while ago. S&P currently drop 17% from 52-weeks high is close to bear market territory.https://www.cnbc.com/2022/05/09/stock-market-futures-open-to-close-news.html"On Monday, the S&P 500 dropped below the 4,000 level to a low of 3,975.48, marking the index’s weakest point since March 2021. The broad market index dropped 17% from its 52-week high as Wall Street struggled to recover from last week’s losses.The Dow dropped 1.99%, down more than 12% from 52-week highs.....the tech-heavy Nasdaq Composite lost 4.29%, off more than 27% from 52-week highs"1
-
Ok, i know you can't time the market, but i want to use my £20k ISA here-
0 -
Thumbs_Up said:Ok, i know you can't time the market, but i want to use my £20k ISA here-You can't time the market, In PERFECTION. Noone everBut most Hedgies are timing the market, acute Traders are timing the market, Warren Buffer is timing the market. They do not get it right all the time but they just need to get 50%+ right to outperform the other alternative, e.g not timing the market.Another alternative is to do DCA (drip feed) on the red days deploying cash over a period of few months during this bear market period rather than just throwing lumpsum in one go. But for globally diversified portfolio the difference between DCA & lump sum might not be significant even during the bear market. But it will make a significant difference if it is individual stock, fund containing significant number of high growth stocks.The market downtrend has started since November 2021 last year.

0 -
Bottom in sight/reached perhaps?
0 -
BrockStoker said:Bottom in sight/reached perhaps?On Wednesday May 11, 2022 before the stock market is open, the US CPI figure will be released. It was predicted that last month the inflation figured has peaked @8.5%.
 So hopefully tomorrow when Inflation figure it will be showing a trending down making the FED to be less hawkish.0


Confirm your email address to Create Threads and Reply

Categories
- All Categories
- 355.1K Banking & Borrowing
- 254.7K Reduce Debt & Boost Income
- 455.8K Spending & Discounts
- 247.9K Work, Benefits & Business
- 605K Mortgages, Homes & Bills
- 178.8K Life & Family
- 262.7K Travel & Transport
- 1.5M Hobbies & Leisure
- 16.1K Discuss & Feedback
- 37.7K Read-Only Boards