We’d like to remind Forumites to please avoid political debate on the Forum.
This is to keep it a safe and useful space for MoneySaving discussions. Threads that are – or become – political in nature may be removed in line with the Forum’s rules. Thank you for your understanding.
Suggestions for a speculative punt?
Comments
-
Among bad news, e.g New variant of Omicron was found in the UK, higher inflation, war in Ukraine, the recent news that the FED is more hawkish to combat inflation, the good news is that Yield inversion 10Yr Minus 2Yr Maturity has been reversed, it is now above zero.
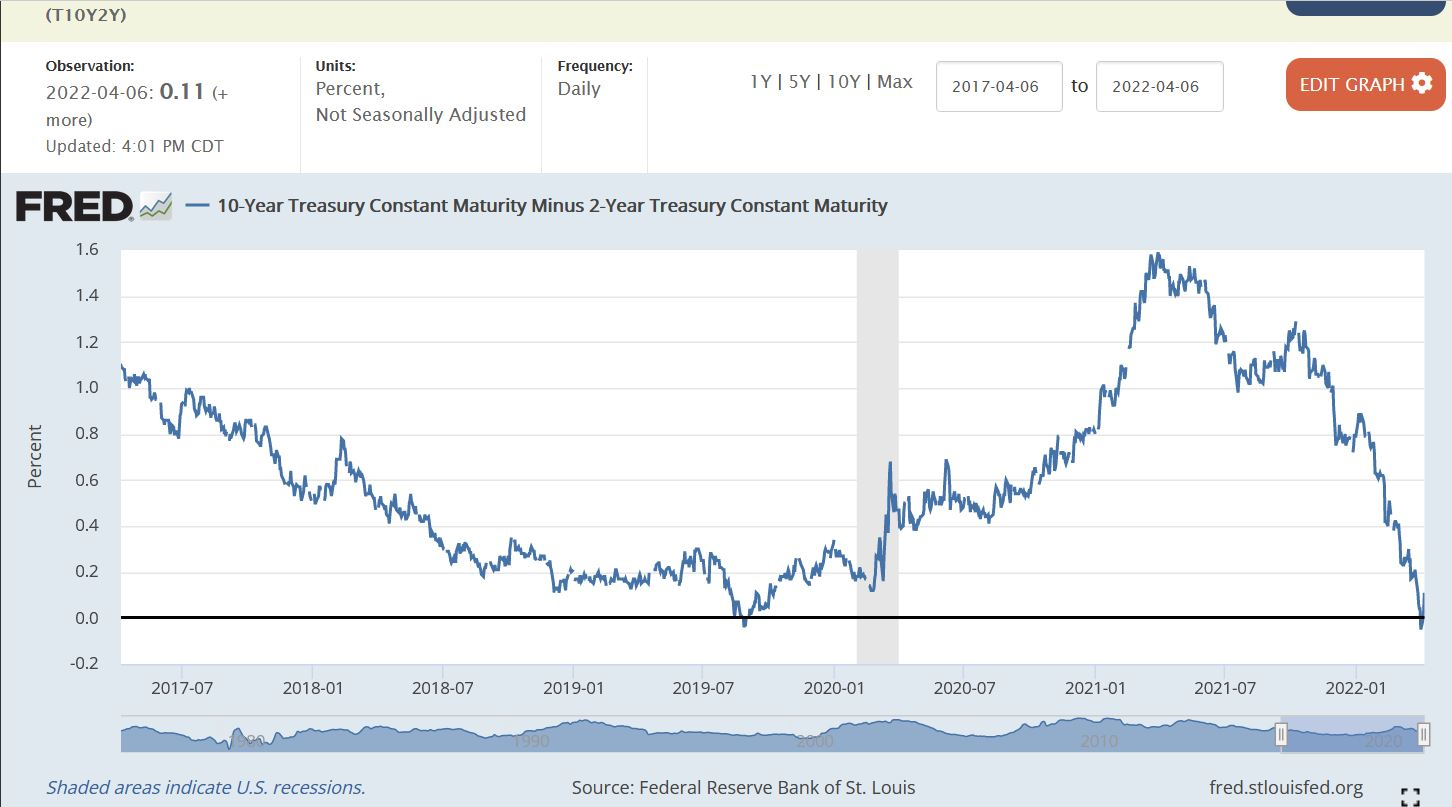
https://fred.stlouisfed.org/series/T10Y2Y
In the past this yield inversion is used to predict recession in the US. It is almost certain when the recession happen in the US it will spread around the world due to the size of US economy and global interconnection.
As the recession is defined a two consecutive quarters of negative economic growth measured by a country’s gross domestic product (GDP). Even if the recession has started today, the earliest we could now for sure that the US economy in recession is after 6 months from now. But in the past the recession normally came around 12-18 month after the yield inversion, not immediate.
In fact the Yield inversion just happened it might signal that recession might come much later than usual.
0 -
Peter lynch Valuable Lesson: Taking advantage of Market Crash, Bear Market, Correction, VolatilityThe Key point here:
- Know what you own and why you own it, so you now what to do when the stock price keep dropping
- Volatility is to embrace and take advantage of it
- More focus on undervalued companies that have been beaten down with very low or no debt.
2 -
This is what caused the stock market to tank yesterday .Inflation Number Likely to Be Ugly for March : A surge in energy costs from the war in Ukraine will have pushed the monthly reading higher April 11, 2022, at 9:33 a.m.https://www.usnews.com/news/economy/articles/2022-04-11/inflation-number-likely-to-be-ugly-for-march"Estimates are that inflation rose at an annual rate of 8.4% last month, surpassing February’s 7.9% reading and the fastest pace since the early 1980s. The monthly rise is expected to be 1.2%. That would be a record for the recent era of low inflation."
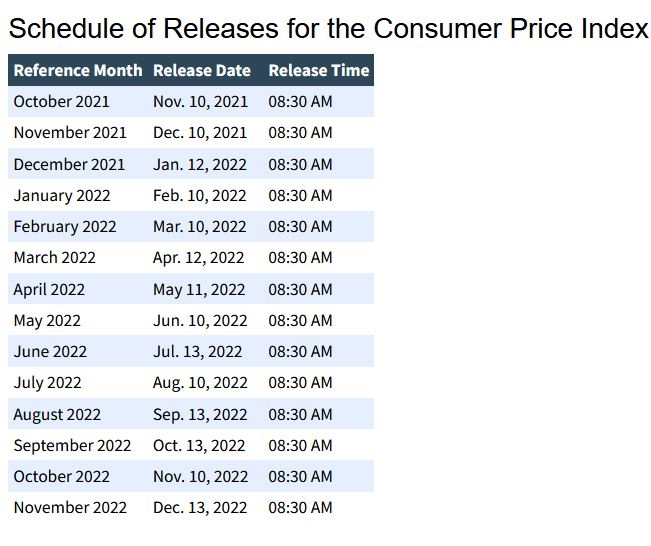 The CPI figure will be published before the US stock market open today. Inflation of 8.4% is already priced in yesterday stock marker tank. If the CPI figure lower than 8.4% than the market is likely to rally on the stock market opening today.Also this persistence COVID-19 issue that keep re-emerging.WHO says it’s closely watching China as the country grapples with its worst Covid surge Published Mon, Apr 11 2022
0 -
As posted earlier " Now at 4600 and near overbought again " .Got to 4650 now down 5% at 4400 and heading for the oversold range.coastline said:
Even with lump sums in an ISA or Sipp etc there's plenty of opportunities to buy and sell an index fund. SP 500 this year using the simple Stochastic method. Sell early January 4700. Buy at 4300 around Jan 24th. There's a huge spikey candle for a clue to a bottom , I've posted this before . Rally to 4500 Sell around Feb 14th. Buy at 4200 around Feb 24th. Now at 4600 and near overbought again. Let's see next week. ?adindas said:
If you do not want volatility the best thing is to invest in index fundcsgohan4 said:Too late for Ant group, that volatility is not something I would want in my portfolio. Did flirt with the idea of Baba being so cheap when they were at 160. Glad I didn't
For instance for US stocks and ADR, it is S&P500. S&P 500 is the benchmark for the calculation of Beta Coefficient of individual stocks.
For individual stock look for the stock which has Beta Coefficient as close as 1.0.
For some people, like Peter Lynch, acute traders volatility is their friends.
$SPX | SharpChart | StockCharts.com
The likes of Greed and Fear index don't have any rules for a system just highlight sentiment. Look at the VIX chart and the Stochastic again. Exactly the opposite to what I've just posted on calling positions in the SP 500.
$VIX | SharpChart | StockCharts.com
At the end of the day what's changed. ? Still got a slowing economy . Still got inflation .Still got higher interest rates to come. Still got a crisis . Yet the market moves higher and has recovered , so far , half of the falls since December. So what's it really all about ? The long term trend is up especially over decades. The short is just a series of waves either daily, weekly or monthly. The media try to pin some news story to the moves but we've got a bit of froth off basically because it was frothy. So we see how it goes next week. Keep drip feeding monthly I say and look to the future. I Know nothing.
$SPX | SharpChart | StockCharts.com
The VIX heading up but if you look at the peaks earlier this year they are getting weaker 38 , 37, 33.Take a heavy sell off for that to change. Can only wait and see. ?
$VIX | SharpChart | StockCharts.com
The weekly was near oversold February at 4100 and maybe test it again. In general weekly oversold are normally longer term buying opportunities.
$SPX | SharpChart | StockCharts.com
I highlighted on another thread last summer that all indicators overbought in all timeframes is a rare event. Got ridiculed as ever. Market has gone sideways and down ever since. Here's the monthly chart and indicators are still rolling over. Mind if the monthly gets to oversold we've crashed that's for sure. Luckily as you can see they don't all play out. Last time that happened GFC in 2008. Good luck.
spx m apr8.png (640×614) (googleusercontent.com)
Here's the Dow leading the way as ever. Three lower peaks this year . All eyes on 32500 region. Might never get there ?
United States Stock Market Index (US30) - 2022 Data - 1896-2021 Historical (tradingeconomics.com)
Bonds yields still going up. Targets are still 3-3.5%.
United States Government Bond 10Y - 2022 Data - 1912-2021 Historical - 2023 Forecast (tradingeconomics.com)
2 -
The CPI figure has been published before the UK stock market open. It is 8.5%Consumer prices rose 8.5% in March, slightly hotter than expected and the highest since 1981
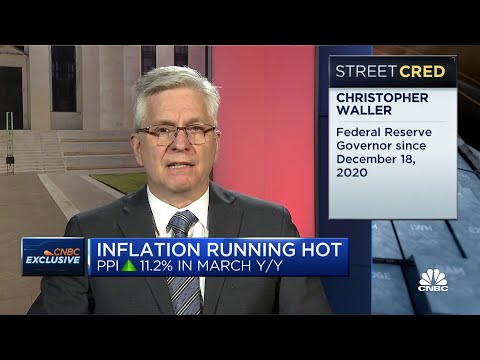
 We might be at the peak of inflation (in the US) , says Fed Governor Christopher WallerHis rational, the CPI is 8.5% but the core inflation is just 6.5%.But the global issue still exist such as global supply chain problem, Chips shortages, war in Ukraine that effect the energy price.0
 -
Watch the short debate. This is based on Tom Lee previous statement, one of the respected Analysts /Strategists frequently appeared on CNBC
Is it time to be more positive on the markets?
0 -
This is what has caused the stock market to tank today. I originally thought COVID-19 is think of the past after the vaccine was invented, but it seems they always come back to spook the marketLet alone high inflation, leading to higher interest rate. Almost Every time the god Jerome Powell give the press conference will send t he stock market further down.0
-
Why the stock market continue to tank today ?Covid-19 Cases Jump in Beijing as New Deaths Triple in Shanghai
0 -
The Recession in the US might have been startedhttps://www.cnbc.com/2022/04/28/us-q1-gdp-growth.html
U.S. GDP fell at a 1.4% pace to start the year as pandemic recovery takes a hit. Published Thu, Apr 28 2022As recession is defined as two consecutive quarters of economic decline, as reflected by GDP, the earliest that could be confirmed is end of the second quarter.
0 -
Well the market had a go yesterday to test the lows from February ? Daily chart indicators now oversold. Tea leaves are clues and only that.coastline said:
As posted earlier " Now at 4600 and near overbought again " .Got to 4650 now down 5% at 4400 and heading for the oversold range.coastline said:
Even with lump sums in an ISA or Sipp etc there's plenty of opportunities to buy and sell an index fund. SP 500 this year using the simple Stochastic method. Sell early January 4700. Buy at 4300 around Jan 24th. There's a huge spikey candle for a clue to a bottom , I've posted this before . Rally to 4500 Sell around Feb 14th. Buy at 4200 around Feb 24th. Now at 4600 and near overbought again. Let's see next week. ?adindas said:
If you do not want volatility the best thing is to invest in index fundcsgohan4 said:Too late for Ant group, that volatility is not something I would want in my portfolio. Did flirt with the idea of Baba being so cheap when they were at 160. Glad I didn't
For instance for US stocks and ADR, it is S&P500. S&P 500 is the benchmark for the calculation of Beta Coefficient of individual stocks.
For individual stock look for the stock which has Beta Coefficient as close as 1.0.
For some people, like Peter Lynch, acute traders volatility is their friends.
$SPX | SharpChart | StockCharts.com
The likes of Greed and Fear index don't have any rules for a system just highlight sentiment. Look at the VIX chart and the Stochastic again. Exactly the opposite to what I've just posted on calling positions in the SP 500.
$VIX | SharpChart | StockCharts.com
At the end of the day what's changed. ? Still got a slowing economy . Still got inflation .Still got higher interest rates to come. Still got a crisis . Yet the market moves higher and has recovered , so far , half of the falls since December. So what's it really all about ? The long term trend is up especially over decades. The short is just a series of waves either daily, weekly or monthly. The media try to pin some news story to the moves but we've got a bit of froth off basically because it was frothy. So we see how it goes next week. Keep drip feeding monthly I say and look to the future. I Know nothing.
$SPX | SharpChart | StockCharts.com
The VIX heading up but if you look at the peaks earlier this year they are getting weaker 38 , 37, 33.Take a heavy sell off for that to change. Can only wait and see. ?
$VIX | SharpChart | StockCharts.com
The weekly was near oversold February at 4100 and maybe test it again. In general weekly oversold are normally longer term buying opportunities.
$SPX | SharpChart | StockCharts.com
I highlighted on another thread last summer that all indicators overbought in all timeframes is a rare event. Got ridiculed as ever. Market has gone sideways and down ever since. Here's the monthly chart and indicators are still rolling over. Mind if the monthly gets to oversold we've crashed that's for sure. Luckily as you can see they don't all play out. Last time that happened GFC in 2008. Good luck.
spx m apr8.png (640×614) (googleusercontent.com)
Here's the Dow leading the way as ever. Three lower peaks this year . All eyes on 32500 region. Might never get there ?
United States Stock Market Index (US30) - 2022 Data - 1896-2021 Historical (tradingeconomics.com)
Bonds yields still going up. Targets are still 3-3.5%.
United States Government Bond 10Y - 2022 Data - 1912-2021 Historical - 2023 Forecast (tradingeconomics.com)
$SPX | SharpChart | StockCharts.com
Weekly as I suggested normally a good long term buying opportunity when indicators are low.
$SPX | SharpChart | StockCharts.com
Monthly Dow indicators are still rolling lower and as I said if they get to the bottom then we've crashed. Simple as that.
usa m apr29.png (640×614) (googleusercontent.com)
Next week US data on inflation and FED rates so all eyes will be on that. Fair bit priced in as the 10 year shows just under 3% yield.
FRNrBcbWYAEjrun (900×522) (twimg.com)
FRX0GoFWUAIHoL1 (900×537) (twimg.com)
Nice little 40 year chart of SP 500 valuations . Earnings 2022 are forecast higher around P/E of 19. Note the valuations around year 1981 P/E of 10.
FQ45fNEXIAQZfJY (900×545) (twimg.com)
Interest rates peak around 1981.
FQ4t6fDWQAIrbsg (900×532) (twimg.com)
1


 https://www.youtube.com/watch?v=zTIMUjOmeaE
 https://www.youtube.com/watch?v=rpHEuaPRInw
 https://www.youtube.com/watch?v=m3zuxBE3e5k
Confirm your email address to Create Threads and Reply

Categories
- All Categories
- 355.1K Banking & Borrowing
- 254.7K Reduce Debt & Boost Income
- 455.8K Spending & Discounts
- 247.9K Work, Benefits & Business
- 605K Mortgages, Homes & Bills
- 178.8K Life & Family
- 262.7K Travel & Transport
- 1.5M Hobbies & Leisure
- 16.1K Discuss & Feedback
- 37.7K Read-Only Boards