We’d like to remind Forumites to please avoid political debate on the Forum.
This is to keep it a safe and useful space for MoneySaving discussions. Threads that are – or become – political in nature may be removed in line with the Forum’s rules. Thank you for your understanding.
📨 Have you signed up to the Forum's new Email Digest yet? Get a selection of trending threads sent straight to your inbox daily, weekly or monthly!
Suggestions for a speculative punt?
Comments
-
coastline said:
Investors Chronicle or FTimes have a simple charting package which is clear to understand. TradingView is another. I don't use apps.
Set up Stochastic , Williams%R and RSI on here from the lower indicators. Study it for a while and relax .
FTSE 100 Index chart, prices and performance - Investors ChronicleInvestors Chronicle does seem informative and easy to understand, it's interesting to see what the analysts predict.Most of my shares seem to be predicted to have a rosy future, but I guess most shares go up, most of the time.The one share that is a possible sell, is Metro Bank, but I am waiting for a slight upturn first. Famous last words before the crash")
0 -
Full stockbroking services are available elsewhere within the banking group. Specialist investments are generally unsuitable for the majority of retail investors. Question to ask is whether you qualify as a Sophisticated Investor.masonic said:
iWeb is one of the worst places for availability of unusual/new ETFs. They seem to make a meal of compliance checks and often reject investments that other platforms are happy to make available.Shocking_Blue said:
Thanks.adindas said:Shocking_Blue said:Apologies - this link was given way back in this to thread. Would anyone know of a similar alternative (the one below doesn't seem to be available on iWeb).
https://www.ishares.com/ch/institutional/en/products/307130/ishares-electric-vehicles-and-driving-technology-ucits-etf-usd-acc-fund
ThanksTwo of the most commonly quoted:IDRV - iShares Self-driving EV & Tech ETFDRIV - Global X Autonomous & Electric Vehicles ETF FundAlso this oneFDRV - Fidelity Electric Vehicles and Future Transportation ETFCARZ - First Trust NASDAQ Global Auto Index Fund (This one Include Semi Conductor and Technologies)
I have no holdings on either of this ETF so have not idea of their performance.
IWeb don't seem to do any of these. Might choose one then see if they'll do it.
Thanks0 -
There is a good recent article from analysts aboutDip Buyers' Make Big Money On 10 Bouncing Stocks (For Now)
 Apart from Metaplatform (FB) and Paypal (PYPL) I do not own other stocks, I used to own Netflix (NFLX) and Moderna (MRNA) but I sold them last year. This might be a starting point to do one's own deep DD to investigate all of these stocks, you might get a bargain with risk/reward ratio is in your favour. They are all S&P500 companies, so general DDs have been done. Also because all of them are in S&P500 there are a lot of institutional holders working as a buffer protecting the downside and the short-sellers attack. Also they are highly unlikely bogus companies, go bankrupt in the foreseeable future.0
 -
coastline said:
Investors Chronicle or FTimes have a simple charting package which is clear to understand. TradingView is another. I don't use apps.I have just used Investors Chronicle to see what the 'forecasters' say about my 16 shareholdings.The lowest increase is forecast to be Spire Healthcare, +4%The highest increase is forecast to be Capita, +164%Royal Mail +73%Esken +68%Just hope these forecasters know what they are talking about
0 -
sevenhills said:coastline said:
Investors Chronicle or FTimes have a simple charting package which is clear to understand. TradingView is another. I don't use apps.I have just used Investors Chronicle to see what the 'forecasters' say about my 16 shareholdings.The lowest increase is forecast to be Spire Healthcare, +4%The highest increase is forecast to be Capita, +164%Royal Mail +73%Esken +68%Just hope these forecasters know what they are talking about IMO in the current GBX 366.60 price Royal Mail Group (RMG.L) is quite a safe play. Analyst iyr PT GBX 600.77.In January 2022, the price was around GBX450, nothing fundamentally change apart from the sentiment. So they could easily go back to that level when all of the FUD has been cleared.Forward dividend & yield 0.17 (4.50%). Also healthy financial stand. Little sign for a distress.P/E (TTM) 4.25 Price/Cash flow per share 2.43
Current ratio 1.30 Quick ratio 1.29 Total debt/total equity 0.4381Profitable business compared to their peers
0 -
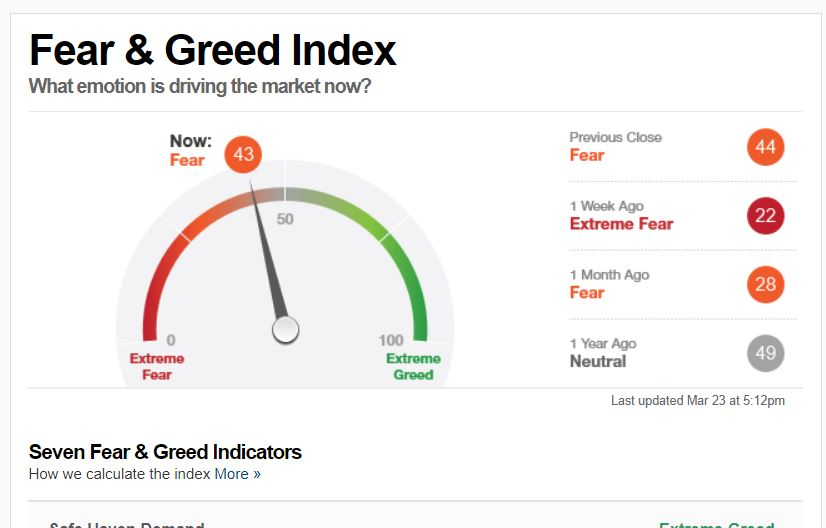
The indicators, Fear and Geed Index, The VIX correct again. It capture the momentum of bull run last week.

0 -
Recession is coming ? Yield inversion 10Yr Minus 2Yr MaturityWhen there is yield Inversion; 10Yr Maturity Minus 2Yr Maturity of treasury bond yield is going to negative (e.g 2Yr yield is already higher than 2Yr yield) = Recession in the US. It has been frequently quoted that this is almost 100% accurate in the past. They are already very close to zero
Also FED already warns about the possibility that US economy will go into recession.https://fred.stlouisfed.org/series/T10Y2Y
0 -
adindas said:Recession is coming ? Yield inversion 10Yr Minus 2Yr MaturityWhen there is yield Inversion; 10Yr Maturity Minus 2Yr Maturity of treasury bond yield is going to negative (e.g 2Yr yield is already higher than 2Yr yield) = Recession in the US. It has been frequently quoted that this is almost 100% accurate in the past. They are already very close to zero
Also FED already warns about the possibility that US economy will go into recession.https://fred.stlouisfed.org/series/T10Y2Y
Bond Yield Inversion; 10Yr Maturity Minus 2Yr Maturity of treasury bond yield is going to negative (e.g 2Yr yield is already higher than 2Yr yield) leading to recession is just the past event it will not necessary prevail this coming year.
Also in the past the recession normally came around 12-18 month after the yield inversion, not immediate.
Also as the recession is defined a recession is two consecutive quarters of negative economic growth measured by a country's gross domestic product (GDP). So even if the recession is started today, the earliest we now for sure that the US economy in recession is after 6 months from now.This is another article from Market watch regarding Bond Yield Inversion and recession. Yield curve a reliable economic indicator, but a poor market timing tools.
“In fact, the median return of the S&P 500 index from the date in each cycle when the yield curve inverts to the market peak is 19%.” (See table below.)https://www.marketwatch.com/story/what-an-inverted-yield-curve-says-about-the-stock-market-and-recessions-11648596049
0 -
Ron Baron One of the Billionaires early investor of Tesla (TSLA), his cost of ownership basis of $42.88 each.@ $42.88. Now the current price of TSLA is @$1,084.59 and expect to rise further with the recent stock split announcement.His Direct interview with CNBC (short version) is here0
-
FED March Meeting minutes was official released yesterday. This is I believe which cause the stock market to fall since two days ago. Instead of buying bond which they have been doing during COVID-19 pandemic they will now be selling it.Fed officials plan to shrink the balance sheet by $95 billion a month, meeting minutes indicate. Published Wed, Apr 6 2022Another one is a Signal Faster Pace of Rate Increases instead of standard 25 basis point (e.g 0.25%) they will probably do it with 50 basis point (e.g 0.5%)0


 https://www.youtube.com/watch?v=zhxDdInMT68
Confirm your email address to Create Threads and Reply

Categories
- All Categories
- 355.1K Banking & Borrowing
- 254.7K Reduce Debt & Boost Income
- 455.8K Spending & Discounts
- 247.9K Work, Benefits & Business
- 605K Mortgages, Homes & Bills
- 178.8K Life & Family
- 262.7K Travel & Transport
- 1.5M Hobbies & Leisure
- 16.1K Discuss & Feedback
- 37.7K Read-Only Boards