We’d like to remind Forumites to please avoid political debate on the Forum.
This is to keep it a safe and useful space for MoneySaving discussions. Threads that are – or become – political in nature may be removed in line with the Forum’s rules. Thank you for your understanding.
WASPI ‘victory’
Comments
-
I did ask upthread whether that "net contributors" graph was only considering taxes paid by individuals.MattMattMattUK said:The government/ONS do not publish the figure, but various estimates all seem to indicate fewer than 3% of people make a net positive lifetime contribution. How small the number of net contributors actually is is very hard to work out, but it could well be lower than 1%.
The total tax receipt includes taxes paid by corporate entities also.
The majority of tax spend is to benefit individuals, so far as I understand - corporate subsidy is quite low (even though individual support elements are large numbers).
This could explain why the majority of individuals are nett gainers, whether considered per year or per lifetime.Grumpy_chap said:Even as snapshots, is that chart surprising?
Does "benefits paid" include the value of services, such as medical care, waste collection etc?
Individuals pay some taxes - Income tax, employees NI, Council Tax, VED, VAT etc.
Companies pay some taxes - corporation tax, employers NI, business rates, some VAT etc.
Does the chart simply show that some of the value of benefits received by individuals is subsidised by the taxes paid by businesses?
2 -
It’s a per annum snapshot of all UK households.Pat38493 said:
Yes, but what I meant was that this cannot be a chart that shows lifetime contribution per person as they split the category into "retired" and "non retired" - you cannot be retired for your entire life, and the retired people are showing as 90% o them drawing more money than they pay in - this indicates that for example for 2020, this is the net contribution of people during 2020, and not over their whole life.BlackKnightMonty said:
No. This is ONS’s chart. All households, All taxes, All benefits, All services.Pat38493 said:
Is there a chart like this that shows the situation over people's entire lifetime rather than annual snapshots which this seems to be?BlackKnightMonty said:
You’ve nailed the UK fiscal paradox!ex-pat_scot said:My NI on salary around the £100k mark (after whopping pension contributions, to keep out of the high marginal tax rate) is around £6,400 pa.
At 35 years of this it would give c£225,000 total NI contributions. This is rather unrealistic, but serves to show how modest even a high earner's contributions are, when set against the broad equivalent annuity cost of the SP at around £250,000 and also the other notional social benefits such as NHS, welfare etc.
(My actual NI contributions to date are not much more than £100,000 for 33 full years of contribution and a few partial years - I wasn't a v high earner until later in my career).
This also neatly highlights that the state pension is considered as a benefit rather than a "right" as it's clearly being considered as a benefits in this chart. I know a few state pensioners who would be horrified if you suggested that they were on benefits")
Forget the terminology; this is pure money in and money out.
It doesn't change the point you are trying to make as this graph adequately backs it up - I would just also be interested to know what pecent of people are net contributors over their entire life, (including childhood which I suspect is excluded from the graph).
I doubt many are net contributors over their lifetime.0 -
 Grumpy_chap said:
I did ask upthread whether that "net contributors" graph was only considering taxes paid by individuals.MattMattMattUK said:The government/ONS do not publish the figure, but various estimates all seem to indicate fewer than 3% of people make a net positive lifetime contribution. How small the number of net contributors actually is is very hard to work out, but it could well be lower than 1%.
The total tax receipt includes taxes paid by corporate entities also.
The majority of tax spend is to benefit individuals, so far as I understand - corporate subsidy is quite low (even though individual support elements are large numbers).
This could explain why the majority of individuals are nett gainers, whether considered per year or per lifetime.Grumpy_chap said:Even as snapshots, is that chart surprising?
Does "benefits paid" include the value of services, such as medical care, waste collection etc?
Individuals pay some taxes - Income tax, employees NI, Council Tax, VED, VAT etc.
Companies pay some taxes - corporation tax, employers NI, business rates, some VAT etc.
Does the chart simply show that some of the value of benefits received by individuals is subsidised by the taxes paid by businesses?No this chart is only individual’s taxes / benefits:The five stages in the redistribution of income are:
original income: household members begin with income from employment, private pensions, investments and other non-government sources
gross income: households then receive income from cash benefits; the sum of cash benefits and original income is referred to as "gross income", where cash benefits refer to state-funded benefits such as Job Seekers Allowance, Universal Credit, Child Benefit, State Pension and Personal Independence Payment
disposable income: households then pay direct taxes; direct taxes, when subtracted from gross income, are referred to as "disposable income", where direct taxes include deductions such as Income Tax, National Insurance contributions, student loan repayments and council tax (less council tax benefits or rebates)
post-tax income: indirect taxes are then paid via expenditure; disposable income minus indirect taxes is referred to as "post-tax income", where indirect taxes refer to those on goods and services such as Value Added Tax (VAT), duty on tobacco, alcohol and fuel, and stamp duty
final income: households finally receive a benefit from services (benefits-in-kind); benefits-in-kind plus post-tax income is referred to as "final income", where benefits-in-kind relate to non-cash benefits such as the National Health Service, education, free childcare and travel subsidies
Note that at no stage are deductions currently made for housing costs.
https://www.ons.gov.uk/peoplepopulationandcommunity/personalandhouseholdfinances/incomeandwealth/bulletins/theeffectsoftaxesandbenefitsonhouseholdincome/financialyearending2021
https://www.ons.gov.uk/file?uri=/peoplepopulationandcommunity/personalandhouseholdfinances/incomeandwealth/datasets/effectsoftaxesandbenefitsonhouseholdincomehistoricalpersonleveldatasets/averageincomestaxesandbenefitsofallindividualsretiredandnonretiredbydecilegroup/averageincomestaxesandbenefitsofallindividualsretiredandnonretiredbydecilegroup.xlsx
0 -
Around 16% of tax revenue is paid directly by business, another 3-9% is er's NI, VAT that is not reclaimable, duties and taxes paid etc.Grumpy_chap said:
I did ask upthread whether that "net contributors" graph was only considering taxes paid by individuals.MattMattMattUK said:The government/ONS do not publish the figure, but various estimates all seem to indicate fewer than 3% of people make a net positive lifetime contribution. How small the number of net contributors actually is is very hard to work out, but it could well be lower than 1%.
The total tax receipt includes taxes paid by corporate entities also.
The majority of tax spend is to benefit individuals, so far as I understand - corporate subsidy is quite low (even though individual support elements are large numbers).
This could explain why the majority of individuals are nett gainers, whether considered per year or per lifetime.
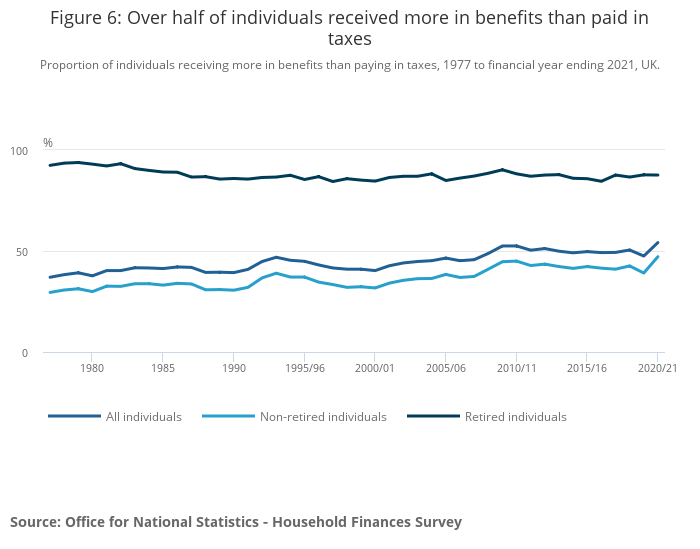
55%* of households receive more in cash benefits than they pay in all taxes, the average household size is 2.4 people, but there is no specific breakdown by individual, demographics, employment status etc. This is the highest rate in the EU.
*possibly now 56-59%.
The bottom and middle third of earners in the UK have the lowest effective rate of income taxation in the EU, largely caused by our huge tax free allowance. The top third have the fifth highest effective rate of income taxation in the EU.
5 -
BlackKnightMonty said:It’s a per annum snapshot of all UK households.
I doubt many are net contributors over their lifetime.BlackKnightMonty said:No this chart is only individual’s taxes / benefits:
This all means there is no fiscal paradox as was stated upthread.MattMattMattUK said:Around 16% of tax revenue is paid directly by business, another 3-9% is er's NI, VAT that is not reclaimable, duties and taxes paid etc.
55%* of households receive more in cash benefits than they pay in all taxes, the average household size is 2.4 people, but there is no specific breakdown by individual, demographics, employment status etc. This is the highest rate in the EU.
*possibly now 56-59%.
The bottom and middle third of earners in the UK have the lowest effective rate of income taxation in the EU, largely caused by our huge tax free allowance. The top third have the fifth highest effective rate of income taxation in the EU.
Government exists to benefit the people.
The majority of households receive more from the "system" than they pay into the "system".
The gap is supplemented from corporate taxation (plus borrowing, though borrowing over the fullness of time has to be zero).0 -
0
-
Quite simply it is unsustainable.Grumpy_chap said:BlackKnightMonty said:It’s a per annum snapshot of all UK households.
I doubt many are net contributors over their lifetime.BlackKnightMonty said:No this chart is only individual’s taxes / benefits:
This all means there is no fiscal paradox as was stated upthread.MattMattMattUK said:Around 16% of tax revenue is paid directly by business, another 3-9% is er's NI, VAT that is not reclaimable, duties and taxes paid etc.
55%* of households receive more in cash benefits than they pay in all taxes, the average household size is 2.4 people, but there is no specific breakdown by individual, demographics, employment status etc. This is the highest rate in the EU.
*possibly now 56-59%.
The bottom and middle third of earners in the UK have the lowest effective rate of income taxation in the EU, largely caused by our huge tax free allowance. The top third have the fifth highest effective rate of income taxation in the EU.
Government exists to benefit the people.
The majority of households receive more from the "system" than they pay into the "system".
The gap is supplemented from corporate taxation (plus borrowing, though borrowing over the fullness of time has to be zero).
37% of householders net benefiters in 1977, now it is up to 53.8% and the trend is increasing.
https://news.sky.com/story/amp/government-debt-will-rise-to-140-of-gdp-think-tank-forecasts-12987161
Too many people take too much out of ‘the system’. This needs to change.
0 -
Jonty6262 said:

Looking at those 'reasons for signing', perhaps now would be a good time to step up the focus on educating women in pension rights.
Googling on your question might have been both quicker and easier, if you're only after simple facts rather than opinions!1 -
This is a cracker lolJonty6262 said:
"This is an historical Injustice for 1950s born women ,who are on their knees with exhaustion and in debt and impoverished because they had No Letter ,NO NOTICE, No due Pension !!!"
0


Confirm your email address to Create Threads and Reply

Categories
- All Categories
- 354.1K Banking & Borrowing
- 254.3K Reduce Debt & Boost Income
- 455.3K Spending & Discounts
- 247.1K Work, Benefits & Business
- 603.7K Mortgages, Homes & Bills
- 178.3K Life & Family
- 261.2K Travel & Transport
- 1.5M Hobbies & Leisure
- 16.1K Discuss & Feedback
- 37.7K Read-Only Boards