We’d like to remind Forumites to please avoid political debate on the Forum.
This is to keep it a safe and useful space for MoneySaving discussions. Threads that are – or become – political in nature may be removed in line with the Forum’s rules. Thank you for your understanding.
📨 Have you signed up to the Forum's new Email Digest yet? Get a selection of trending threads sent straight to your inbox daily, weekly or monthly!
"Average Earnings Growth" and triple lock
Comments
-
Cobbler_tone said:There is so much noise that I would not be at all surprised if something is changed on income tax/NI, i.e. breaking the promise. Not like a political party to break promises.

1p on the basic rate, adjustments to the higher rates, balancing extra tax against lower NI. They are by far and away the simplest and most effective way of producing big numbers. None of which will be popular but I don't think any change that leaves most people worse off will be popular.HedgehogRulez said:Just bite the bullet and put 1% on basic rate and 2% on higher rate tax
Agreed as suggested before
0 -
It should be noted however that 22/23 data is 3.5 years old now.......even allowing for basic CPI alone, that £166 figure would be more iro £200.....and that's also AFTER housing costs btw.QrizB said:Silvertabby said:
That's what many people seem to have forgotten. The Beveridge Report made it quite clear that the new (1948) State pension was just a safety net against poverty in retirement, and that anyone who wanted more would have to make their own provisions.BlackKnightMonty said:The state pension was never designed to be a large and luxurious pension. It is a modest basic amount only. If you want a better retirement you need to make your own provisions in addition.Per the Trust for London, the UK poverty line for 2022/23 (60% of median income after housing costs) is:- Single person: £166/wk
- Couple: £287/wk
- Single parent, one child: £224/wk
- Couple, two children: £407/wk
As the poverty line is linked to income, rather than expenditure, there's some logic in "benefits intended to mitigate poverty" tracking earnings rather than CPI.
A couple of points......try living on £166pw today...
Secondly, that chart showsHousehold types Minimum Income Standard - Inner London (AHC), 2024 Minimum Income Standard - Outer London (AHC), 2024 UK poverty line - After Housing Costs, 2022/23 Destitution, 2022 Single, working-age £396 £373 £166 £95 Couple, working-age £690 £643 £287 £145 Single, pensioner £297 £292 £166 £95 Couple, pensioner £467 £457 £287 £145
So, they also say the "minimum income standard" for a single pensioner in outer London on 2024 was £292......way above the New State pension level in 2024 (which was £221.20).......0 -
Hearing and reading a lot of suggestions of raising IC and lowering NI, maybe 2p. I guess that is more neutral for the working majority and raises significant funds from those whose working life is behind them.HedgehogRulez said:Cobbler_tone said:There is so much noise that I would not be at all surprised if something is changed on income tax/NI, i.e. breaking the promise. Not like a political party to break promises.
1p on the basic rate, adjustments to the higher rates, balancing extra tax against lower NI. They are by far and away the simplest and most effective way of producing big numbers. None of which will be popular but I don't think any change that leaves most people worse off will be popular.HedgehogRulez said:Just bite the bullet and put 1% on basic rate and 2% on higher rate tax
Agreed as suggested before
You usually find that some strategic 'leaks' begin appearing ahead of budget day. Probably both to gauge opinion and soften any blows.
Yes more speculation but you can almost guarantee that they aren't going to do nothing. Whether that impacts on you personally remains to be seen.
Speculation is inevitable unless we want to live in a country with gagging orders and total press ban, like on election day.
Remember the days when the budget was only about the price of petrol, booze and fags?!0 -
'Minimum income standard' - hilarious. Wait until the 'minimum acceptable' is above the mean - the advocates still won't understand why that is a joke.MK62 said:
It should be noted however that 22/23 data is 3.5 years old now.......even allowing for basic CPI alone, that £166 figure would be more iro £200.....and that's also AFTER housing costs btw.QrizB said:Silvertabby said:
That's what many people seem to have forgotten. The Beveridge Report made it quite clear that the new (1948) State pension was just a safety net against poverty in retirement, and that anyone who wanted more would have to make their own provisions.BlackKnightMonty said:The state pension was never designed to be a large and luxurious pension. It is a modest basic amount only. If you want a better retirement you need to make your own provisions in addition.Per the Trust for London, the UK poverty line for 2022/23 (60% of median income after housing costs) is:- Single person: £166/wk
- Couple: £287/wk
- Single parent, one child: £224/wk
- Couple, two children: £407/wk
As the poverty line is linked to income, rather than expenditure, there's some logic in "benefits intended to mitigate poverty" tracking earnings rather than CPI.
A couple of points......try living on £166pw today...
Secondly, that chart showsHousehold types Minimum Income Standard - Inner London (AHC), 2024 Minimum Income Standard - Outer London (AHC), 2024 UK poverty line - After Housing Costs, 2022/23 Destitution, 2022 Single, working-age £396 £373 £166 £95 Couple, working-age £690 £643 £287 £145 Single, pensioner £297 £292 £166 £95 Couple, pensioner £467 £457 £287 £145
So, they also say the "minimum income standard" for a single pensioner in outer London on 2024 was £292......way above the New State pension level in 2024 (which was £221.20).......I think....1 -
There would be a great simplicity if everything was linked to earnings.QrizB said:there's some logic in "benefits intended to mitigate poverty" tracking earnings rather than CPI.
Average earnings = £x per week / month / year
Personal allowance = a% of £x
Higher rate starts at b% of £x
Additional rate starts at c% of £x
NMW = d% of £x
State pension = e% of £x
UC = f% of £x
And so on.2 -
Then everyone could argue about which version of average to use.Grumpy_chap said:
There would be a great simplicity if everything was linked to earnings.QrizB said:there's some logic in "benefits intended to mitigate poverty" tracking earnings rather than CPI.
Average earnings = £x per week / month / year
Personal allowance = a% of £x
Higher rate starts at b% of £x
Additional rate starts at c% of £x
NMW = d% of £x
State pension = e% of £x
UC = f% of £x
And so on.1 -
But once that was set, it would be politically difficult to change.MeteredOut said:
Then everyone could argue about which version of average to use.Grumpy_chap said:
There would be a great simplicity if everything was linked to earnings.QrizB said:there's some logic in "benefits intended to mitigate poverty" tracking earnings rather than CPI.
Average earnings = £x per week / month / year
Personal allowance = a% of £x
Higher rate starts at b% of £x
Additional rate starts at c% of £x
NMW = d% of £x
State pension = e% of £x
UC = f% of £x
And so on.
It would also make changes very transparent - either a change to the tax rate or a change to the a%, b%, etc.
And takes the default out of the hands of politicians as average earnings is not a parameter they control.
All reasons why a simple system will never happen.
Unless I somehow end up as Chancellor of the Exchequer.0 -
Thanks. Interesting. Although I’m suspicious of RPI as an inflation measure. Back in the mid 2010s I used to deal with the OBR around fiscal events. They would invariably be a bit sniffy about RPI and point out it was not a National Statistic.hugheskevi said: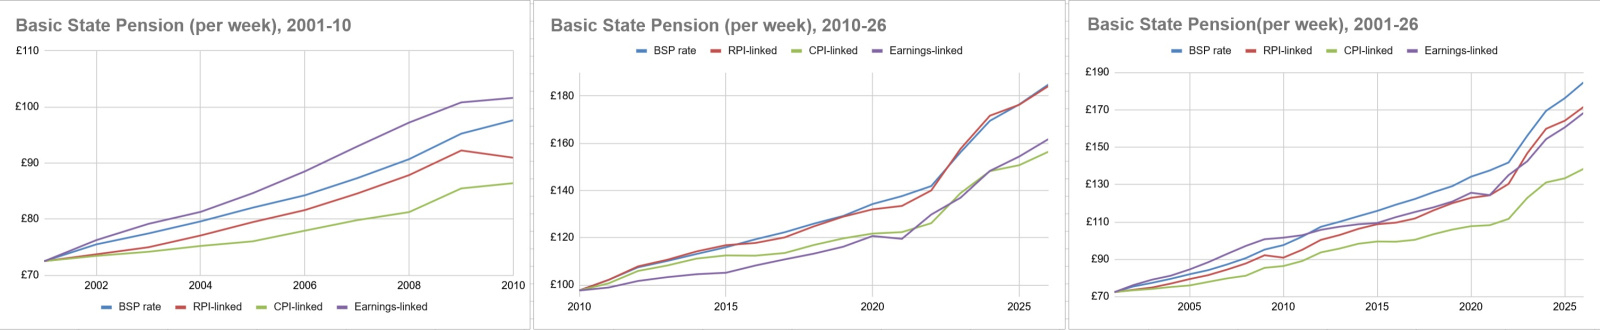 Here are charts comparing the rate of Basic State Pension since 2001 and 2010 to what it would have been under different upratings, through to 2026 (assuming uprating of 4.8% in April 2026, which is subject to confirmation).How earnings have fared relative to inflation depends on whether the comparator is RPI or CPI. Earnings growth has closely matched RPI over the last 25 years, with both earnings and RPI being noticeably higher than CPI.A few interesting points:
- Since 2001, the State Pension is more than 33% higher than it would have been if uprated in line with CPI
- If Triple Lock had not been implemented, and State Pension has simply continued to be uprated by RPI (as it was before 2011, albeit with a lot of discretionary increases on top of RPI), the State Pension would now be almost the same as it actually is (it would be 0.4% lower now under RPI than it is under Triple Lock)
- Over the last 25 years, State Pension increases have been higher than any of RPI, earnings or CPI growth.
- Since 2010, State Pension is 14% higher now than if it had simply increased in line with earnings
I am half tempted to develop my own measure of inflation to help keep with retirement planning. It would be overly weighted on holidays, wine, and crisps!0 -
You can do a bit of that on this ONS page here. https://www.ons.gov.uk/visualisations/dvc1833/calculator/index.htmlI am half tempted to develop my own measure of inflation to help keep with retirement planning. It would be overly weighted on holidays, wine, and crisps!
Put in your monthly household income and housing status and put in some broad expenditure. I got 3.8% with high expenditure on holidays.2 -
What, like RPI/CPIH?Grumpy_chap said:
But once that was set, it would be politically difficult to change.MeteredOut said:
Then everyone could argue about which version of average to use.Grumpy_chap said:
There would be a great simplicity if everything was linked to earnings.QrizB said:there's some logic in "benefits intended to mitigate poverty" tracking earnings rather than CPI.
Average earnings = £x per week / month / year
Personal allowance = a% of £x
Higher rate starts at b% of £x
Additional rate starts at c% of £x
NMW = d% of £x
State pension = e% of £x
UC = f% of £x
And so on.
It would also make changes very transparent - either a change to the tax rate or a change to the a%, b%, etc.
And takes the default out of the hands of politicians as average earnings is not a parameter they control.
All reasons why a simple system will never happen.
Unless I somehow end up as Chancellor of the Exchequer.") 0
0


Confirm your email address to Create Threads and Reply

Categories
- All Categories
- 354.9K Banking & Borrowing
- 254.6K Reduce Debt & Boost Income
- 455.7K Spending & Discounts
- 247.7K Work, Benefits & Business
- 604.7K Mortgages, Homes & Bills
- 178.7K Life & Family
- 262.3K Travel & Transport
- 1.5M Hobbies & Leisure
- 16.1K Discuss & Feedback
- 37.7K Read-Only Boards