We’d like to remind Forumites to please avoid political debate on the Forum.
This is to keep it a safe and useful space for MoneySaving discussions. Threads that are – or become – political in nature may be removed in line with the Forum’s rules. Thank you for your understanding.
📨 Have you signed up to the Forum's new Email Digest yet? Get a selection of trending threads sent straight to your inbox daily, weekly or monthly!
The Forum now has a brand new text editor, adding a bunch of handy features to use when creating posts. Read more in our how-to guide
What next? High electricity usage.
Comments
-
Was going to suggest exactly the same. Build up a spreadsheet of the usage of each device so the OP gets a full picture of their consumption. There still seems to be some discrepancy between the OP's relatively high daily usage (14.9kWh while at home and 7.6kWh on holiday) compared to their stated annual usage of 12k kWh, which would work out as 32.9kWh per day). Are these estimates? Do we know what their actual annual usage is?WiserMiser said:Buy one or more Tapo P110 plugs and check the daily energy consumption of various appliances
I just checked my sheet as well, a bit more similar to the OP - 2 of us in a 3 bed house.FreeBear said:
For comparison - 3 bed semi, just me and the cat. Average consumption 0.09-0.10kWh or ~1700kWh per year. Even when there was 2 of us, annual consumption was around 2000kWh.
Our annual usage was around 2040 kWh. I then got a fully electric vehicle which took our usage up to around 4240 kWh (so the EV added 2200 kWh). A year later we got a plug in hybrid for my wife which has taken our usage to 5280 kWh (so the PHEV added 1040 kWh).
Not including the cars, this puts our daily consumption at ~5.6kWh - which is lower than the OP's consumption while they're not in, or not far off a third of their typical usage. It's obviously mountains off the 32.9kWh daily usage their annual estimate might suggest.
In any case, the culprit(s) need to be identified, I would probably drop the idea that this is a fault with the meter considering what's been said.Know what you don't2 -
I would like to share 2 of my bills. One from the
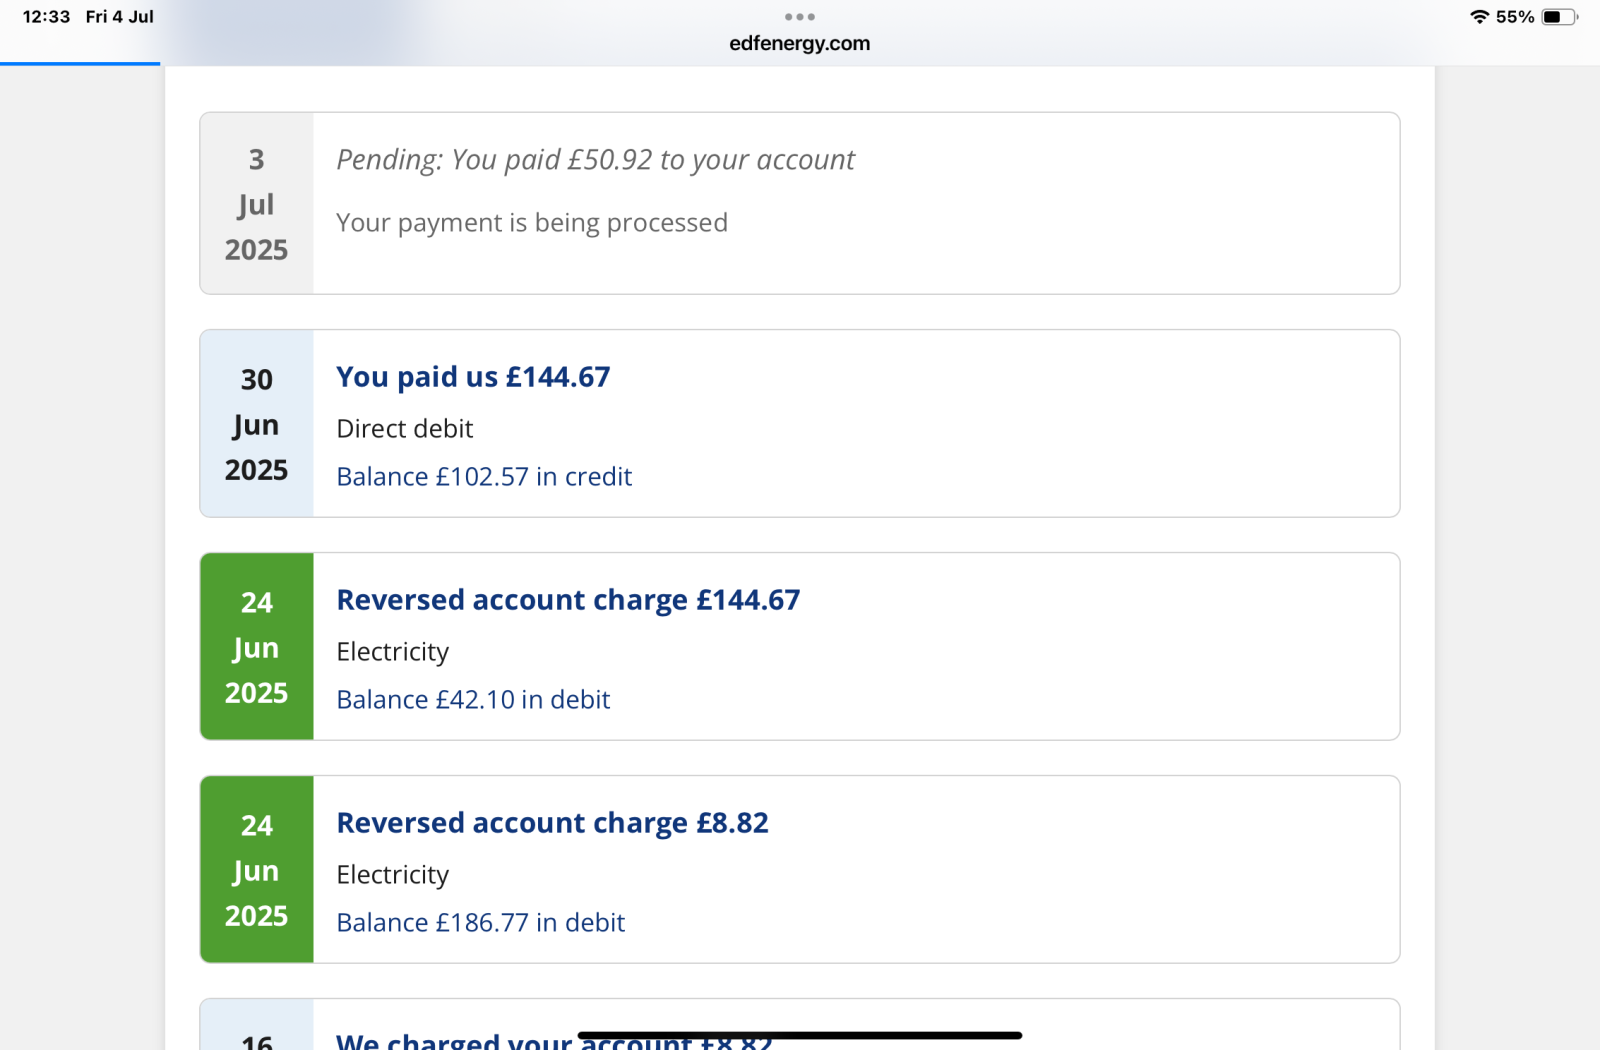 period of the test meter installation. And one a couple of months previous. Any clue how there can be a significant drop in estimated use for the year? The previous bill estimate had also dropped since our initial complaint was logged. This maybe due to being more aware of what we use. I will see if I can manually find an actual annual amount and post. There has been one estimated reading between these bills that has been rectified and credited to the account. But other odd things that I’m still not getting an explanation from EDF why. See photo. We pay as we go by DD.
The original meter was moved when installing the test meter. They also replace a fuse box that the supply enters into. It was an old one that had the seal broken. Not sure if that has always been like that. Could that have had an effect on the bills?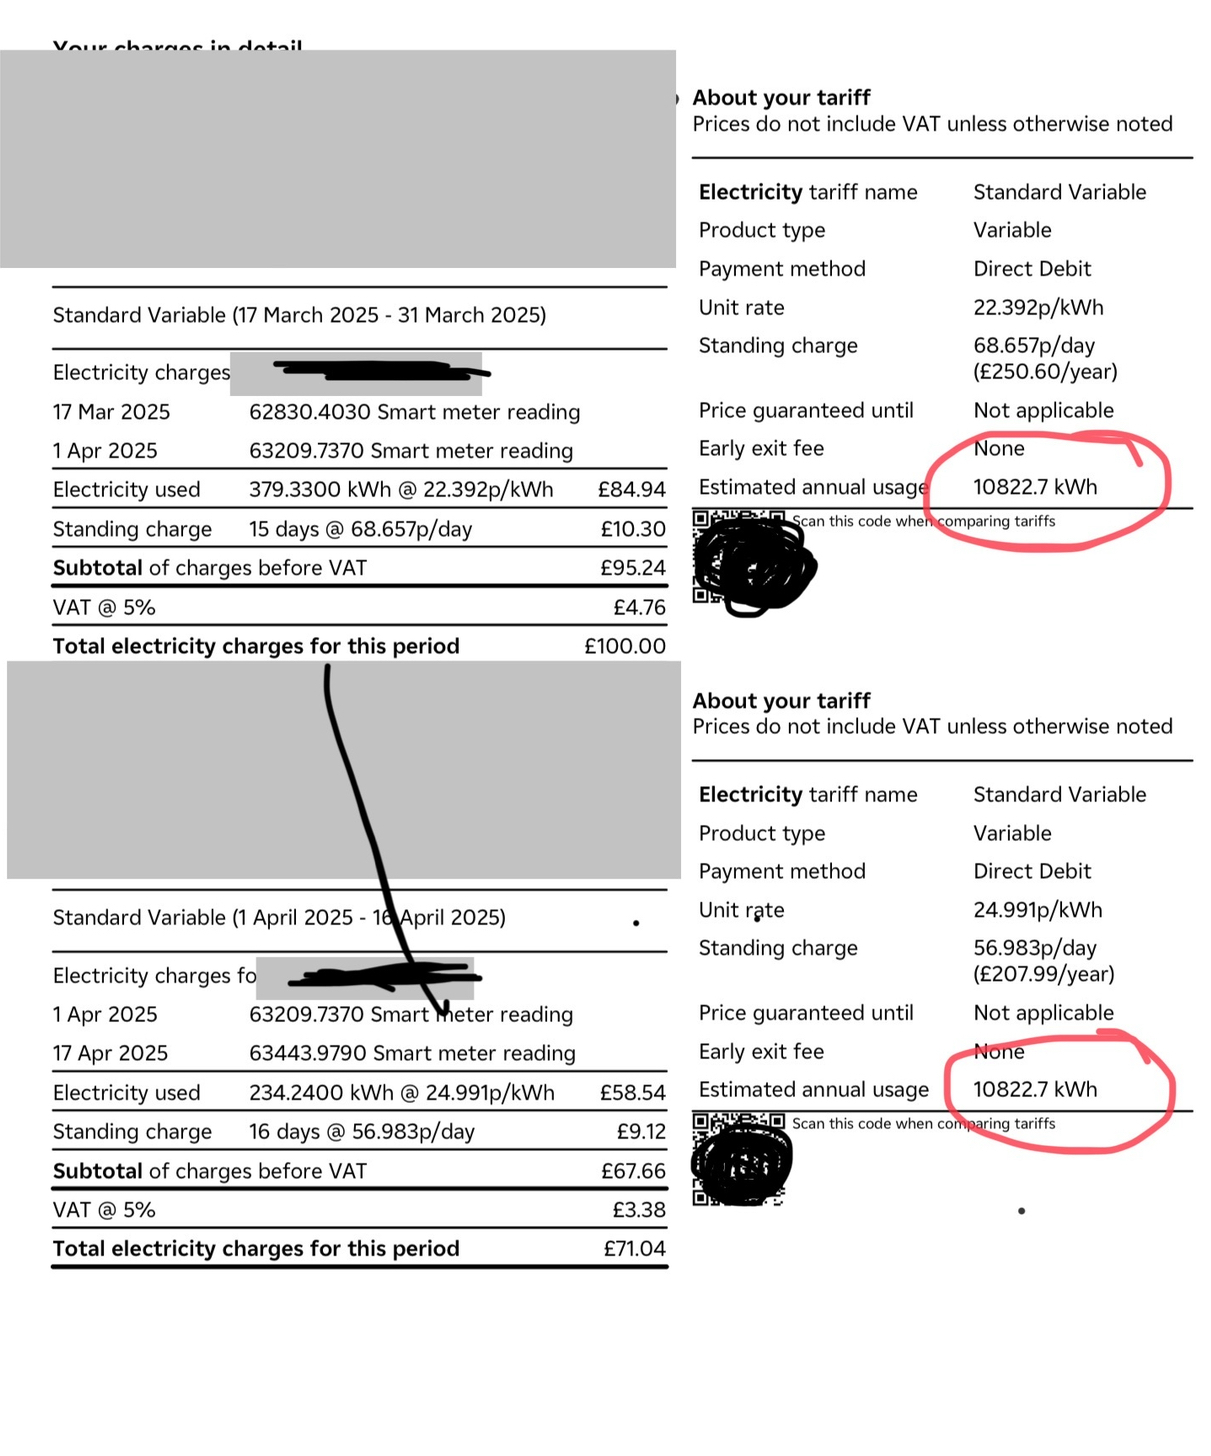
 0
0 -
Have a look at the EDF app / portal half hourly when it updates (guessing EDF will pull sometime overnight so tommorrow for today.There may well be a clear difference compared to the charts above when those devices on / off.From memory some of the other apps can be more responsive - iirc one site was polling every couple of hours - loop ? (but not sure thats free anymore) but then read was it bright has a manual request if daily not good enough - others who actively use them will tell you more.Their are personal choices - your fish I assume ponds for instance - but at least you'll know what they cost.But lots of little things on standby do add up though. My desktop PCs (PSU, MB / Ethernet active by default), and external drives / media server on NAS etc - on mains but standby 15-20W - my old TV 15W, my old DVD/HDD recorder, bluray and new TV and aerial amp - 15W combined. 35W isnt a lot - but its 0.8 kWh a day - so 20p.My sister used to have Halagon spots - mix of c20Ws and 50Ws iirc all over kitchen diner - ceilings, under wall units etc etc - they were pulling over 500W - and left on for hours in winter evenings - LEDs (needed a bit of work not just bulbs in her case - transformers not suitable etc) - pull around a 10th of that. Paid back still within a year. But the GCH raidators in their probably work harder in winter now too.You mention TV,my newish LED TV under 100W most of the time in use, much older but smaller 40" LCD TV 170-180W - that c80W difference over 10hrs - again 0.8kWh / 20p.
1 -
Wow . I feel we are so badly out and just don’t know how we can possibly use so much energy. EDF have done their test meter and say there is nothing wrong with the meter but please take a look at my previous post to see the significant change in estimated use.Exodi said:
Was going to suggest exactly the same. Build up a spreadsheet of the usage of each device so the OP gets a full picture of their consumption. There still seems to be some discrepancy between the OP's relatively high daily usage (14.9kWh while at home and 7.6kWh on holiday) compared to their stated annual usage of 12k kWh, which would work out as 32.9kWh per day). Are these estimates? Do we know what their actual annual usage is?WiserMiser said:Buy one or more Tapo P110 plugs and check the daily energy consumption of various appliances
I just checked my sheet as well, a bit more similar to the OP - 2 of us in a 3 bed house.FreeBear said:
For comparison - 3 bed semi, just me and the cat. Average consumption 0.09-0.10kWh or ~1700kWh per year. Even when there was 2 of us, annual consumption was around 2000kWh.
Our annual usage was around 2040 kWh. I then got a fully electric vehicle which took our usage up to around 4240 kWh (so the EV added 2200 kWh). A year later we got a plug in hybrid for my wife which has taken our usage to 5280 kWh (so the PHEV added 1040 kWh).
Not including the cars, this puts our daily consumption at ~5.6kWh - which is lower than the OP's consumption while they're not in, or not far off a third of their typical usage. It's obviously mountains off the 32.9kWh daily usage their annual estimate might suggest.
In any case, the culprit(s) need to be identified, I would probably drop the idea that this is a fault with the meter considering what's been said.0 -
The estimated usage is just that, and nobody knows other than them how they work it out.Debdon said:Wow . I feel we are so badly out and just don’t know how we can possibly use so much energy. EDF have done their test meter and say there is nothing wrong with the meter but please take a look at my previous post to see the significant change in estimated use.
Looking at your bills from 1/4/25 your average daily is about 15kWh 5400/year. But between 16/3/25 to 31/3/25 you averaged 25.3kWh daily 9230/yr.
You need to look at all-of your appliances , and don’t rely on the efergy meter.I don’t suppose you remember what could have caused the spike in march?4.8kWp 12x400W Longhi 9.6 kWh battery Giv-hy 5.0 Inverter, WSW facing Essex . Aint no sunshine ☀️ Octopus gas fixed dec 24 @ 5.74 tracker again+ Octopus Intelligent Flux leccy
CEC Email energyclub@moneysavingexpert.com1 -
Debdon said:... please take a look at my previous post to see the significant change in estimated use.I think that's a red herring.2700kWh is the default average consumption value for a dual fuel household. There's nothing in your actual meter readings to suggest that your annual electricity use has plummeted to 1/4 of the previous estimate.N. Hampshire, he/him. Octopus Intelligent Go elec & Tracker gas / Vodafone BB / iD mobile. Kirk Hill Co-op member.Ofgem cap table, Ofgem cap explainer. Economy 7 cap explainer. Gas vs E7 vs peak elec heating costs, Best kettle!
2.72kWp PV facing SSW installed Jan 2012. 11 x 247w panels, 3.6kw inverter. 35 MWh generated, long-term average 2.6 Os.2 -
Edit my last post I guess the spike in march could be the underfloor heating4.8kWp 12x400W Longhi 9.6 kWh battery Giv-hy 5.0 Inverter, WSW facing Essex . Aint no sunshine ☀️ Octopus gas fixed dec 24 @ 5.74 tracker again+ Octopus Intelligent Flux leccy
CEC Email energyclub@moneysavingexpert.com1 -
Underfloor heating was all off February but not really used anyway. March we were using some diy tools eg. Grinding machine, sander, jigsaw, drill, etc during March the spikes show hybrid car being charged 3 times in this period. Which is normal.0
-
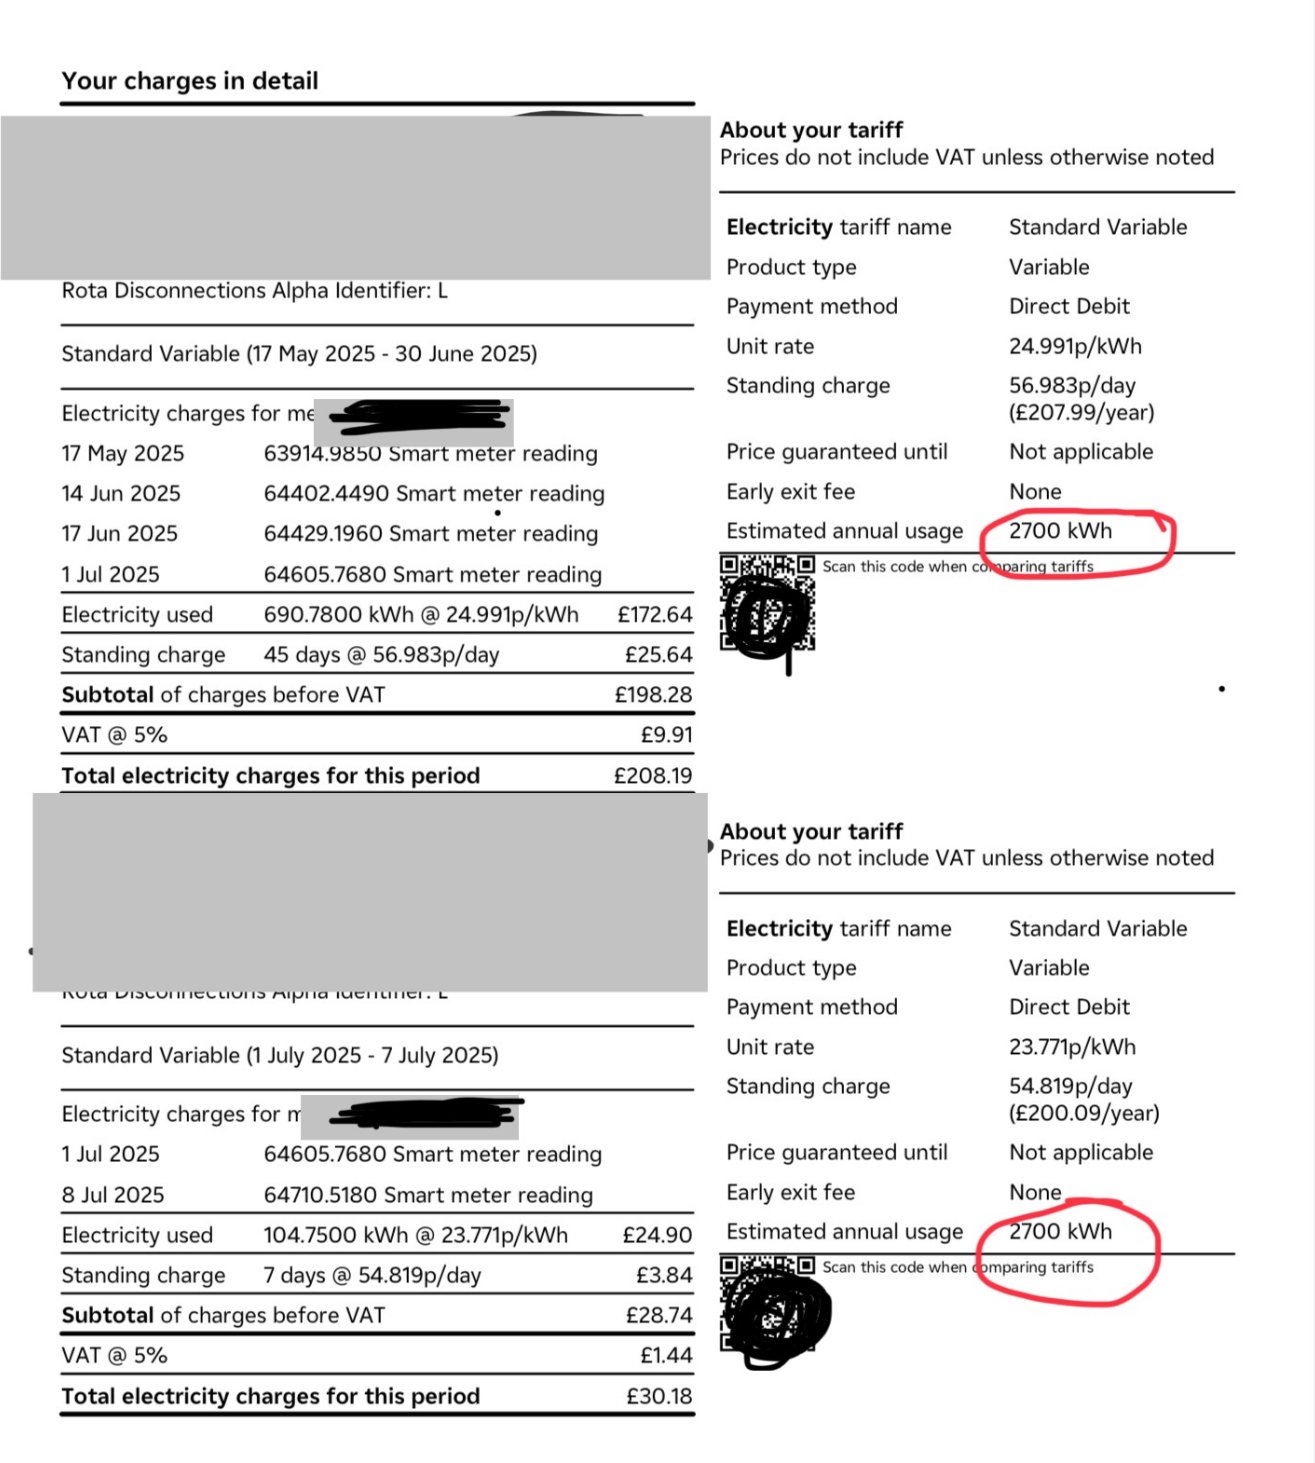
Re bills - ignore the 2700 - that just seems to be the DFDD cap - and bears no resemblance to recent use on those bills.The 690 kWh for 45 days to 1st Jul - suggests around 5500 kWhThe c105 kWh for 7 days from 1st Jul - again suggests around 5500 kWhAs per the above for an earlier bill (Apr) - around 15 kWh / day.
0 -
I would totally ignore the annual estimates on the bills, both the high and low ones, as they are often way off the truth.Have you earlier bills with reads ? You could then get a better picture of your real use, as above it looks like you are actually around the 5500 kWh mark, high but not ridiculous. You have a fairly high base load of around 400W, you really need to find the consumption of those pumps, some seem to come with a UV cleaner of up to 50W !2


Confirm your email address to Create Threads and Reply

Categories
- All Categories
- 354.4K Banking & Borrowing
- 254.4K Reduce Debt & Boost Income
- 455.4K Spending & Discounts
- 247.3K Work, Benefits & Business
- 604K Mortgages, Homes & Bills
- 178.4K Life & Family
- 261.5K Travel & Transport
- 1.5M Hobbies & Leisure
- 16K Discuss & Feedback
- 37.7K Read-Only Boards