We’d like to remind Forumites to please avoid political debate on the Forum.
This is to keep it a safe and useful space for MoneySaving discussions. Threads that are – or become – political in nature may be removed in line with the Forum’s rules. Thank you for your understanding.
📨 Have you signed up to the Forum's new Email Digest yet? Get a selection of trending threads sent straight to your inbox daily, weekly or monthly!
I'm timing the market - who's in?
Comments
-
Go for it then......zagfles said:MK62 said:zagfles said:I really don't think you get it. Volatility is your friend that will sometimes abandon you and leave you in the lurch! If you're out of the market and your target fall never happens, that loses you far more than you gain when you do hit the target. If you set a low target then you win most of the time, but when you lose you lose big. You might make a 4% gain for 4 years then a 20% loss.If it were really easy to take advantage of volatility to beat the market, all the well resourced active fund managers and institutional investment companies would be doing it and all be posting marking beating performance!....so is the "smarter" alternative then to simply throw money at the market as soon as you get it and just hope for the best?....") It would seem so
It would seem so") 0
0 -
zagfles said:MK62 said:adindas said:.There has not been any research like what you are proposing to split money into 2-3 big chunks (or whatever) waiting for a price to reach lower than the A-day price. The risk here is also the same with what previously mentioned, you might not get price lower than the A-day price you are expecting.You may not, and that's a risk, but what do you think the odds were of that if investing, for example, in the S&P500 or the FTSE All Share over the last 23 years?As for research, you may be right........but it's not that hard to do your own if you can find the data you want and are handy with spreadsheets........I happen to have a spreadsheet of the Dow from 1985 to 2021 with month start/high/low figures, which I used in a previous market timing discussion with jamesd. Was easy to amend to test this sort of thing.First test:Compare investing £100 every month at the start of every month (A-day) with waiting for a target market drop of %x and then investing, or never investing if the target isn't hit.If the market does drop by x%, then you win, you've bought cheaper and got 100/(100-x) shares, eg if x is 10% then you've got 111.1% of the shares you would have got had you invested on A-day.If you lose, ie the market is never 10% lower, the loss is far greater, you have [A-day price]/[price now]% of the share value you would have had, "now" being July 2021 as that's when my data goes up to.I averaged this for every month between 1985 and 2021 with various values for x. Obviously if x is low eg 1%, then you win most of the time, but the gain is only just over 1%, so the gain is small, but when you lose, you lose far bigger. If you set x bigger eg 20% the the gain is bigger when you win but of course you win far less of the time.Results are pretty conclusive, if you wait for a drop of 5% you'll get 87% of what you would have got without market timing. A drop of 10%, you get 73%, And it gets worse with bigger values for x. The only value that wins is 1%, and that was trivial, 100.06%Second test: Probably more realistic, as mentioned above cut losses after 12 months if target drop isn't hit and buy then.So here, the upside is as before, ie 100/(100-x)% if the target is hit.Downside if target isn't hit is [A-day price]/[price 12 months after A-day]%Here, waiting for a 5% drop averages 98%, 10% averages 95%, then it stays around 92-95% whatever values you use. So smaller losses, but still losses. Using very small values for x there's a very slight average gain, 1% is 100.63% 2% is 100.7%, 3% is 100.28%. But probably not worth daily price monitoring for a 2% drop to make on average 0.63% more!
If anyone is going to time the market it wouldn't be on a monthly basis.
2 -
Decades ago I invested a lump sum then hit within weeks with a crash. It's painful never mind all this understanding your risk tolerance nobody likes to see their cash slipping away. Why's there so many threads when this happens ? So it's up to the individual how to add money.
Most are drip feeding anyway , monthly pension contributions , routine ISA top up etc. Drip feeding isn't really about beating the market it's just adding money when you've got it.
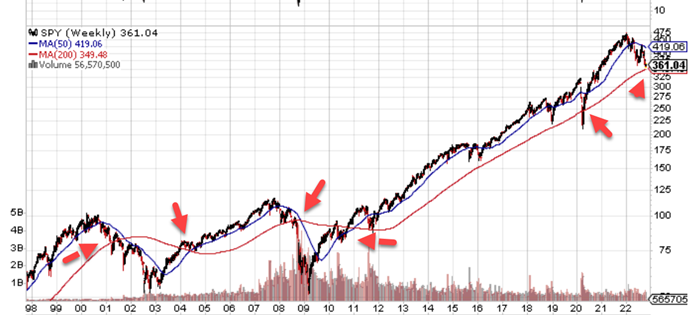
Waiting for a specific drop from the high won't work . Wait for 5% drop but the market goes up 20% before the magic 5% comes along. Illustration below with a long term chart Let's imagine you are topping up at the 50 week moving average in blue every year. In an uptrend chances are you are drip feeding at higher levels but at least you're in at a pullback from a recent high. Luckily in a downtrend as show in 2001 and 2008 you might get in way cheaper but you've still got to make a call when to enter ? The weekly timeframe with the 50 week moving average is a handy guide anyway .
sp-500-index-fund-200-week-moving-average-chart.png (700×315) (seeitmarket.com)
Been below the 50 week moving average shown in green for nearly a year now.
$SPX | SharpCharts | StockCharts.com
2 -
Michael121 said:zagfles said:MK62 said:adindas said:.There has not been any research like what you are proposing to split money into 2-3 big chunks (or whatever) waiting for a price to reach lower than the A-day price. The risk here is also the same with what previously mentioned, you might not get price lower than the A-day price you are expecting.You may not, and that's a risk, but what do you think the odds were of that if investing, for example, in the S&P500 or the FTSE All Share over the last 23 years?As for research, you may be right........but it's not that hard to do your own if you can find the data you want and are handy with spreadsheets........I happen to have a spreadsheet of the Dow from 1985 to 2021 with month start/high/low figures, which I used in a previous market timing discussion with jamesd. Was easy to amend to test this sort of thing.First test:Compare investing £100 every month at the start of every month (A-day) with waiting for a target market drop of %x and then investing, or never investing if the target isn't hit.If the market does drop by x%, then you win, you've bought cheaper and got 100/(100-x) shares, eg if x is 10% then you've got 111.1% of the shares you would have got had you invested on A-day.If you lose, ie the market is never 10% lower, the loss is far greater, you have [A-day price]/[price now]% of the share value you would have had, "now" being July 2021 as that's when my data goes up to.I averaged this for every month between 1985 and 2021 with various values for x. Obviously if x is low eg 1%, then you win most of the time, but the gain is only just over 1%, so the gain is small, but when you lose, you lose far bigger. If you set x bigger eg 20% the the gain is bigger when you win but of course you win far less of the time.Results are pretty conclusive, if you wait for a drop of 5% you'll get 87% of what you would have got without market timing. A drop of 10%, you get 73%, And it gets worse with bigger values for x. The only value that wins is 1%, and that was trivial, 100.06%Second test: Probably more realistic, as mentioned above cut losses after 12 months if target drop isn't hit and buy then.So here, the upside is as before, ie 100/(100-x)% if the target is hit.Downside if target isn't hit is [A-day price]/[price 12 months after A-day]%Here, waiting for a 5% drop averages 98%, 10% averages 95%, then it stays around 92-95% whatever values you use. So smaller losses, but still losses. Using very small values for x there's a very slight average gain, 1% is 100.63% 2% is 100.7%, 3% is 100.28%. But probably not worth daily price monitoring for a 2% drop to make on average 0.63% more!
If anyone is going to time the market it wouldn't be on a monthly basis.
You're missing the point. Whether you do it monthly or not, my analysis provides around 430 discreet results from 430 attempts to time the market, based on the Dow (just because I had the data). It gives the average results from those attempts, based on the two criteria I used, ie either waiting for an x% drop without a time limit, or waiting for an x% drop in the next 12 months and if it doesn't happen buy then to cut your losses.You could play around with other criteria, or you could used different indices. I doubt the results would be significantly different over the long term.I knew the answer anyway, based on it being obvious that's there's no way to successfully time an efficient market which is constantly micro-analysed by people with far more resources than an Excel spreadsheet. It was just someone mentioned spreadsheet analysis and I had one handy.Anyway, if people want to try, fill your boots. You might win, just like people sometimes win in a casino. As long as you understand it's a bit of fun not a sure fire way to beat the market...
0 -
If all the active fund managers could beat the market wouldn't we all just use active at which point they would probably stop outperforming.zagfles said:If it were really easy to take advantage of volatility to beat the market, all the well resourced active fund managers and institutional investment companies would be doing it and all be posting marking beating performance!
Read about Jim Simmons he has beat the market and made the fund smaller in the end because the bigger the fund the less edge he had.
0 -
I'm well aware i can't time the market just saying those that do are gonna be more advanced than buying or selling on monthly basis.zagfles said:You're missing the point. Whether you do it monthly or not, my analysis provides around 430 discreet results from 430 attempts to time the market, based on the Dow (just because I had the data). It gives the average results from those attempts, based on the two criteria I used, ie either waiting for an x% drop without a time limit, or waiting for an x% drop in the next 12 months and if it doesn't happen buy then to cut your losses.You could play around with other criteria, or you could used different indices. I doubt the results would be significantly different over the long term.I knew the answer anyway, based on it being obvious that's there's no way to successfully time an efficient market which is constantly micro-analysed by people with far more resources than an Excel spreadsheet. It was just someone mentioned spreadsheet analysis and I had one handy.Anyway, if people want to try, fill your boots. You might win, just like people sometimes win in a casino. As long as you understand it's a bit of fun not a sure fire way to beat the market...
1 -
Michael121 said:
If all the active fund managers could beat the market wouldn't we all just use active at which point they would probably stop outperforming.zagfles said:If it were really easy to take advantage of volatility to beat the market, all the well resourced active fund managers and institutional investment companies would be doing it and all be posting marking beating performance!
Read about Jim Simmons he has beat the market and made the fund smaller in the end because the bigger the fund the less edge he had.There's two ways to time the market. First, try to take advantage of short term volatility and trends, which is what we've been discussing. Second is to out-think the market, ie have a better understanding of the current drivers in the market - politics, economics, social factors etc and how that will likely affect company prospects in different sectors, and which companies are undervalued in relation to likely future prospects.The first is too easy to analyse, which means any method which gave an edge would have been exploited enough to remove that edge.It's the second method which active fund managers almost invariably use. That's far harder to analyse, which means it's possible that some fund managers will have the edge. Although some can beat the market for years and then go wrong, Woodford being an obvious example, and the likes of Richard Pease who beat the market for decades but recent performance hasn't been good.0 -
Appreciate your comments and your spreadsheet data. There are papers on trends and it is anything but easy. I'm not talking about charting and 200d ma crossing 50d ma or whatever. Just some members try say this or that is evidence of so and so isn't possible. But if you look for it clearly some people have access to stuff that would blow even the smartest peoples minds.zagfles said:Michael121 said:
If all the active fund managers could beat the market wouldn't we all just use active at which point they would probably stop outperforming.zagfles said:If it were really easy to take advantage of volatility to beat the market, all the well resourced active fund managers and institutional investment companies would be doing it and all be posting marking beating performance!
Read about Jim Simmons he has beat the market and made the fund smaller in the end because the bigger the fund the less edge he had.There's two ways to time the market. First, try to take advantage of short term volatility and trends, which is what we've been discussing. Second is to out-think the market, ie have a better understanding of the current drivers in the market - politics, economics, social factors etc and how that will likely affect company prospects in different sectors, and which companies are undervalued in relation to likely future prospects.The first is too easy to analyse, which means any method which gave an edge would have been exploited enough to remove that edge.It's the second method which active fund managers almost invariably use. That's far harder to analyse, which means it's possible that some fund managers will have the edge. Although some can beat the market for years and then go wrong, Woodford being an obvious example, and the likes of Richard Pease who beat the market for decades but recent performance hasn't been good.
If you follow certain people on twitter they clearly know a lot more than talking heads on the media. I think there a couple of forum members on here that made some timely changes to there portfolio, didn't someone hedge there usa exposure, in fact if you look through posts after last 2 years members called ballie and gifford probably isn't likely to keep going parabolic in the short term, BTC has had its day at least for the short term, bonds not looking so great anymore and the rotation it UK end of year 2020.
So if some forum members are making a few good decisions here and there, im sure those with access to stuff only the rich can afford are able to find an edge somewhere.
Have any of you seen that chatgpt bot, go have a play with that. Imagine what the developers could be doing with that in the background.0 -
Michael121 said:
Appreciate your comments and your spreadsheet data. There are papers on trends and it is anything but easy. I'm not talking about charting and 200d ma crossing 50d ma or whatever. Just some members try say this or that is evidence of so and so isn't possible. But if you look for it clearly some people have access to stuff that would blow even the smartest peoples minds.zagfles said:Michael121 said:
If all the active fund managers could beat the market wouldn't we all just use active at which point they would probably stop outperforming.zagfles said:If it were really easy to take advantage of volatility to beat the market, all the well resourced active fund managers and institutional investment companies would be doing it and all be posting marking beating performance!
Read about Jim Simmons he has beat the market and made the fund smaller in the end because the bigger the fund the less edge he had.There's two ways to time the market. First, try to take advantage of short term volatility and trends, which is what we've been discussing. Second is to out-think the market, ie have a better understanding of the current drivers in the market - politics, economics, social factors etc and how that will likely affect company prospects in different sectors, and which companies are undervalued in relation to likely future prospects.The first is too easy to analyse, which means any method which gave an edge would have been exploited enough to remove that edge.It's the second method which active fund managers almost invariably use. That's far harder to analyse, which means it's possible that some fund managers will have the edge. Although some can beat the market for years and then go wrong, Woodford being an obvious example, and the likes of Richard Pease who beat the market for decades but recent performance hasn't been good.
If you follow certain people on twitter they clearly know a lot more than talking heads on the media. I think there a couple of forum members on here that made some timely changes to there portfolio, didn't someone hedge there usa exposure, in fact if you look through posts after last 2 years members called ballie and gifford probably isn't likely to keep going parabolic in the short term, BTC has had its day at least for the short term, bonds not looking so great anymore and the rotation it UK end of year 2020.
So if some forum members are making a few good decisions here and there, im sure those with access to stuff only the rich can afford are able to find an edge somewhere.
Have any of you seen that chatgpt bot, go have a play with that. Imagine what the developers could be doing with that in the background.Anyone can speculate and be right some of the time. Some of it the obvious anyway, BG "keep going parabolic" was obviously not going to continue long term and bonds falling with rising interest rates. If top fund managers who got it right for years and decades can start going wrong, I'm not going to be listening to random people on tw*tter who could just be rampers, or people who think they've discovered some magic formula but were really just lucky for a while.Anyone who does have a magic formula is either going to keep it to themselves and quietly get rich, or get a job at one of the big fund managers. They're not going to tell everyone else about it, it won't work if everyone knows about it!Anyway, all beside the point, all I was really trying to illustrate is that trying to time the market using a simple technique like wait for a fall before buying isn't going to give you an edge. Obviously, as with any gamble, you might get lucky even if the odds aren't in your favour...
0 -
Not trying to derail the thread but as market timing deals will only take place in weeks or months then I'll add comments as we go along. Buying the dip at X% below can be seen in CTY.L the IT in the OP's original post. In this case we'll use the 9 day moving average in the daily timeframe . I'm using this link as default settings are built into web address which isn't possible on other websites. As seen by the orange line you win some you lose some. You couldn't buy and sell based on that. You could top up but that's it.
City of London Investment Trust PLC, UK:CTY Advanced Chart - (LON) UK:CTY, City of London Investment Trust PLC Stock Price - BigCharts.com (marketwatch.com)
You need other indicators to help but the trouble is there's dozens and more. I've narrowed it down as much as I can as many are similar in end result.
City of London Investment Trust PLC, UK:CTY Advanced Chart - (LON) UK:CTY, City of London Investment Trust PLC Stock Price - BigCharts.com (marketwatch.com)
They all swing with the chart pattern of the indices or share in general. Overbought and oversold etc.
City of London Investment Trust PLC, UK:CTY Advanced Chart - (LON) UK:CTY, City of London Investment Trust PLC Stock Price - BigCharts.com (marketwatch.com)
The indicators and moving averages need to be tighter to the price otherwise you'll be all over the place. Look at the default settings on here 50 ma and 200 ma . Blue crosses red ,SELL, October at 370p. Blue crosses red , BUY , Jan 2023 at 410p. No good then.
CTY.L | SharpCharts | StockCharts.com
As they say on Youtube " just press the like button " " subscription $100 a month " with coastline it's free 1


Confirm your email address to Create Threads and Reply

Categories
- All Categories
- 355.1K Banking & Borrowing
- 254.6K Reduce Debt & Boost Income
- 455.8K Spending & Discounts
- 247.9K Work, Benefits & Business
- 604.9K Mortgages, Homes & Bills
- 178.8K Life & Family
- 262.6K Travel & Transport
- 1.5M Hobbies & Leisure
- 16.1K Discuss & Feedback
- 37.7K Read-Only Boards