We’d like to remind Forumites to please avoid political debate on the Forum.
This is to keep it a safe and useful space for MoneySaving discussions. Threads that are – or become – political in nature may be removed in line with the Forum’s rules. Thank you for your understanding.
📨 Have you signed up to the Forum's new Email Digest yet? Get a selection of trending threads sent straight to your inbox daily, weekly or monthly!
The Forum now has a brand new text editor, adding a bunch of handy features to use when creating posts. Read more in our how-to guide
Economy crash =/= stock market crash?
Comments
-
To be honest I think the majority have decided that this kind of stuff isn't of benefit and simply buy monthly and drip feed. I doubt any dummy portfolios would change their opinion. You're right I could give it a go but it would have to be from a daily timeframe , yes it would be " guessing or timing."Linton said:
When? What do you suggest people do about the warnings?coastline said:In that previous post it's hard to imagine many private investors drawing trend lines and placing an order on Eurodollar futures.
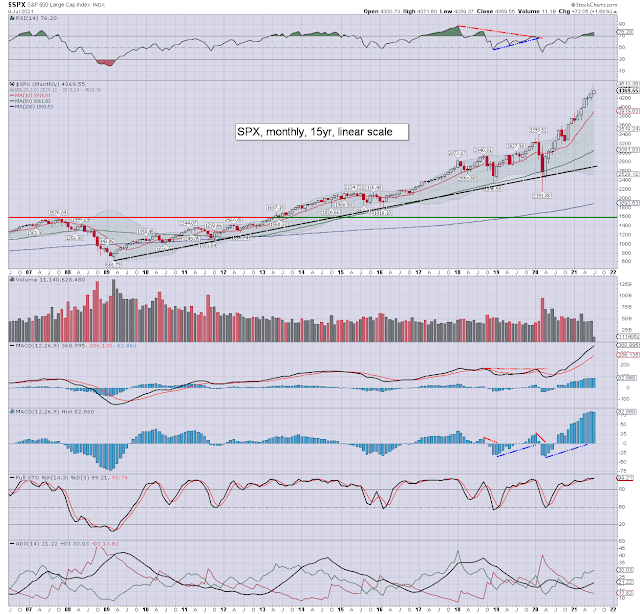
Could we have the first slide please. Thank you.
The first monthly chart I've posted and again it highlights most indicators on the top in overbought regions. In the 15 year span we can see price and the 200 average is at its highest in years .Look at that line on the right of the chart around 1950 and the index itself over 4000.
spx+m+jul9.png (640×614) (bp.blogspot.com)
Next slide please.
The weekly is similar with indicators overbought and the distance between price and the 200 average at its highest since 1999.
$SPX | SharpChart | StockCharts.com
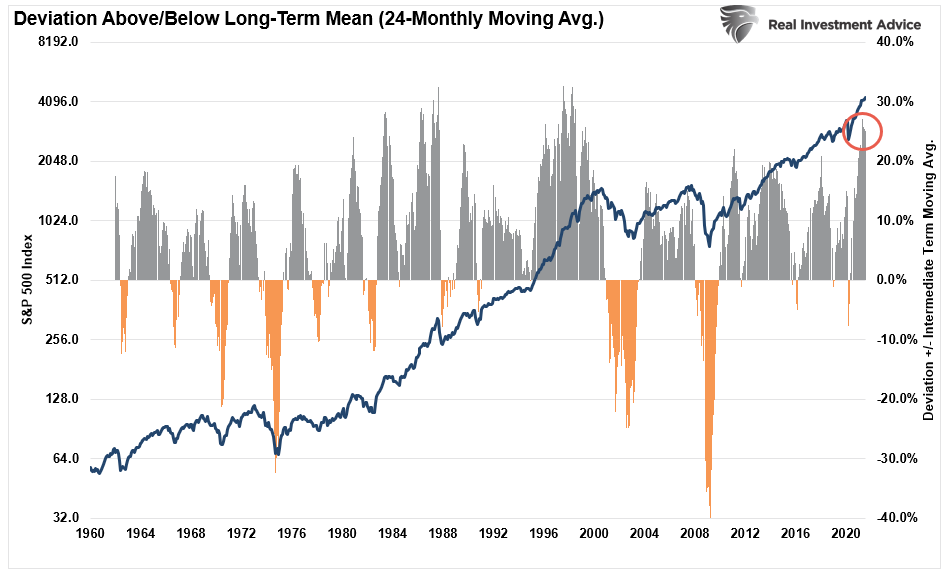
The grey area highlighted here clearly shows an extended picture.
SP500-Deviation-Above-Below-Trend-062521.png (945×572) (realinvestmentadvice.com)
And the last slide please.
The daily also showing the same situation where indicators are overbought.
$SPX | SharpChart | StockCharts.com
Conclusion. Warning signals all over the place not that the tea leaves can tell you the next move. A bit of consolidation or a healthy correction wouldn't be a surprise.
To convince the sceptics it would be easy to set up 2 identical dummy portfolios, leave one to do as it will and manage the other in line with your signals. If you published the results monthly it would be interesting.
Is the forum suitable for such an exercise when many are new starters ? The main highlight I take from these indicators is it's better to buy when they are low and sell when they are high. There is some link when you look on a regular basis. At the moment they all are high in every timeframe it doesn't happen every day.2 -
Google 'food shortages'0
-
No, they’ll generally have more sense.coastline said:In that previous post it's hard to imagine many private investors drawing trend lines and placing an order on Eurodollar futures.
It was my first trade as a graduate on a trading desk, and nothing I’ve seen in the twenty-five years trading since has suggested that technical analysis has any more validity than reading tea leaves. There’s good evidence as well as common sense in that view.0 -
But if technical analysis were as bad as reading tea leaves say 99.9% then all he needs to do is reverse his view and all of a sudden he is 99.9% accurate.GeordieGeorge said:
No, they’ll generally have more sense.coastline said:In that previous post it's hard to imagine many private investors drawing trend lines and placing an order on Eurodollar futures.
It was my first trade as a graduate on a trading desk, and nothing I’ve seen in the twenty-five years trading since has suggested that technical analysis has any more validity than reading tea leaves. There’s good evidence as well as common sense in that view.0 -
Whether technical analysis is good or bad seems largely irrelevant if enough people use it such that it has an impact on the market. I'm neutral on the subject, but it does appear that prices, at least in the short term, often move relative to support and resistance. Seems many do use it for trading, not investing, and as this board relates to the latter then we may expect most posters to be negative on the subject...0
-
Personally i think in the short term people are betting on where earnings are going and in the long term they trend up.
S&P 500 Earnings - 90 Year Historical Chart | MacroTrends
Interesting chart especially now market has gone up and earnings have gone down where in the past they tend to follow each other up and down.
Apart from 1972 crash when earnings rocketed and the market crashed. Now its in reverse, maybe the market comes back down to earnings, i don't know were see.0 -
Ok I'll give this a go and I will add it to this thread. Why because I don't want a thread highlighting a system where inexperienced investors think it's a wise move. The calls of buy or sell will be from the daily timeframe. I'll use the likes of the FTSE 100 and SP 500 and some UK shares just to vary the experiment.Linton said:
When? What do you suggest people do about the warnings?coastline said:In that previous post it's hard to imagine many private investors drawing trend lines and placing an order on Eurodollar futures.
Could we have the first slide please. Thank you.
The first monthly chart I've posted and again it highlights most indicators on the top in overbought regions. In the 15 year span we can see price and the 200 average is at its highest in years .Look at that line on the right of the chart around 1950 and the index itself over 4000.
spx+m+jul9.png (640×614) (bp.blogspot.com)
Next slide please.
The weekly is similar with indicators overbought and the distance between price and the 200 average at its highest since 1999.
$SPX | SharpChart | StockCharts.com
The grey area highlighted here clearly shows an extended picture.
SP500-Deviation-Above-Below-Trend-062521.png (945×572) (realinvestmentadvice.com)
And the last slide please.
The daily also showing the same situation where indicators are overbought.
$SPX | SharpChart | StockCharts.com
Conclusion. Warning signals all over the place not that the tea leaves can tell you the next move. A bit of consolidation or a healthy correction wouldn't be a surprise.
To convince the sceptics it would be easy to set up 2 identical dummy portfolios, leave one to do as it will and manage the other in line with your signals. If you published the results monthly it would be interesting.
4 years ago I asked to join this thread using a similar system but was turned down by the OP.
Great British Invest off or Passive V Active Discussion - Page 3 — MoneySavingExpert Forum
I've noticed you are involved in that very thread with a fair few funds in motion.
Great British Invest off or Passive V Active Portfolios — MoneySavingExpert Forum
In your posting history, as you gather these things as you read the daily posts, I see you're not a fan of a global tracker. You have several rules to your portfolio build eg, no more than 40% in one region etc etc. I've noticed your Growth performance is 46% over the near 4 year period to date. A simple global tracker looks to be around 58% ish ?? Given this situation do you think you're going in the right direction after extensive research ?. 4 years is a long time to underperform the basic benchmark. Not being funny but I kind of took your earlier reply as a " put up or shut up " considering you highlighted bits in bold.
0 -
I don't know how to use tea leaves to pick stocks, but I would expect around 50% accuracy, not 0.1% from any system that actually inputs a list of stocks.Michael121 said:
But if technical analysis were as bad as reading tea leaves say 99.9% then all he needs to do is reverse his view and all of a sudden he is 99.9% accurate.GeordieGeorge said:
No, they’ll generally have more sense.coastline said:In that previous post it's hard to imagine many private investors drawing trend lines and placing an order on Eurodollar futures.
It was my first trade as a graduate on a trading desk, and nothing I’ve seen in the twenty-five years trading since has suggested that technical analysis has any more validity than reading tea leaves. There’s good evidence as well as common sense in that view.
Eco Miser
Saving money for well over half a century0 -
Earnings are improving but who knows where they'll be in years to come. I'm no expert but I tend to look no further than a year or two out. Can you really forecast any further ? To be fair analysts have called this recover fairly well. Nice little bookmark here.Michael121 said:Personally i think in the short term people are betting on where earnings are going and in the long term they trend up.
S&P 500 Earnings - 90 Year Historical Chart | MacroTrends
Interesting chart especially now market has gone up and earnings have gone down where in the past they tend to follow each other up and down.
Apart from 1972 crash when earnings rocketed and the market crashed. Now its in reverse, maybe the market comes back down to earnings, i don't know were see.
E5eeSVVWEAIqfEX (900×654) (twimg.com)
FactSet (@FactSet) / Twitter
EDIT.. Michael what I meant about forecasting any further than a year or so was a general comment. Sorry to confuse.0 -
I wasn't being seriousEco_Miser said:")
I don't know how to use tea leaves to pick stocks, but I would expect around 50% accuracy, not 0.1% from any system that actually inputs a list of stocks.Michael121 said:
But if technical analysis were as bad as reading tea leaves say 99.9% then all he needs to do is reverse his view and all of a sudden he is 99.9% accurate.GeordieGeorge said:
No, they’ll generally have more sense.coastline said:In that previous post it's hard to imagine many private investors drawing trend lines and placing an order on Eurodollar futures.
It was my first trade as a graduate on a trading desk, and nothing I’ve seen in the twenty-five years trading since has suggested that technical analysis has any more validity than reading tea leaves. There’s good evidence as well as common sense in that view. 0


Confirm your email address to Create Threads and Reply

Categories
- All Categories
- 354.5K Banking & Borrowing
- 254.4K Reduce Debt & Boost Income
- 455.5K Spending & Discounts
- 247.4K Work, Benefits & Business
- 604.2K Mortgages, Homes & Bills
- 178.5K Life & Family
- 261.7K Travel & Transport
- 1.5M Hobbies & Leisure
- 16.1K Discuss & Feedback
- 37.7K Read-Only Boards