We’d like to remind Forumites to please avoid political debate on the Forum.
This is to keep it a safe and useful space for MoneySaving discussions. Threads that are – or become – political in nature may be removed in line with the Forum’s rules. Thank you for your understanding.
📨 Have you signed up to the Forum's new Email Digest yet? Get a selection of trending threads sent straight to your inbox daily, weekly or monthly!
The Forum now has a brand new text editor, adding a bunch of handy features to use when creating posts. Read more in our how-to guide
Economy crash =/= stock market crash?
Comments
-
I can read tea leaves if that's of any interest.Alistair31 said:Is there any good resource that explains in basic terms those charts with the red and green bars? More so for general interest, rather than something to act on.0 -
ChartSchool | Technical Analysis Education | StockCharts.comAlistair31 said:Is there any good resource that explains in basic terms those charts with the red and green bars? More so for general interest, rather than something to act on.
From the above link go here and look at Candlestick Charts. History from 1850 not something made up on the internet last week.
Chart Analysis [ChartSchool] (stockcharts.com)
You get a better idea of what actually happened with candlesticks than simple line charts. The candlesticks show the Open Close High and Low for the day.
EG below... See those spikes on each candle they can give a clue to a reversal in trend . Look at 10th of May. Dow gets to 35200 then ends the day at 34700 a 500 drop. On May 19th the reverse process happened. Got to 33500 and finished near 34000. Solid candles tend to show continuous movement without much variation. Straight up all day or straight down all day. Again looking at the chart see how very small daily moves can be wiped out by one or two moves the other way.
$INDU | SharpChart | StockCharts.com
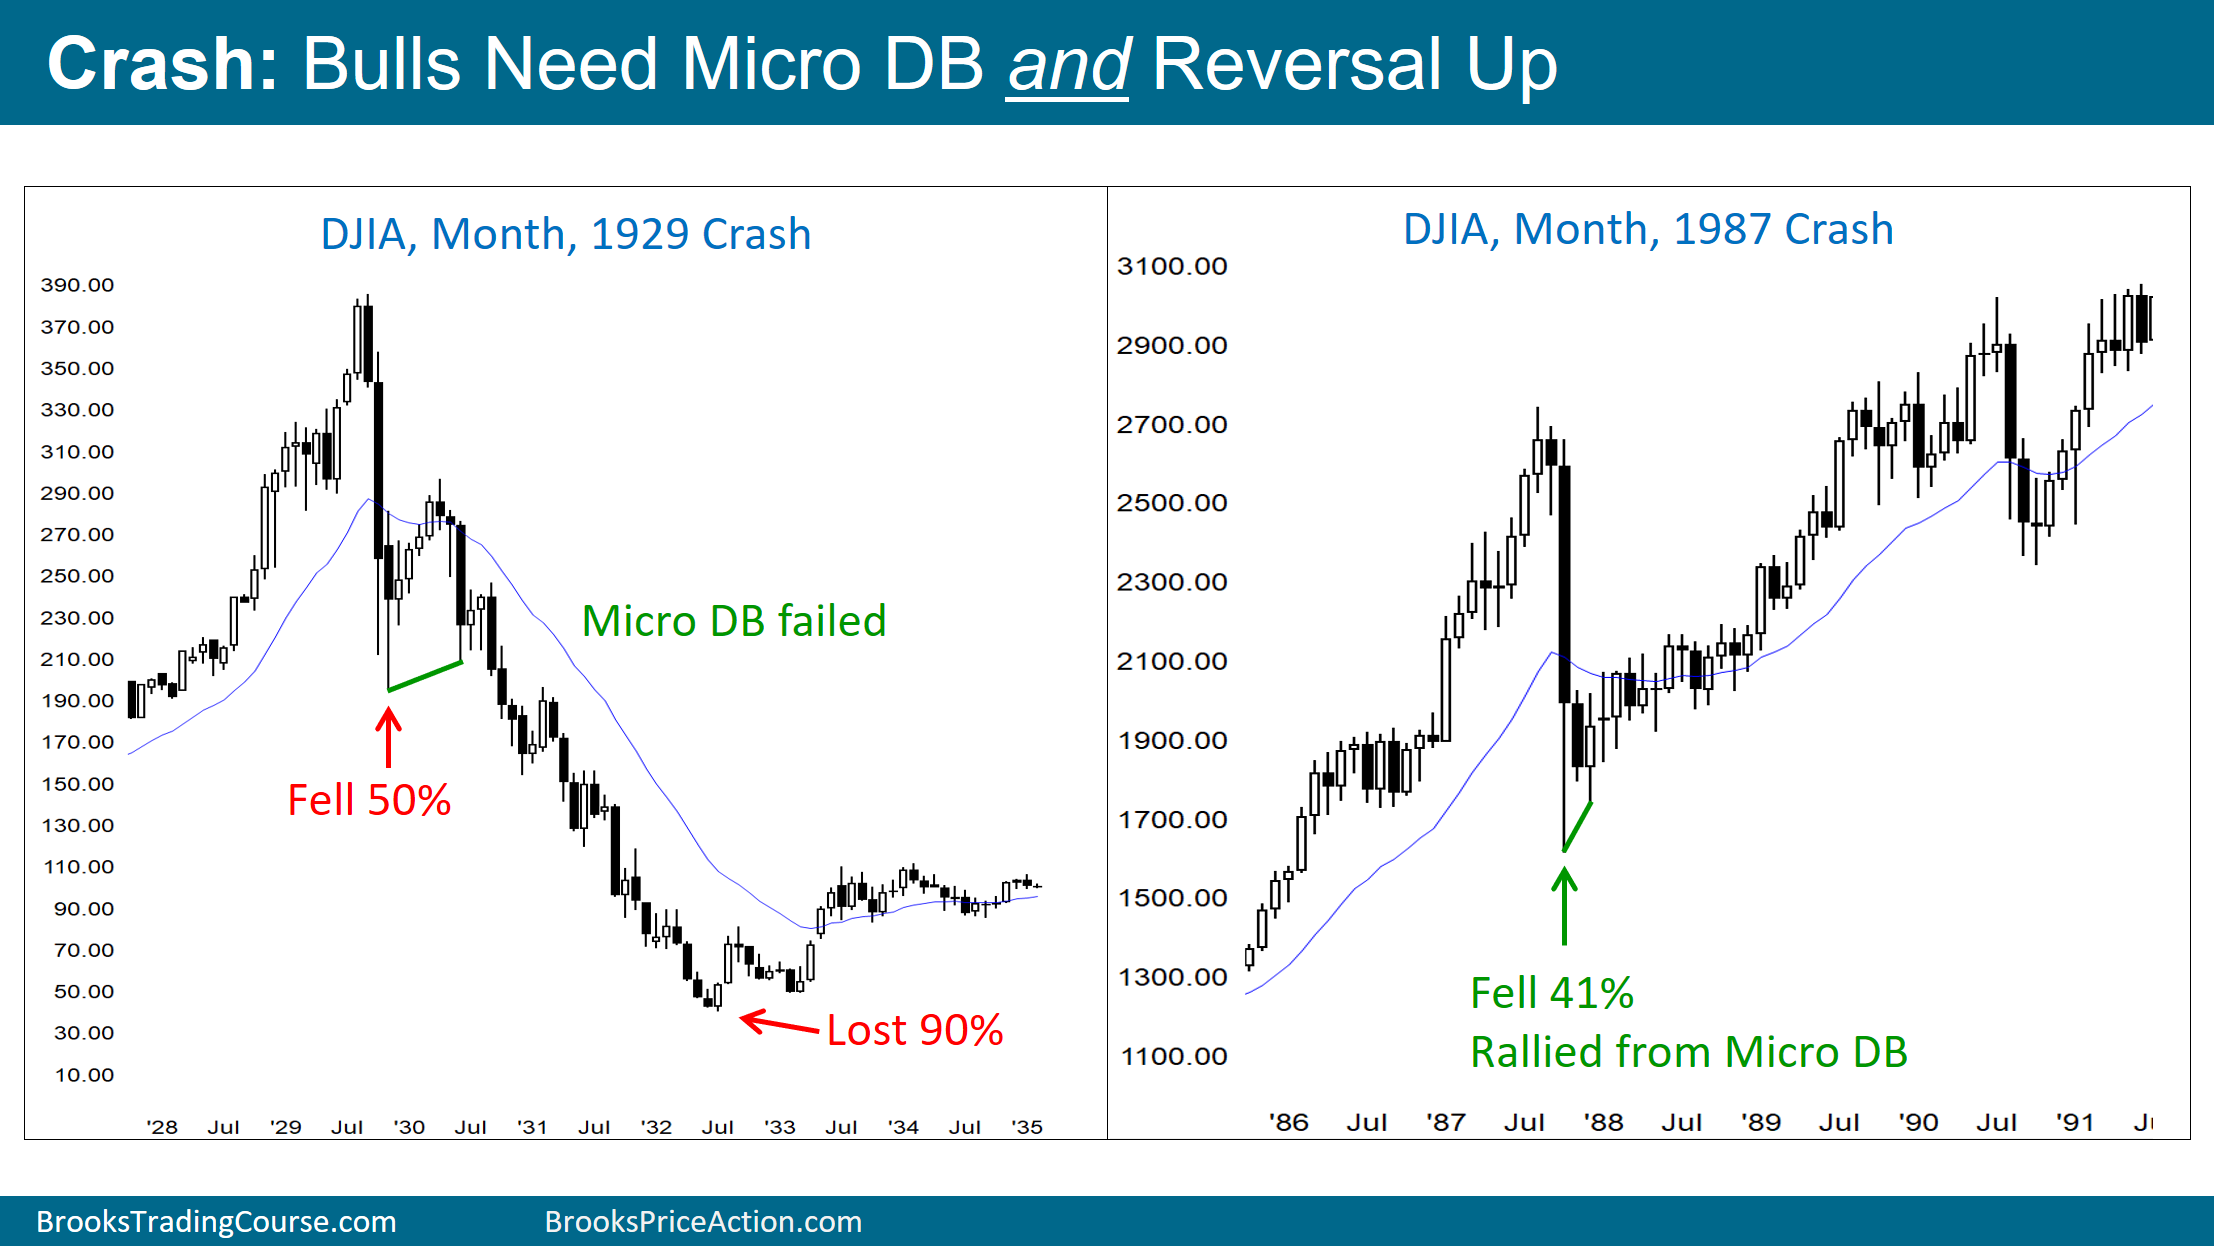
1987 crash . Look at the candle wick. Way down then reversed. The gap shows the market simply opened with a huge drop and never recovered.
spy1987-weekly.png (620×639) (ivanhoff.com)
1929 July a powerful move to the low then a reversal showing a long candle wick.
pic18cead2bf6a64134a3e2652382da116a.png (2214×1246) (akamaized.net)
0 -
Screens aren't suggesting any particular general value at current price levels. Fair amount of recovery growth already priced in.sevenhills said:
No, it just shows that shares are at a historically low price, although you would expect that with COVID and many organisations not working at full capacity.Thrugelmir said:Is that with income reinvested?0 -
Looking back analysis is easy. What about predicting the future using it?coastline said:
ChartSchool | Technical Analysis Education | StockCharts.comAlistair31 said:Is there any good resource that explains in basic terms those charts with the red and green bars? More so for general interest, rather than something to act on.
From the above link go here and look at Candlestick Charts. History from 1850 not something made up on the internet last week.
Chart Analysis [ChartSchool] (stockcharts.com)
You get a better idea of what actually happened with candlesticks than simple line charts. The candlesticks show the Open Close High and Low for the day.
EG below... See those spikes on each candle they can give a clue to a reversal in trend . Look at 10th of May. Dow gets to 35200 then ends the day at 34700 a 500 drop. On May 19th the reverse process happened. Got to 33500 and finished near 34000. Solid candles tend to show continuous movement without much variation. Straight up all day or straight down all day. Again looking at the chart see how very small daily moves can be wiped out by one or two moves the other way.
$INDU | SharpChart | StockCharts.com
1987 crash . Look at the candle wick. Way down then reversed. The gap shows the market simply opened with a huge drop and never recovered.
spy1987-weekly.png (620×639) (ivanhoff.com)
1929 July a powerful move to the low then a reversal showing a long candle wick.
pic18cead2bf6a64134a3e2652382da116a.png (2214×1246) (akamaized.net)0 -
As per the Credit Suisse yearbook, history does not repeat itself, but it rhymes.
You may not believe in technical analysis, many don't and I'm yet to be convinced. However, it appears that enough people use it such that it does impact on price movements. You only have to look at how prices bounce off of trend lines, resistance and support etc.1 -
I look at a lot of stuff and TA is just one of them. Not obsessed with it but find it useful. Can it be used to predict the future .? No but history can give clues . Why bother gathering any data if its no good about any subject out there. ? Referring to markets why do posters continue to repeat stuff about the likes of crashes and 50%. Where do they get 50% from.? History . As soon as the question is asked about asset allocation it crops up. Can you handle a 50% drop ? What if it never ever drops more than 10% again in history ? There you go but it'll be said on here within days . Then there'll be another link to history probably p/e's, debt etc etc.Type_45 said:
Looking back analysis is easy. What about predicting the future using it?coastline said:
ChartSchool | Technical Analysis Education | StockCharts.comAlistair31 said:Is there any good resource that explains in basic terms those charts with the red and green bars? More so for general interest, rather than something to act on.
From the above link go here and look at Candlestick Charts. History from 1850 not something made up on the internet last week.
Chart Analysis [ChartSchool] (stockcharts.com)
You get a better idea of what actually happened with candlesticks than simple line charts. The candlesticks show the Open Close High and Low for the day.
EG below... See those spikes on each candle they can give a clue to a reversal in trend . Look at 10th of May. Dow gets to 35200 then ends the day at 34700 a 500 drop. On May 19th the reverse process happened. Got to 33500 and finished near 34000. Solid candles tend to show continuous movement without much variation. Straight up all day or straight down all day. Again looking at the chart see how very small daily moves can be wiped out by one or two moves the other way.
$INDU | SharpChart | StockCharts.com
1987 crash . Look at the candle wick. Way down then reversed. The gap shows the market simply opened with a huge drop and never recovered.
spy1987-weekly.png (620×639) (ivanhoff.com)
1929 July a powerful move to the low then a reversal showing a long candle wick.
pic18cead2bf6a64134a3e2652382da116a.png (2214×1246) (akamaized.net)
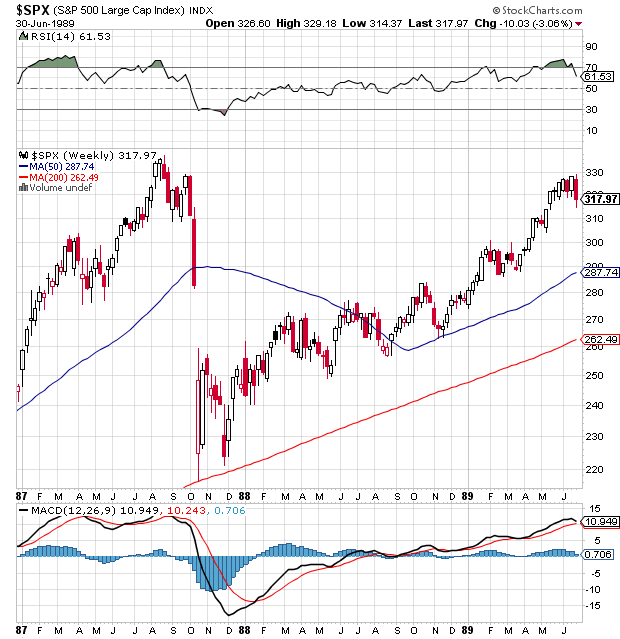
You can set your asset allocation which ever way you want and just pile in .I've done that and it's not a nice experience when it goes south overnight. So some of the links on this thread I've posted refer to TA not to bombard people just to show a few clues and situations. Take last week the daily chart I posted of the SP 500 showed six entry points in the last year using lower indicators. Surely they're not all a coincidence. ? Today I've posted situations referring to candlesticks and the wicks. Are they also a coincidence ?
Never mind I'll ask you this. You've got one go with your cash and it's 100% equity in the SP 500. Pile in and shut your eyes or look at the chart below showing a bit of history and the tea leaves. All indicators are on the top and the markets had a very good run. Could go higher ? Or wait until the markets have had a breather and buy when indicators are on the bottom. Again is it a coincidence that those indicators line up with tops and bottoms ? There's one of those spikey candle bottoms in March 2020 at 2191.86. I don't know but it's on the chart ? So I don't dismiss the tea leaves as garbage. I never think I've got it all boxed off.
$SPX | SharpChart | StockCharts.com2 -
Type_45 said:
Looking back analysis is easy. What about predicting the future using it?coastline said:
ChartSchool | Technical Analysis Education | StockCharts.comAlistair31 said:Is there any good resource that explains in basic terms those charts with the red and green bars? More so for general interest, rather than something to act on.
From the above link go here and look at Candlestick Charts. History from 1850 not something made up on the internet last week.
Chart Analysis [ChartSchool] (stockcharts.com)
You get a better idea of what actually happened with candlesticks than simple line charts. The candlesticks show the Open Close High and Low for the day.
EG below... See those spikes on each candle they can give a clue to a reversal in trend . Look at 10th of May. Dow gets to 35200 then ends the day at 34700 a 500 drop. On May 19th the reverse process happened. Got to 33500 and finished near 34000. Solid candles tend to show continuous movement without much variation. Straight up all day or straight down all day. Again looking at the chart see how very small daily moves can be wiped out by one or two moves the other way.
$INDU | SharpChart | StockCharts.com
1987 crash . Look at the candle wick. Way down then reversed. The gap shows the market simply opened with a huge drop and never recovered.
spy1987-weekly.png (620×639) (ivanhoff.com)
1929 July a powerful move to the low then a reversal showing a long candle wick.
pic18cead2bf6a64134a3e2652382da116a.png (2214×1246) (akamaized.net)There are some in the industry who do use it to manage clients money:
I am a Forum Ambassador and I support the Forum Team on the Benefits & tax credits, Heat pumps and Green & Ethical MoneySaving forums. If you need any help on those boards, do let me know. Please note that Ambassadors are not moderators. Any post you spot in breach of the Forum Rules should be reported via the report button, or by emailing forumteam@moneysavingexpert.com. All views are my own & not the official line of Money Saving Expert.1 -
Another week has passed by and no new high on the FTSE, DAX or Dow Jones. I could be wrong that the top is already in, we will find out in due course.
Markets are cyclical. The business cycle - boom and bust. The housing cycle. Everything in life is cyclical.
Here is some research I have been doing on various important cycles and there is a storm brewing in my opinion. This is my own research and I am not a perma-bear.At Number 1 we have the 80-100 year reserve currency cycle:USA ??? years 1920-???Britain 105 years (1815-1920)France 95 years (1720-1815)Netherlands 80 years (1640-1720)Spain 110 years (1530-1640)Portugal 80 years (1450-1530)The USA is due to lose reserve currency status. Historically when this happens there is a lot of turmoil.2. The UK House price cycle is 18 years. Next top is due around 2026.3. The Strauss-Howe generational cycle of 80-90 years. We are currently in the Fourth Turning cycle."The Fourth Turning is a Crisis. This is an era of destruction, often involving war or revolution, in which institutional life is destroyed and rebuilt in response to a perceived threat to the nation's survival. After the crisis, civic authority revives, cultural expression redirects towards community purpose, and people begin to locate themselves as members of a larger groupThe authors describe each turning as lasting about 20–22 years. Four turnings make up a full cycle of about 80 to 90 years"4. The 165 year Populist cycle combined with the 80-85 year great war cycle. The populist cycle describes how the mood of the people changes from being patriotic to being the opposite1775-1783 American Revolutionary War - Patriotism was high1861-1865 American civil war Patriotism was low (brother against brother)1940-1945 WWII Patriotism was high2021, 2026? Patriotism low (brother against brother, civil war etc)
5. The 82-84 year Uranus cycle.Uranus enters into Gemini in July 2025."Uranus was transiting the sign of Gemini in 1775 and remained in Gemini until 1782 (Revolutionary War 1775-1783). The U.S. Civil War began in 1861 and ended in 1865, the corresponding Uranus/Gemini transit was from 1858-1866. WWII lasted from 1939 to 1945, while the Uranus/Gemini transit lasted a bit longer from 1941-1949."6. From the Mayan calendar:The third, 13 year cycle ends in 2026 and coincides with the 104 year Venus cycle 1922-2026"This current very beneficial THIRD 13-year cycle, 2013-to-2025, of the FOUR 13-year spiritual 'energy waves' brings in sweeping social and political changes creating high integrity partnerships karmically tilting world events, with the mid-point "flowering" in 2019 Year 7. Then we 'turn the corner' again in 2021 at Year 9."
If you think the Mayan calendar is nonsense then ponder this:The very first worldwide weekend of world prayers known as the "Harmonic Convergence" of August 16 and 17, 1987, was set as to the ending of "Nine Hell Cycles" each 52-years long.August 16 1987 saw the Dow Jones make an all time high for the year and marked the end of the bull market. This was followed by the infamous Black Monday crash on 19 October 1987.Summary
All these separate cycles are pointing towards great unrest and change around 2025/2026. There is a possibility of some kind of international conflict, an internal conflict similar to a civil war, a change to the reserve currency and general financial chaos.0 -
If you were 31 years old and very much in accumulation phase, what would you do at this stage?beavere38 said:Summary
All these separate cycles are pointing towards great unrest and change around 2025/2026. There is a possibility of some kind of international conflict, an internal conflict similar to a civil war, a change to the reserve currency and general financial chaos.
0 -
Are you asking for a friend, "Alistair 31"?Alistair31 said:
If you were 31 years old and very much in accumulation phase, what would you do at this stage?beavere38 said:Summary
All these separate cycles are pointing towards great unrest and change around 2025/2026. There is a possibility of some kind of international conflict, an internal conflict similar to a civil war, a change to the reserve currency and general financial chaos.0


Confirm your email address to Create Threads and Reply

Categories
- All Categories
- 354.5K Banking & Borrowing
- 254.4K Reduce Debt & Boost Income
- 455.5K Spending & Discounts
- 247.4K Work, Benefits & Business
- 604.2K Mortgages, Homes & Bills
- 178.5K Life & Family
- 261.7K Travel & Transport
- 1.5M Hobbies & Leisure
- 16.1K Discuss & Feedback
- 37.7K Read-Only Boards