We’d like to remind Forumites to please avoid political debate on the Forum.
This is to keep it a safe and useful space for MoneySaving discussions. Threads that are – or become – political in nature may be removed in line with the Forum’s rules. Thank you for your understanding.
📨 Have you signed up to the Forum's new Email Digest yet? Get a selection of trending threads sent straight to your inbox daily, weekly or monthly!
The Forum now has a brand new text editor, adding a bunch of handy features to use when creating posts. Read more in our how-to guide
Battery Electric Vehicle News / Enjoying the Transportation Revolution
Comments
-
My suspicion is the huge company car tax break subsidy is really skewing the market, RRP is kept high so the manufacturers capture a large part of the benefit and then private sales have to be discounted to reflect the depreciation that comes as the cars no longer have the tax break in the second hand market.QrizB said:JKenH said:The SMMT suggests BEVs, despite the increase in market share, are still proving to sell, requiring a discount of £11,000 per vehicle.I don't find the SMMT's arguments particularly persuasive.
The manufacturers are subsidising BEV sales to avoid falling short of the UK ZEV mandate and having to pay out £12k per excess ICE car and £15k per excess ICE van.SMMT said:equivalent to a massive £11,000 per BEV registered. Such subsidies are clearly unsustainable.
Absorbing £11k per BEV is a cheaper option than the fines.Alternatively manufacturers could increase ICE prices to discourage buyers, but they don't want to do that for some reason.
Agreed, reducing BEV list prices could also help rebalance their sales to achieve the ZEV mandate.michaels said:However one side effect of unrealistic list prices is apparently massive depreciation which of course only discourages private buyers.I think....1 -
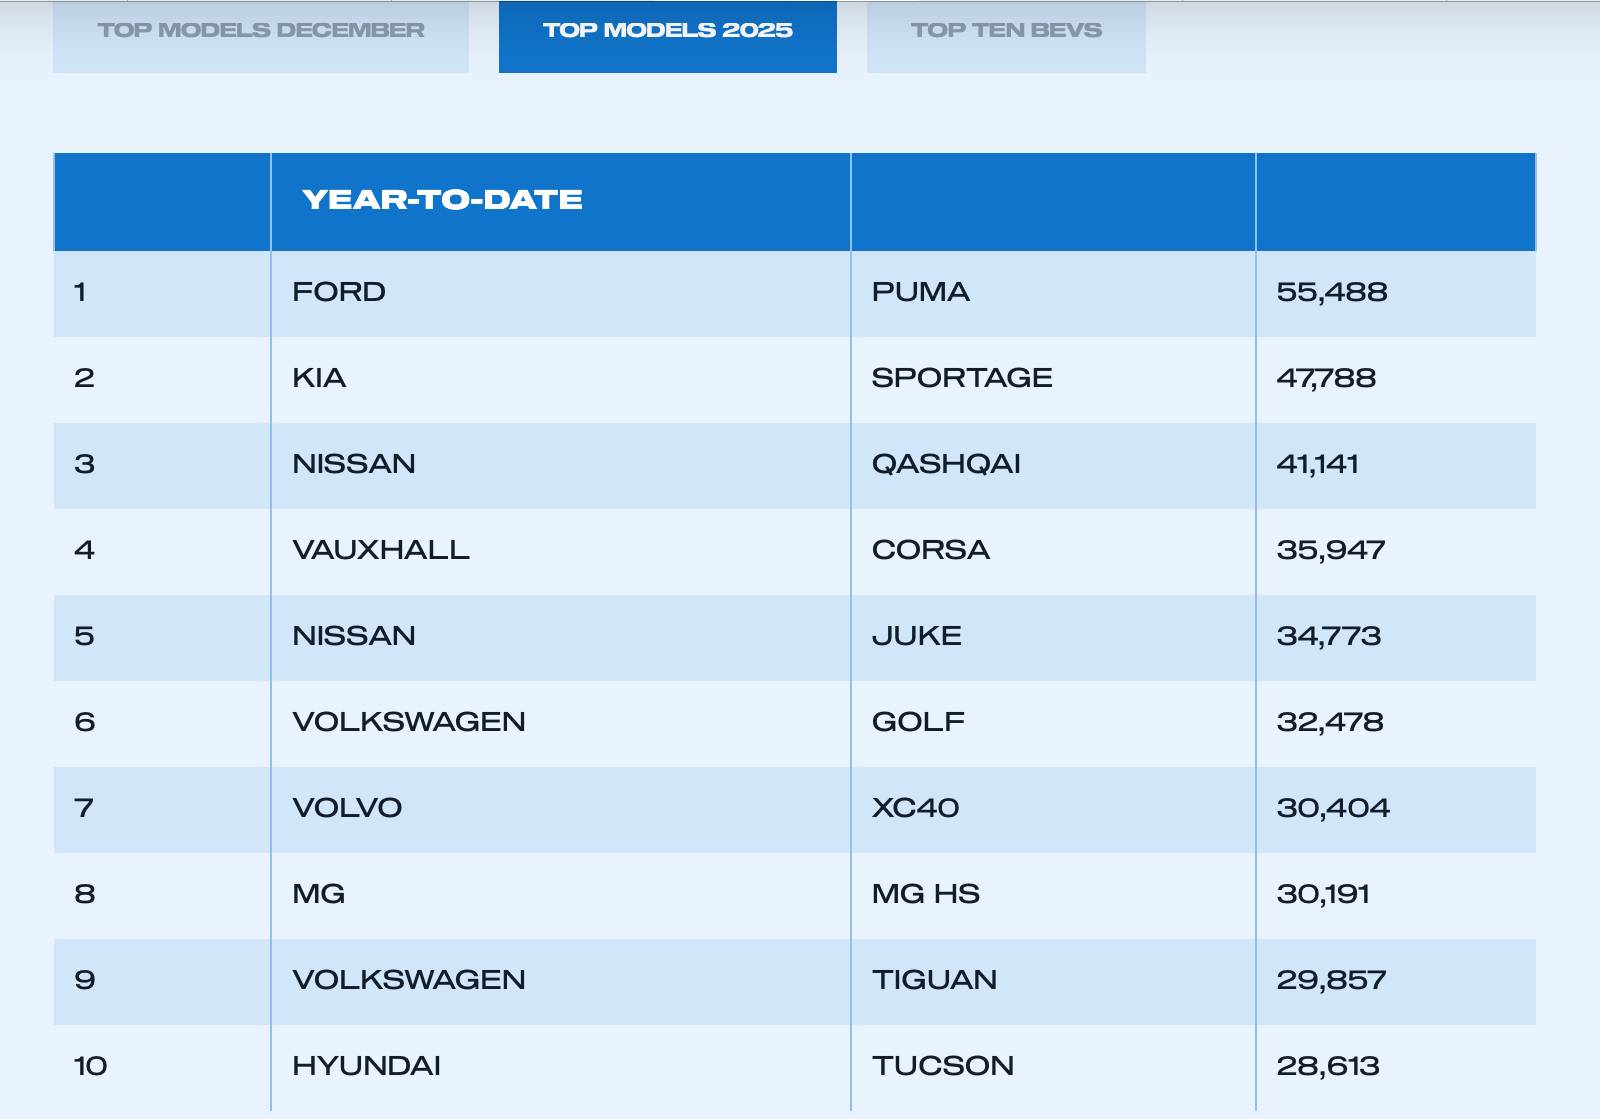
I find it interesting that no EVs make it in to the top 10 best selling cars. Surprisingly, to me, Ford’s best selling EV is the Explorer (which I wasn’t even aware existed). I would have expected it to be the electric Puma. Tesla, despite their woes, still field the top two selling EVs and Audi the next two.

 https://www.smmt.co.uk/uk-new-car-market-breaches-two-million-as-almost-one-in-four-buyers-go-electric/
Of the 51,422 cars BYD sold in the UK, 27,710 were BEVs. BYD of course don’t sell ICE vehicles but I was surprised that nearly half the sales would have been PHEVs. Of the 85,155 cars MG sold, 15,753, just 18.5% were electric. Of the 28,232 Jaecoos sold only 896 (3.2%) were BEVs. Omoda sold 19,855 cars of which 5,399 (27%) were BEVs.
My point? Other than BYD, which doesn’t sell ICE vehicles, the Chinese manufacturers sales are actually dominated by non BEVs. It is a myth that Chinese cars are succeeding in the UK cause they have caught the European manufacturers napping with their EV offerings: the motoring public choose Chinese brands because they just want cheap cars.Edit:clarification - added “BYD sold” to line 1 of penultimate paragraph.Northern Lincolnshire. 7.8 kWp system, (4.2 kWwest facing panels , 3.6 kWeast facing), Solis inverters installed 2018, 5kW SSE facing system (shaded in afternoon) added in 2025 with Tesla PW3 battery, Mitsubishi SRK35ZS-S and SRK20ZS-S Wall Mounted A2A Heat Pumps, ex Nissan Leaf owner.0 -
Electric Puma has sold 6k in the last 4 months (once ramp began) so could be on track to sell 18k in 2026 at that rate.
Interesting the Model Y was well down on the previous 3 years but the model 3 wasn't - I wonder if it being from China rather than Europe there is more scope to cut prices to maintain sales?I think....0 -
Two Austrians drove a MB eActros 600 to North Cape in the depths of winter as part of the eNordKapp Challenge 2025.I'd not heard of this event before now. I'd be happy to complete such a run in an ICE vehicle, let alone an e-HGV towing a flatbed semitrailer with what looks like a campervan on it!Article in German, but Firefox's built-in translation engine does a pretty good job.N. Hampshire, he/him. Octopus Intelligent Go elec & Tracker gas / Vodafone BB / iD mobile. Kirk Hill Co-op member.Ofgem cap table, Ofgem cap explainer. Economy 7 cap explainer. Gas vs E7 vs peak elec heating costs, Best kettle!
2.72kWp PV facing SSW installed Jan 2012. 11 x 247w panels, 3.6kw inverter. 35 MWh generated, long-term average 2.6 Os.0 -
Geotab have updated their EV battery life assessments with another year's data:Here's the TL;DR summary section:Key Insights
- Average degradation rate: The average annual electric vehicle degradation rate is 2.3%.- Power: High-power DC fast charging (>100kW) is the single largest stressor, leading to degradation rates up to twice that of the low power charging group (3.0% vs 1.5% per year).- Climate: Hot climates impose a penalty on battery life, with vehicles operating in hot conditions degrading 0.4% faster per year than those in mild climates.- Utilization: The increase in degradation from high daily use is a measurable but worthwhile trade-off for the gains in fleet productivity and ROI.- State of charge (SOC): For most EV use, there's no need to worry about avoiding fully charging or emptying the battery. Degradation only speeds up when vehicles spend over 80% of their total time at or near-full or nearly empty charge levels.N. Hampshire, he/him. Octopus Intelligent Go elec & Tracker gas / Vodafone BB / iD mobile. Kirk Hill Co-op member.Ofgem cap table, Ofgem cap explainer. Economy 7 cap explainer. Gas vs E7 vs peak elec heating costs, Best kettle!
2.72kWp PV facing SSW installed Jan 2012. 11 x 247w panels, 3.6kw inverter. 35 MWh generated, long-term average 2.6 Os.5 -
The anonymised graph of degredation shows a very sigificant difference between vehicle models. If you choose the worst, you could end up with maybe 75% capacity after 5 years compared with 94% for the best vehicles. As someone who tends to keep their car for 5-10 years, knowing which one to get is crucial.QrizB said:Geotab have updated their EV battery life assessments with another year's data:Here's the TL;DR summary section:Key Insights
- Average degradation rate: The average annual electric vehicle degradation rate is 2.3%.- Power: High-power DC fast charging (>100kW) is the single largest stressor, leading to degradation rates up to twice that of the low power charging group (3.0% vs 1.5% per year).- Climate: Hot climates impose a penalty on battery life, with vehicles operating in hot conditions degrading 0.4% faster per year than those in mild climates.- Utilization: The increase in degradation from high daily use is a measurable but worthwhile trade-off for the gains in fleet productivity and ROI.- State of charge (SOC): For most EV use, there's no need to worry about avoiding fully charging or emptying the battery. Degradation only speeds up when vehicles spend over 80% of their total time at or near-full or nearly empty charge levels.
6.4kWp (16 * 400Wp REC Alpha) facing ESE + 5kW Huawei inverter + 10kWh Huawei battery. Buckinghamshire.0 -
Hi QrizB, I'm being lazy, but does the study take account of battery pack size, which may result in more charge cycles over the same time period, if covering the same distance?QrizB said:Geotab have updated their EV battery life assessments with another year's data:Here's the TL;DR summary section:Key Insights
- Average degradation rate: The average annual electric vehicle degradation rate is 2.3%.- Power: High-power DC fast charging (>100kW) is the single largest stressor, leading to degradation rates up to twice that of the low power charging group (3.0% vs 1.5% per year).- Climate: Hot climates impose a penalty on battery life, with vehicles operating in hot conditions degrading 0.4% faster per year than those in mild climates.- Utilization: The increase in degradation from high daily use is a measurable but worthwhile trade-off for the gains in fleet productivity and ROI.- State of charge (SOC): For most EV use, there's no need to worry about avoiding fully charging or emptying the battery. Degradation only speeds up when vehicles spend over 80% of their total time at or near-full or nearly empty charge levels.Mart. Cardiff. 8.72 kWp PV systems (2.12 SSW 4.6 ESE & 2.0 WNW). 28kWh battery storage. Two A2A units for cleaner heating. Two BEV's for cleaner driving.
For general PV advice please see the PV FAQ thread on the Green & Ethical Board.1 -
Martyn1981 said:
Hi QrizB, I'm being lazy, but does the study take account of battery pack size, which may result in more charge cycles over the same time period, if covering the same distance?QrizB said:Geotab have updated their EV battery life assessments with another year's data:Here's the TL;DR summary section:Key Insights
- Average degradation rate: The average annual electric vehicle degradation rate is 2.3%.- Power: High-power DC fast charging (>100kW) is the single largest stressor, leading to degradation rates up to twice that of the low power charging group (3.0% vs 1.5% per year).- Climate: Hot climates impose a penalty on battery life, with vehicles operating in hot conditions degrading 0.4% faster per year than those in mild climates.- Utilization: The increase in degradation from high daily use is a measurable but worthwhile trade-off for the gains in fleet productivity and ROI.- State of charge (SOC): For most EV use, there's no need to worry about avoiding fully charging or emptying the battery. Degradation only speeds up when vehicles spend over 80% of their total time at or near-full or nearly empty charge levels.There is some analysis along those lines, looking at how many capacity-equivalents of charging the battery sees. See figure 7.N. Hampshire, he/him. Octopus Intelligent Go elec & Tracker gas / Vodafone BB / iD mobile. Kirk Hill Co-op member.Ofgem cap table, Ofgem cap explainer. Economy 7 cap explainer. Gas vs E7 vs peak elec heating costs, Best kettle!
2.72kWp PV facing SSW installed Jan 2012. 11 x 247w panels, 3.6kw inverter. 35 MWh generated, long-term average 2.6 Os.1 -
Article on the current UK position of BEV van sales. Not very exciting, but for me, a nice review of the current situation.
Though I was very impressed at Openreach being over 25% BEV for their fleet, already.Why it has not been so easy being green for the white van in the UK
The van in question belongs to Openreach, BT’s fibre broadband subsidiary. It is one of 6,000 electric vans out of 23,400 in Britain’s second-largest commercial fleet – and a further 1,000 are expected to be added by March.
The shift away from polluting diesel engines to electric will play a crucial role in the UK’s efforts to cut carbon emissions from vans – which were last recorded at 18m tonnes or 12% of all transport emissions in 2023.
Yet while the transition is moving forward for some of the biggest fleets, on a UK-wide level electric van sales have lagged behind expectations. For the white van, it has not been so easy being green.
Mart. Cardiff. 8.72 kWp PV systems (2.12 SSW 4.6 ESE & 2.0 WNW). 28kWh battery storage. Two A2A units for cleaner heating. Two BEV's for cleaner driving.
For general PV advice please see the PV FAQ thread on the Green & Ethical Board.2 -
Mart. Cardiff. 8.72 kWp PV systems (2.12 SSW 4.6 ESE & 2.0 WNW). 28kWh battery storage. Two A2A units for cleaner heating. Two BEV's for cleaner driving.
For general PV advice please see the PV FAQ thread on the Green & Ethical Board.2


Confirm your email address to Create Threads and Reply

Categories
- All Categories
- 354.6K Banking & Borrowing
- 254.5K Reduce Debt & Boost Income
- 455.5K Spending & Discounts
- 247.5K Work, Benefits & Business
- 604.4K Mortgages, Homes & Bills
- 178.6K Life & Family
- 262K Travel & Transport
- 1.5M Hobbies & Leisure
- 16.1K Discuss & Feedback
- 37.7K Read-Only Boards