We’d like to remind Forumites to please avoid political debate on the Forum.
This is to keep it a safe and useful space for MoneySaving discussions. Threads that are – or become – political in nature may be removed in line with the Forum’s rules. Thank you for your understanding.
📨 Have you signed up to the Forum's new Email Digest yet? Get a selection of trending threads sent straight to your inbox daily, weekly or monthly!
The Alternative Green Energy Thread
Comments
-
Demand will probably increase through the adoption of EVs and heatpumps and that may or may not increase CO2 emissions but remember they're offsetting greater emissions from the devices they're replacing. Gas boilers are not as efficient as heat pumps and ICE will never be more than 30% efficient. Cue arguments between 20% and 40%😄The overall result must(?) be a reduction in emissions which also facilitates further reduction as the grid nears carbon neutrality.4.7kwp PV split equally N and S 20° 2016.Givenergy AIO (2024)Seat Mii electric (2021). MG4 Trophy (2024).1.2kw Ripple Kirk Hill. 0.6kw Derril Water.Vaillant aroTHERM plus 5kW ASHP (2025)Gas supply capped (2025)0
-
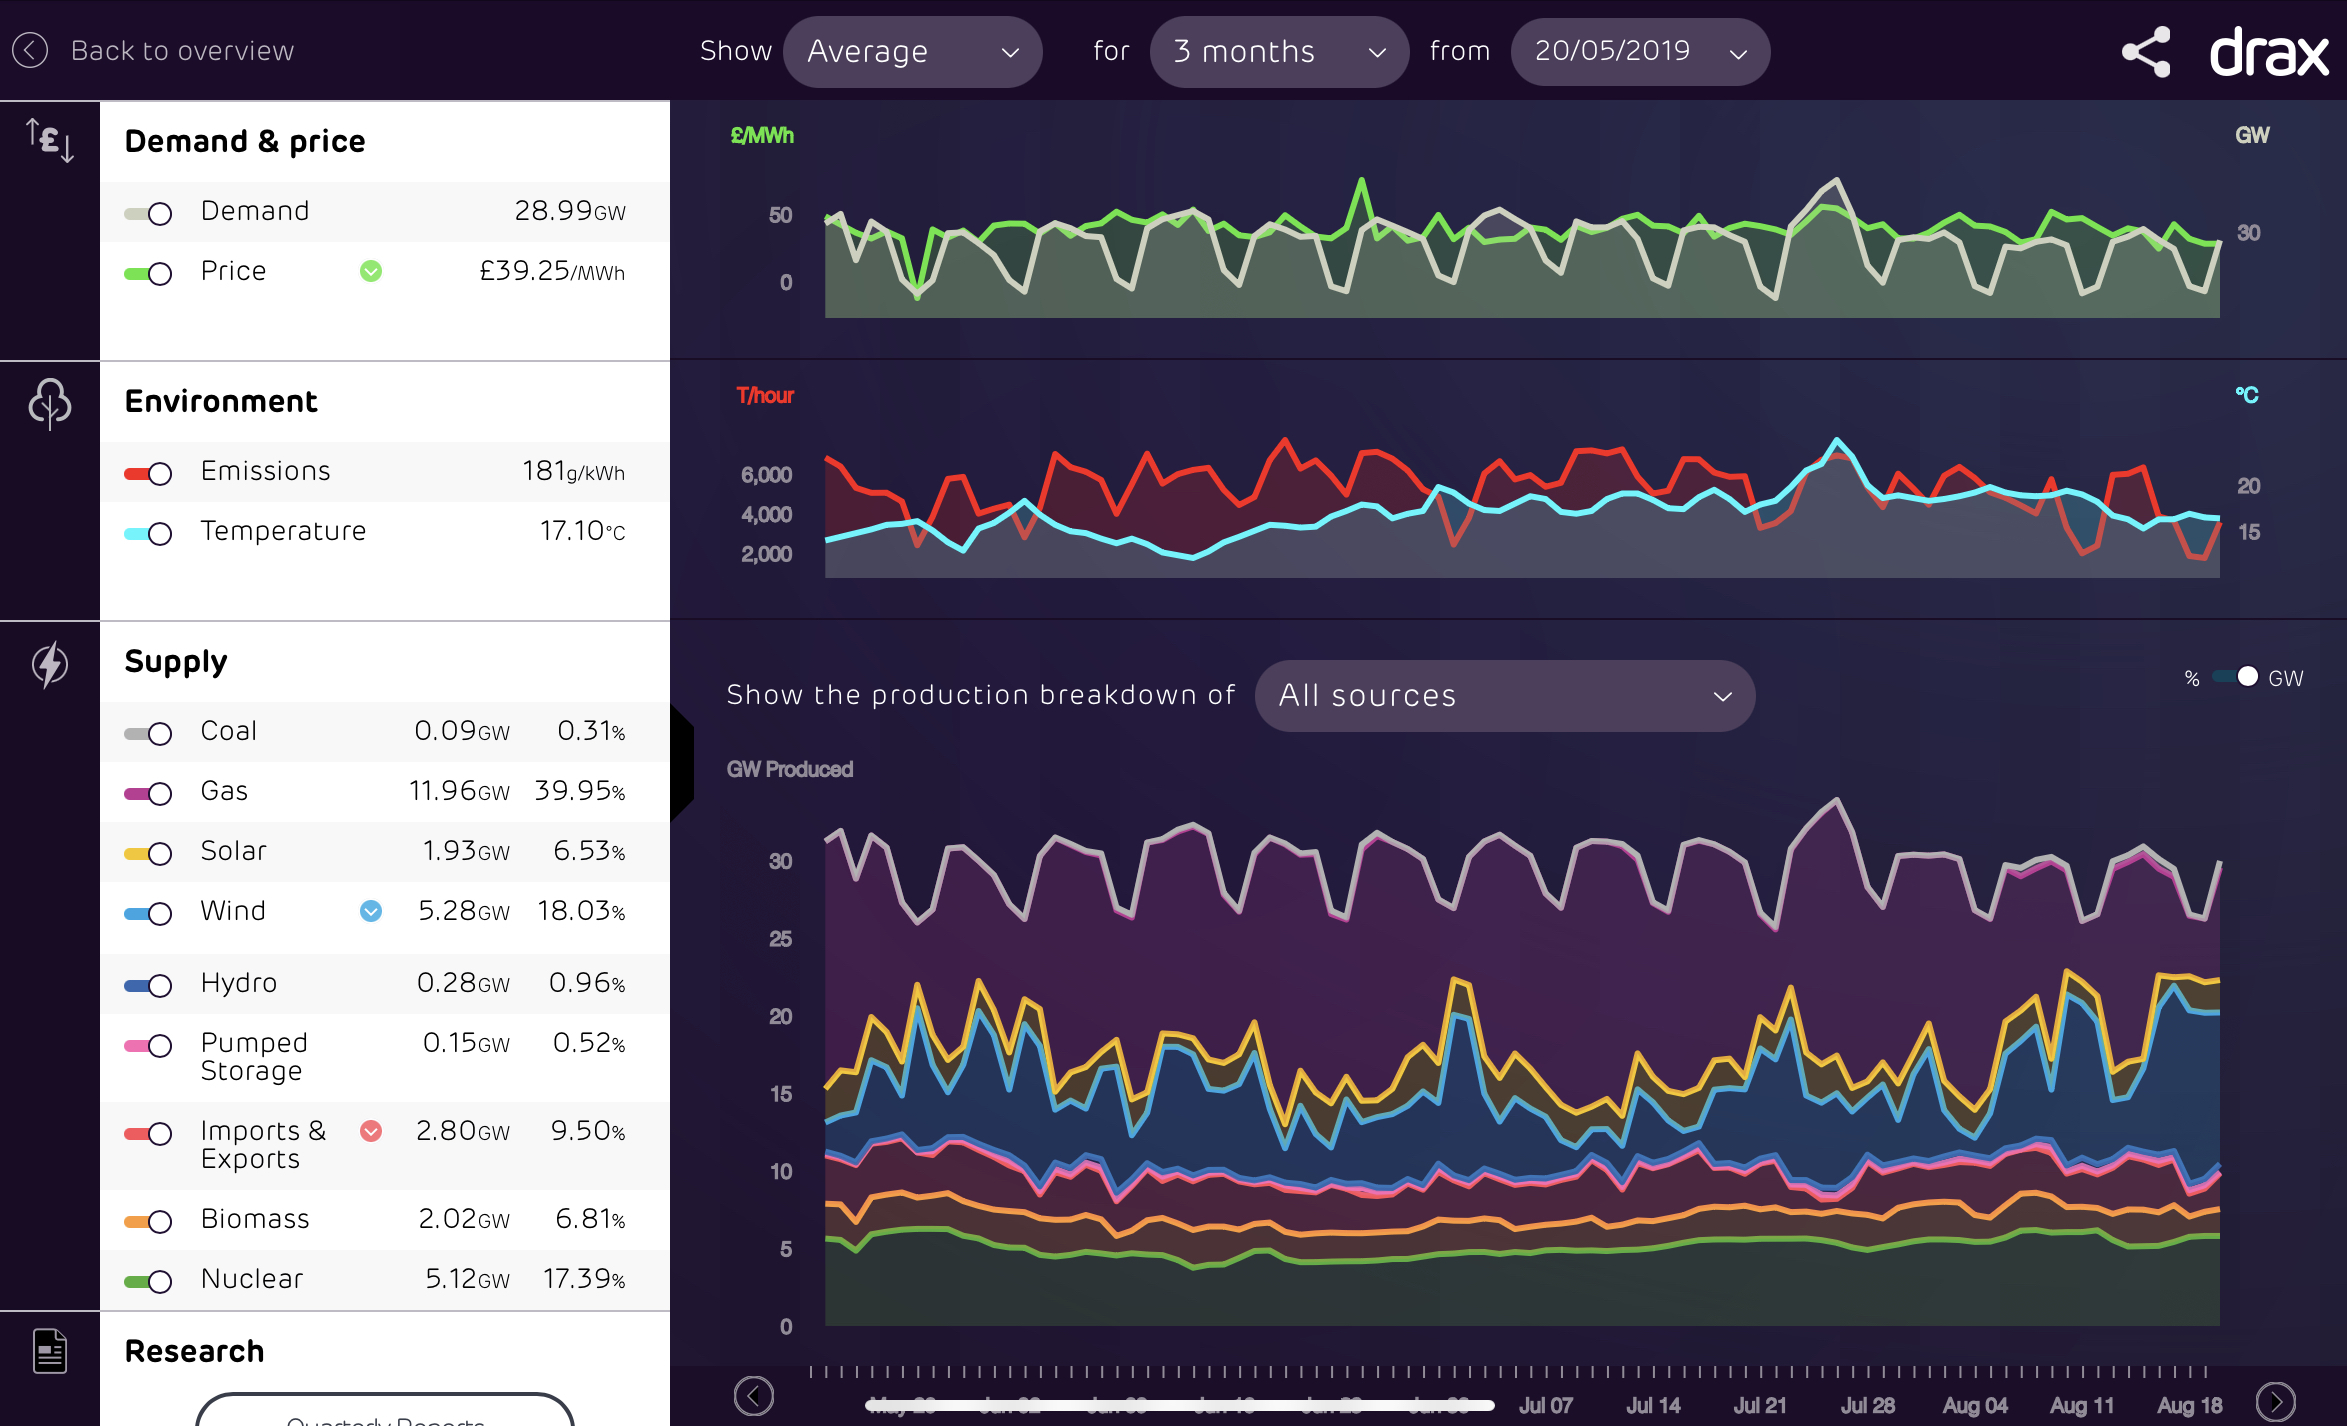
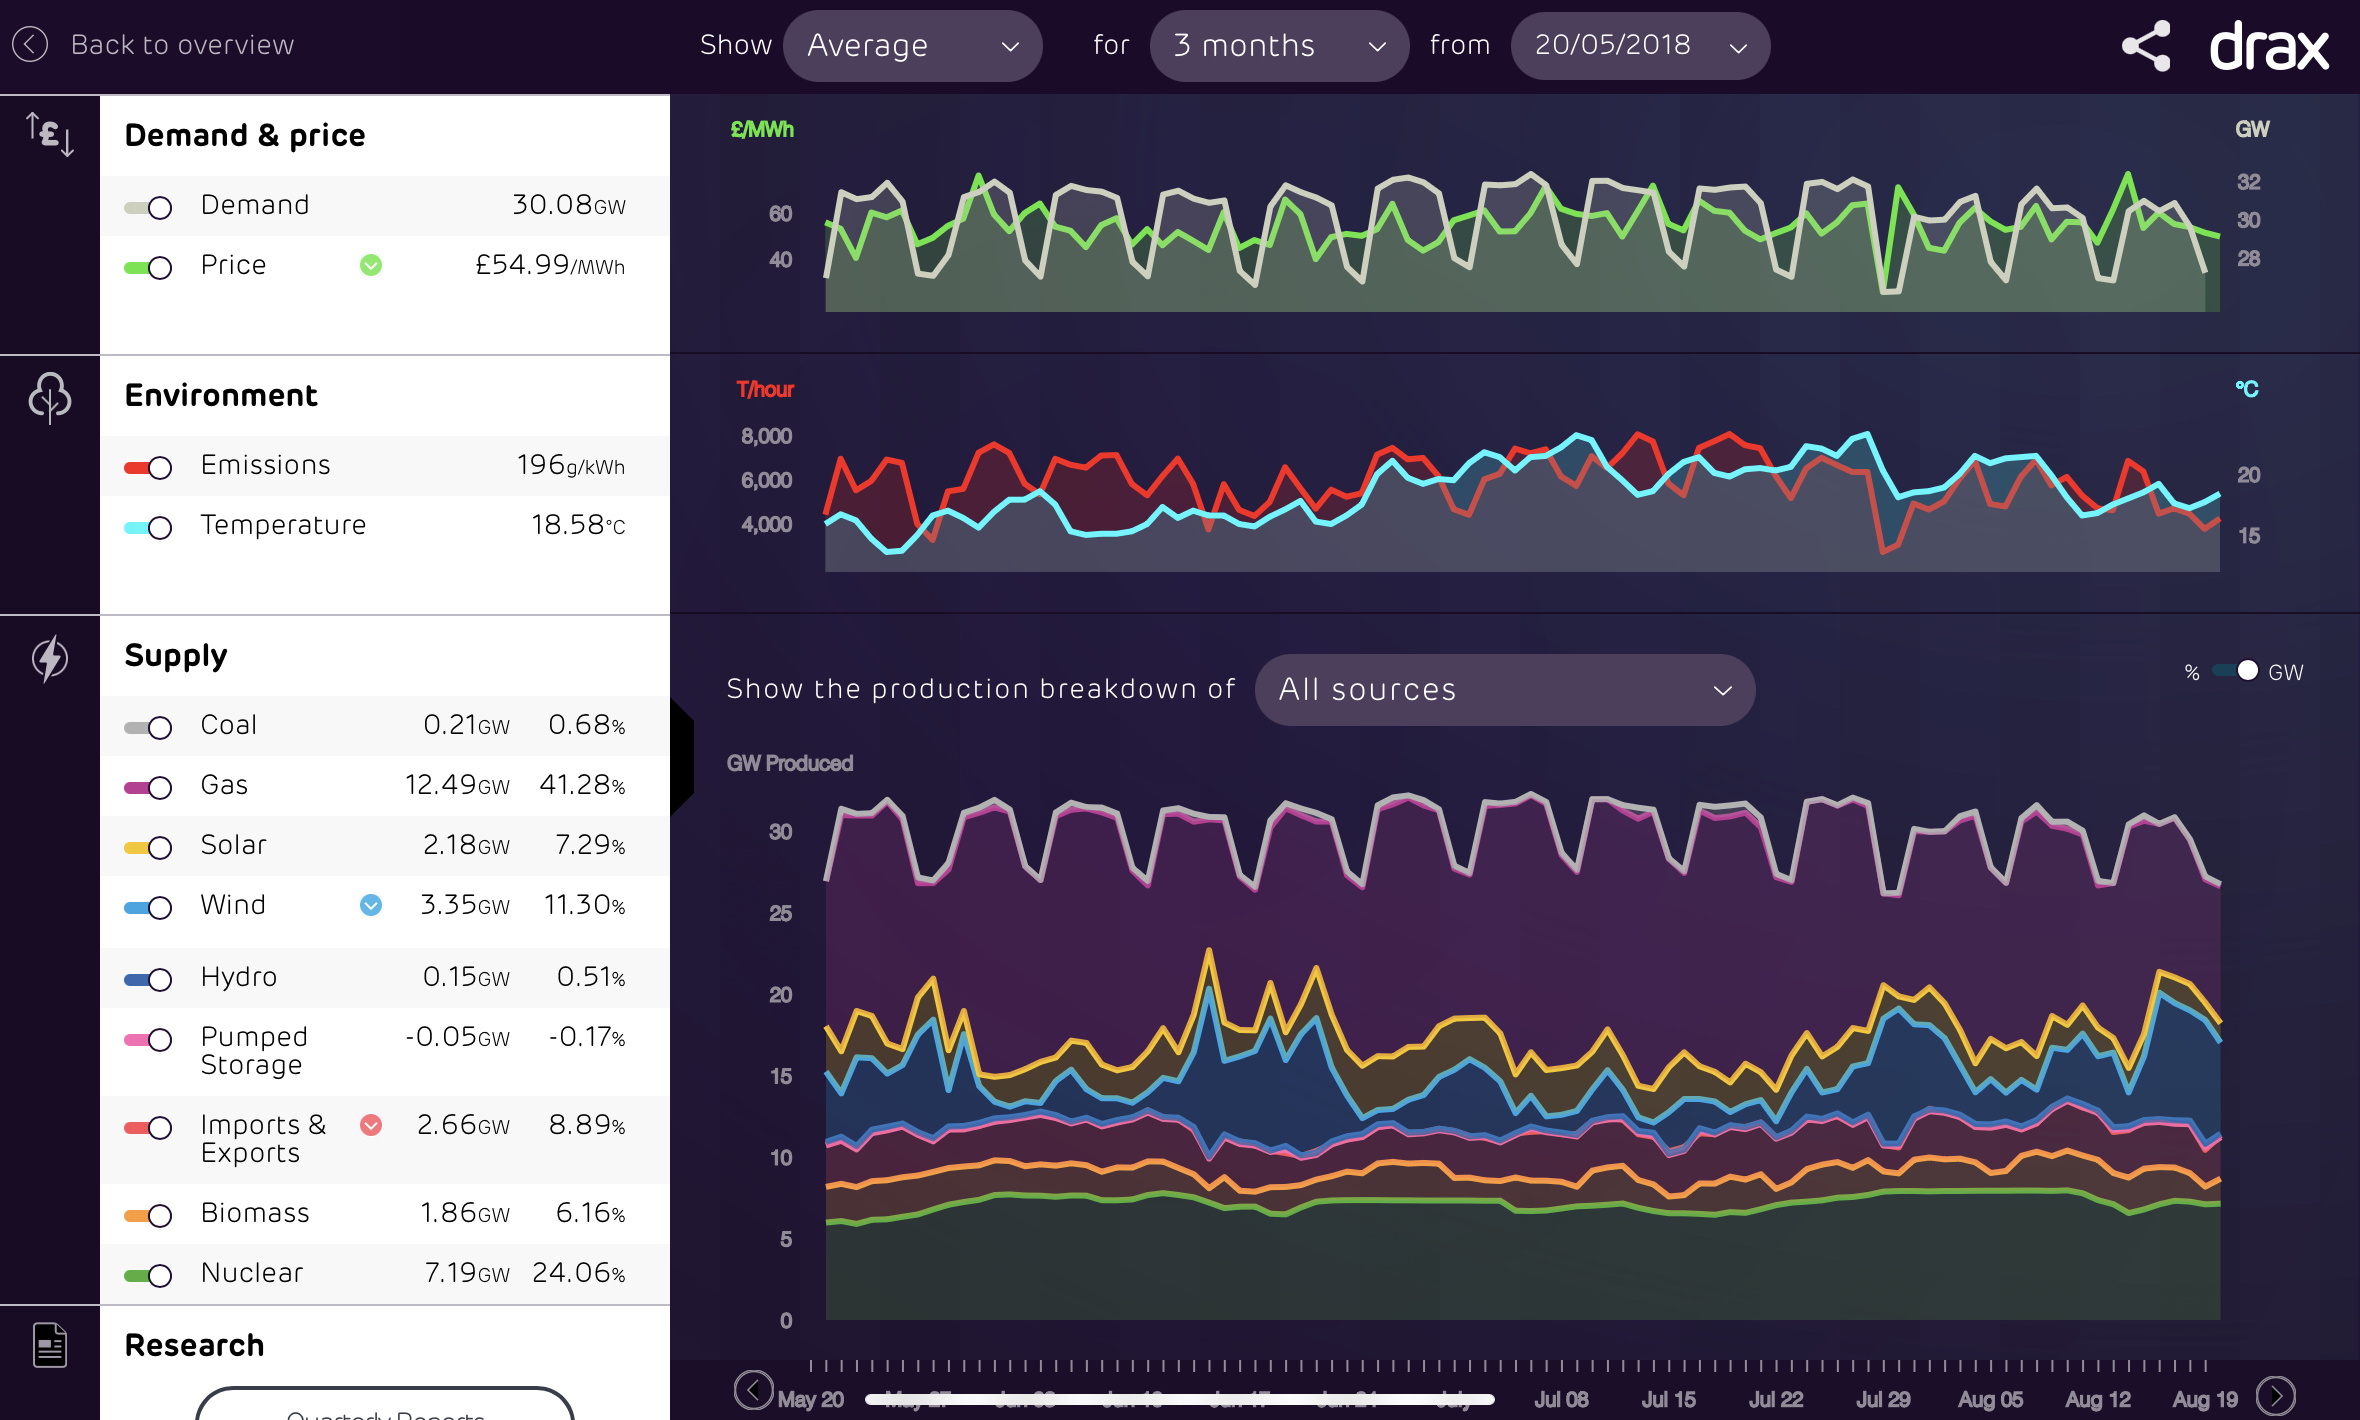
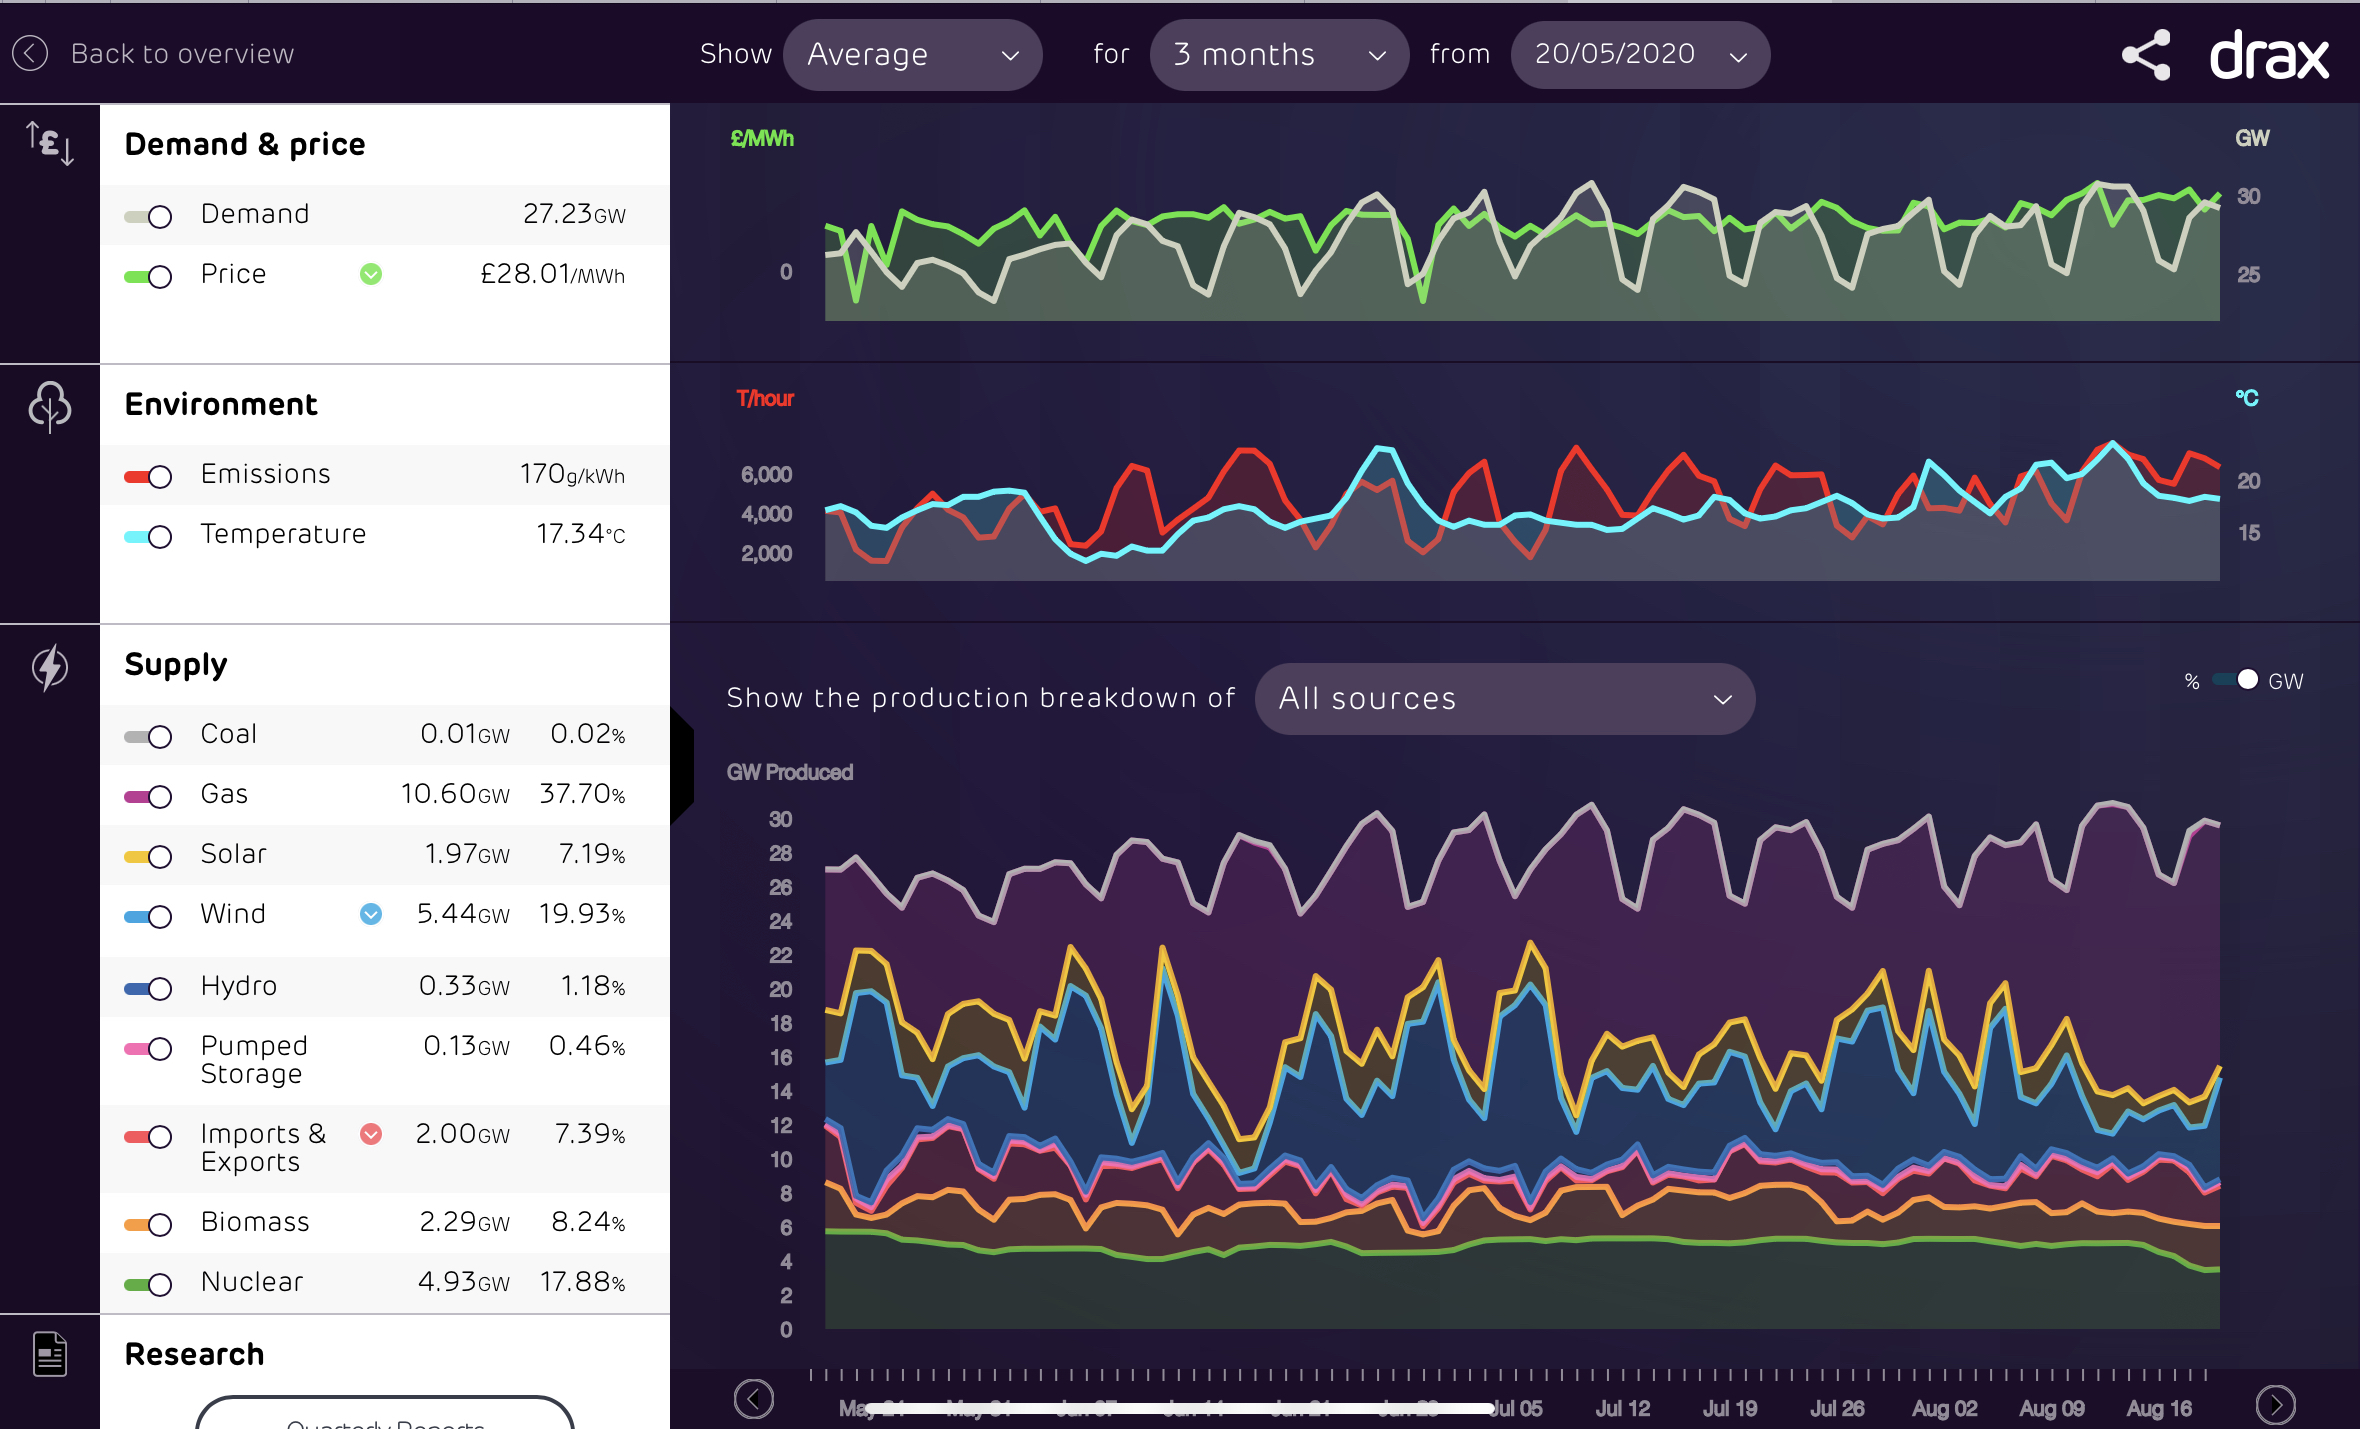
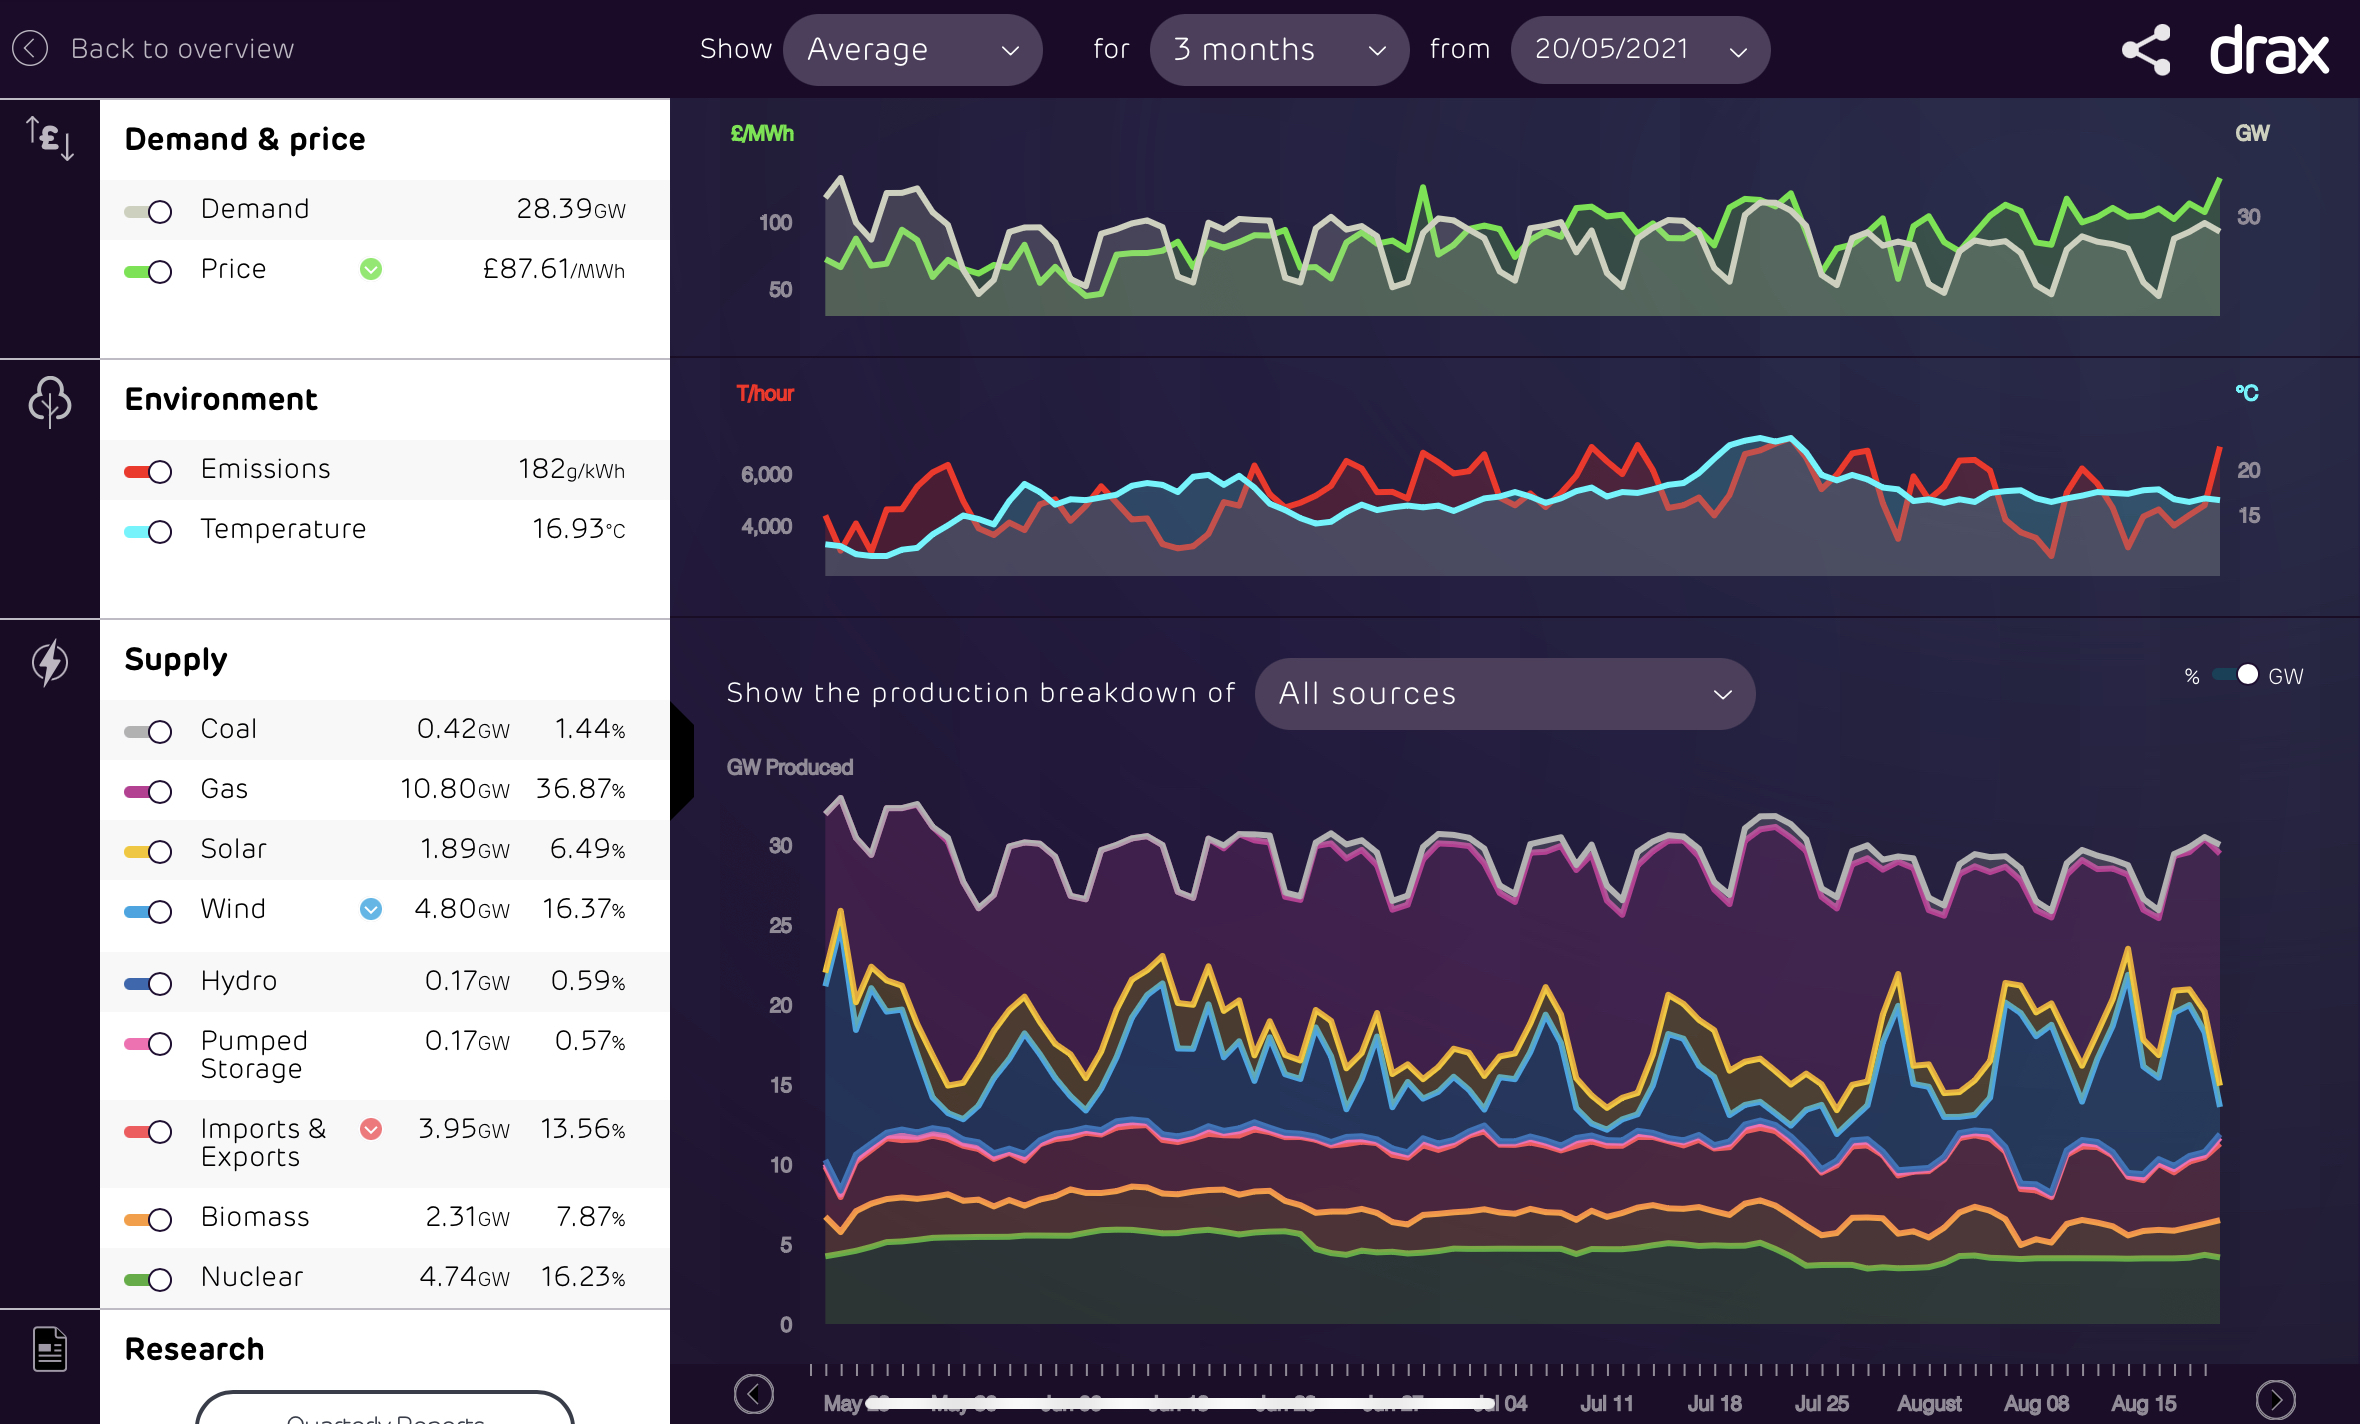
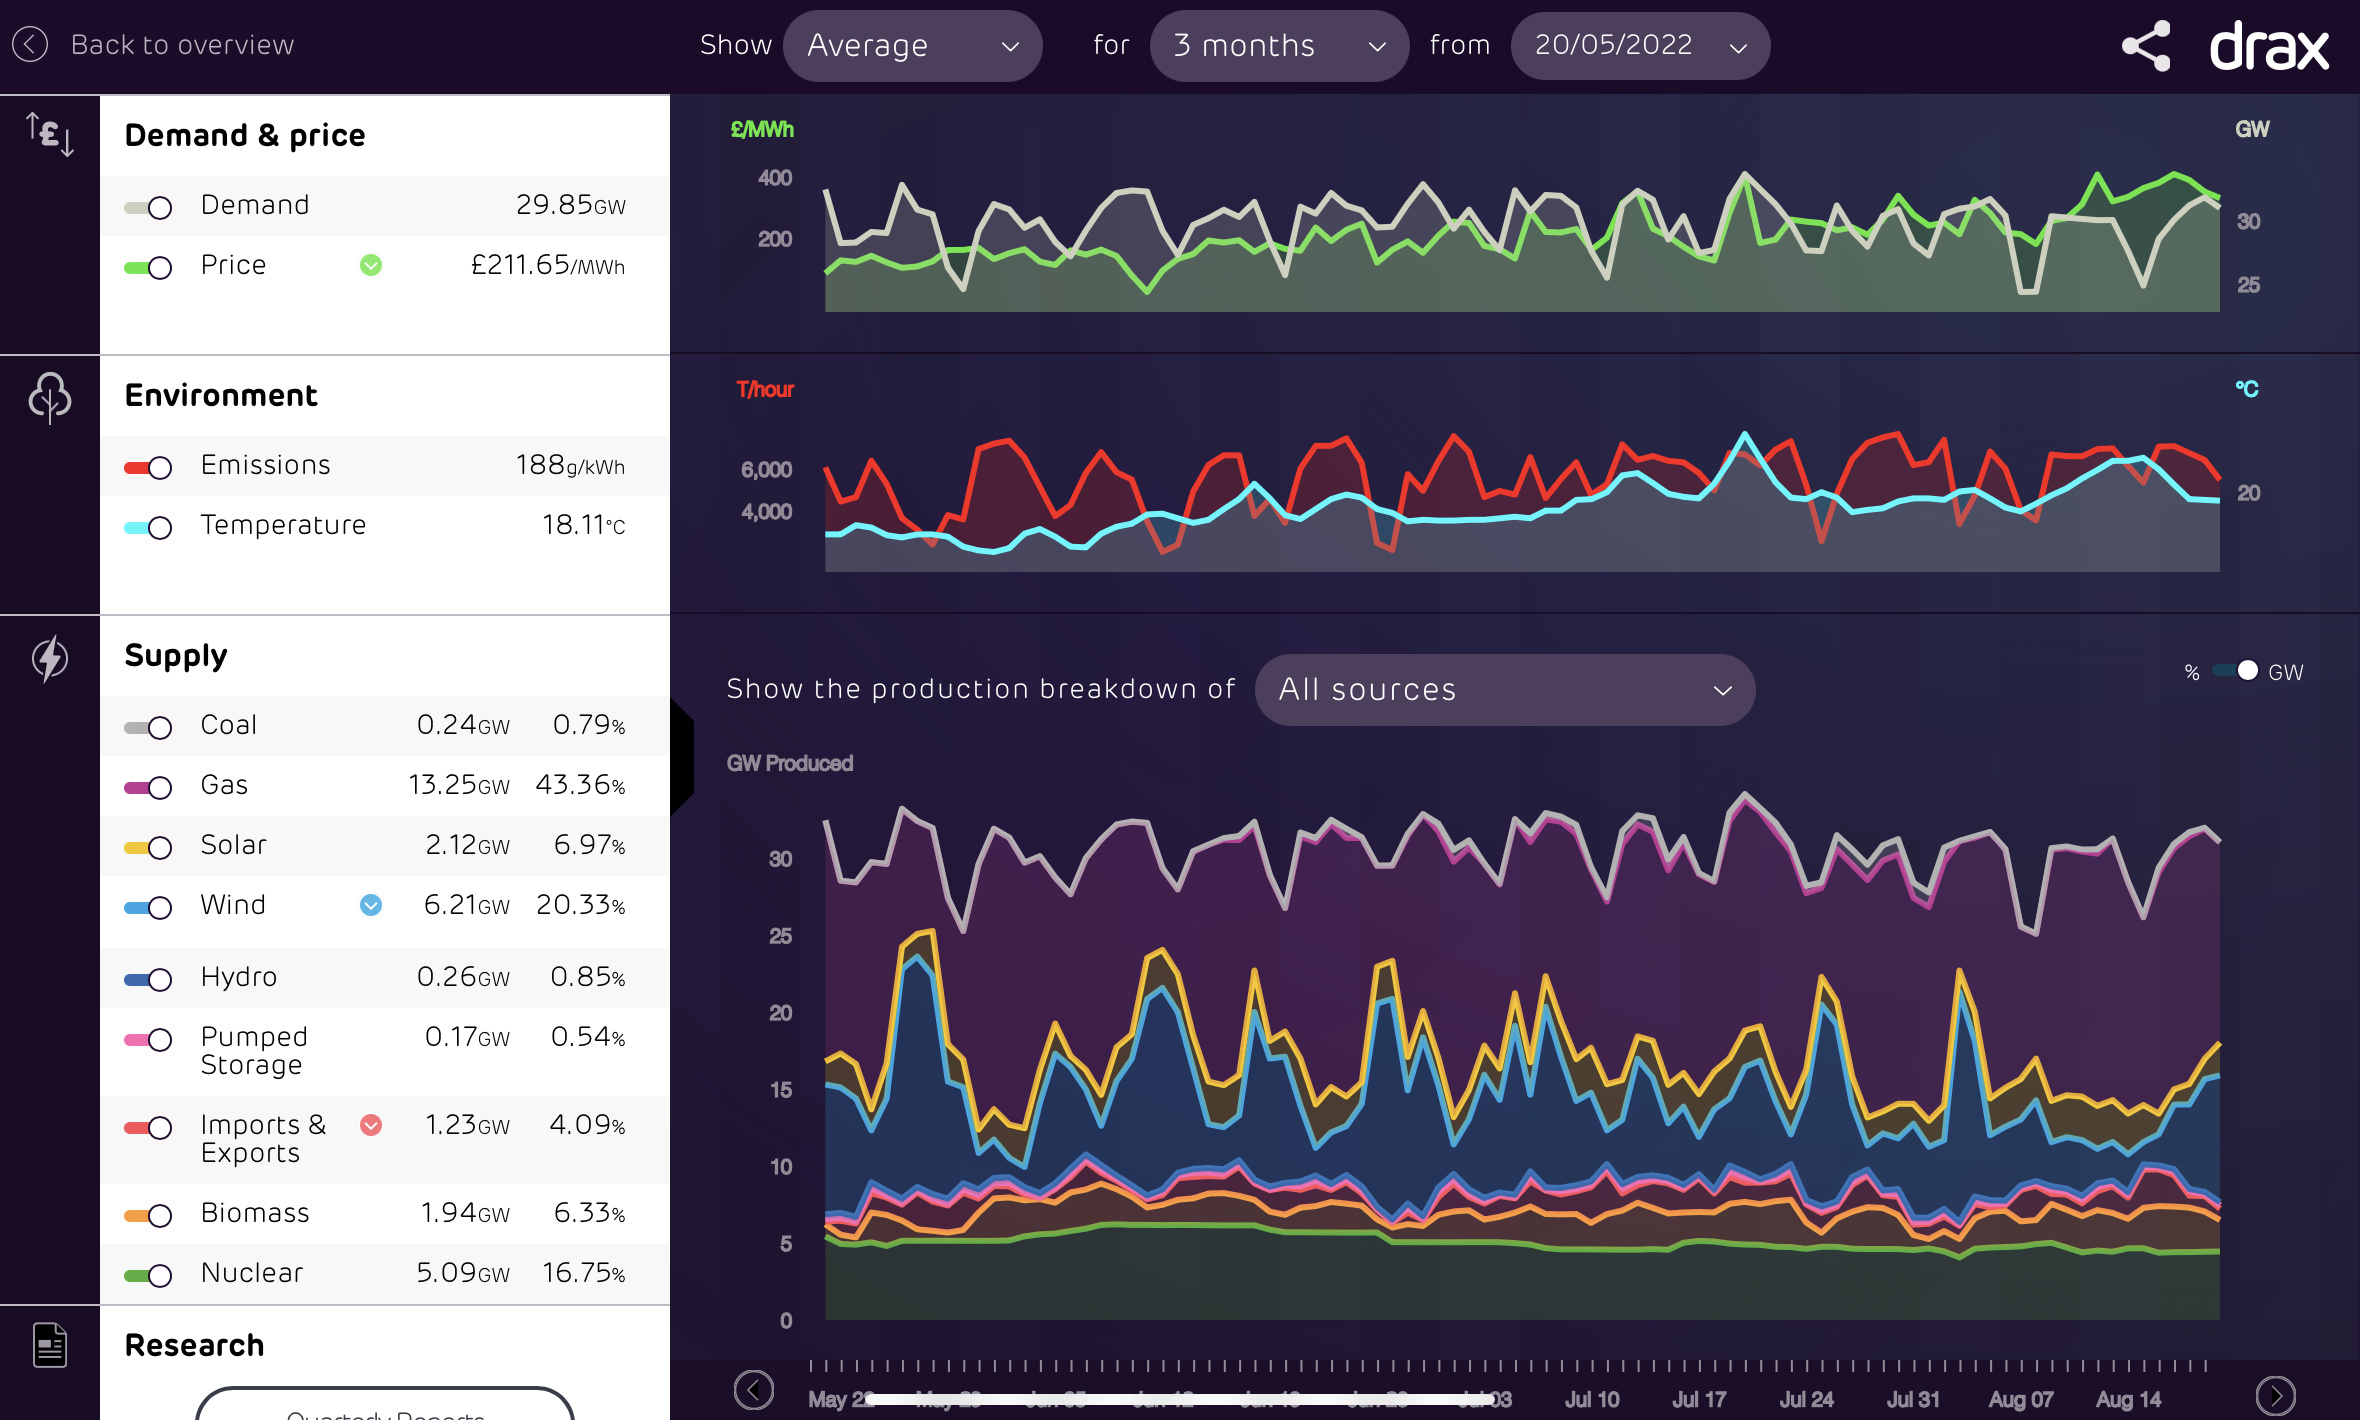
Are these figures for each year 3 months to the end of July? Just wondering if they are comparing like with like?JKenH said:I was just looking at the very low CO2 emissions figures (looked at in g/kWh terms, not overall, throughout this post) for the last 3 months on the Electric Insights website and compared them with previous 9 years. There has been a significant increase in the % of our electricity generated from wind/solar but is this the reason for the fall in emissions?What I noticed was that the correlation between demand and emissions from 2017 appeared stronger than the inverse correlation between emissions and wind/solar generation. Demand this summer has been particularly low even compared to 2020 and the emissions significantly lower. In 2022 although the % generated from wind and solar rose significantly, emissions (in g/kWh terms) also rose as demand was higher.
There were significant reductions in emissions prior to 2017 but these I suspect were due to the switch from coal to gas but since 2917 the rate of improvement has slowed (until the last 3 months). What concerns me, is that despite our increasing the proportion of our generation from wind and solar in the future, if overall demand rises (from EVs and Heat pumps) will we may see generation CO2 emissions rise, not just overall but in g/kWh terms. We have picked the low hanging fruit of electricity generation CO2 savings and subsequent Gainsborough in reducing CO2 may be marginal.Unfortunately I don’t have the app on my iPad to convert these statistics into a graph. I am not expecting everyone to agree with this analysis but thought I would put my musings out there.Edit: swapped the reference to inverse over to demand rather than wind/solar as it makes more sense numerically.I think....0
 -
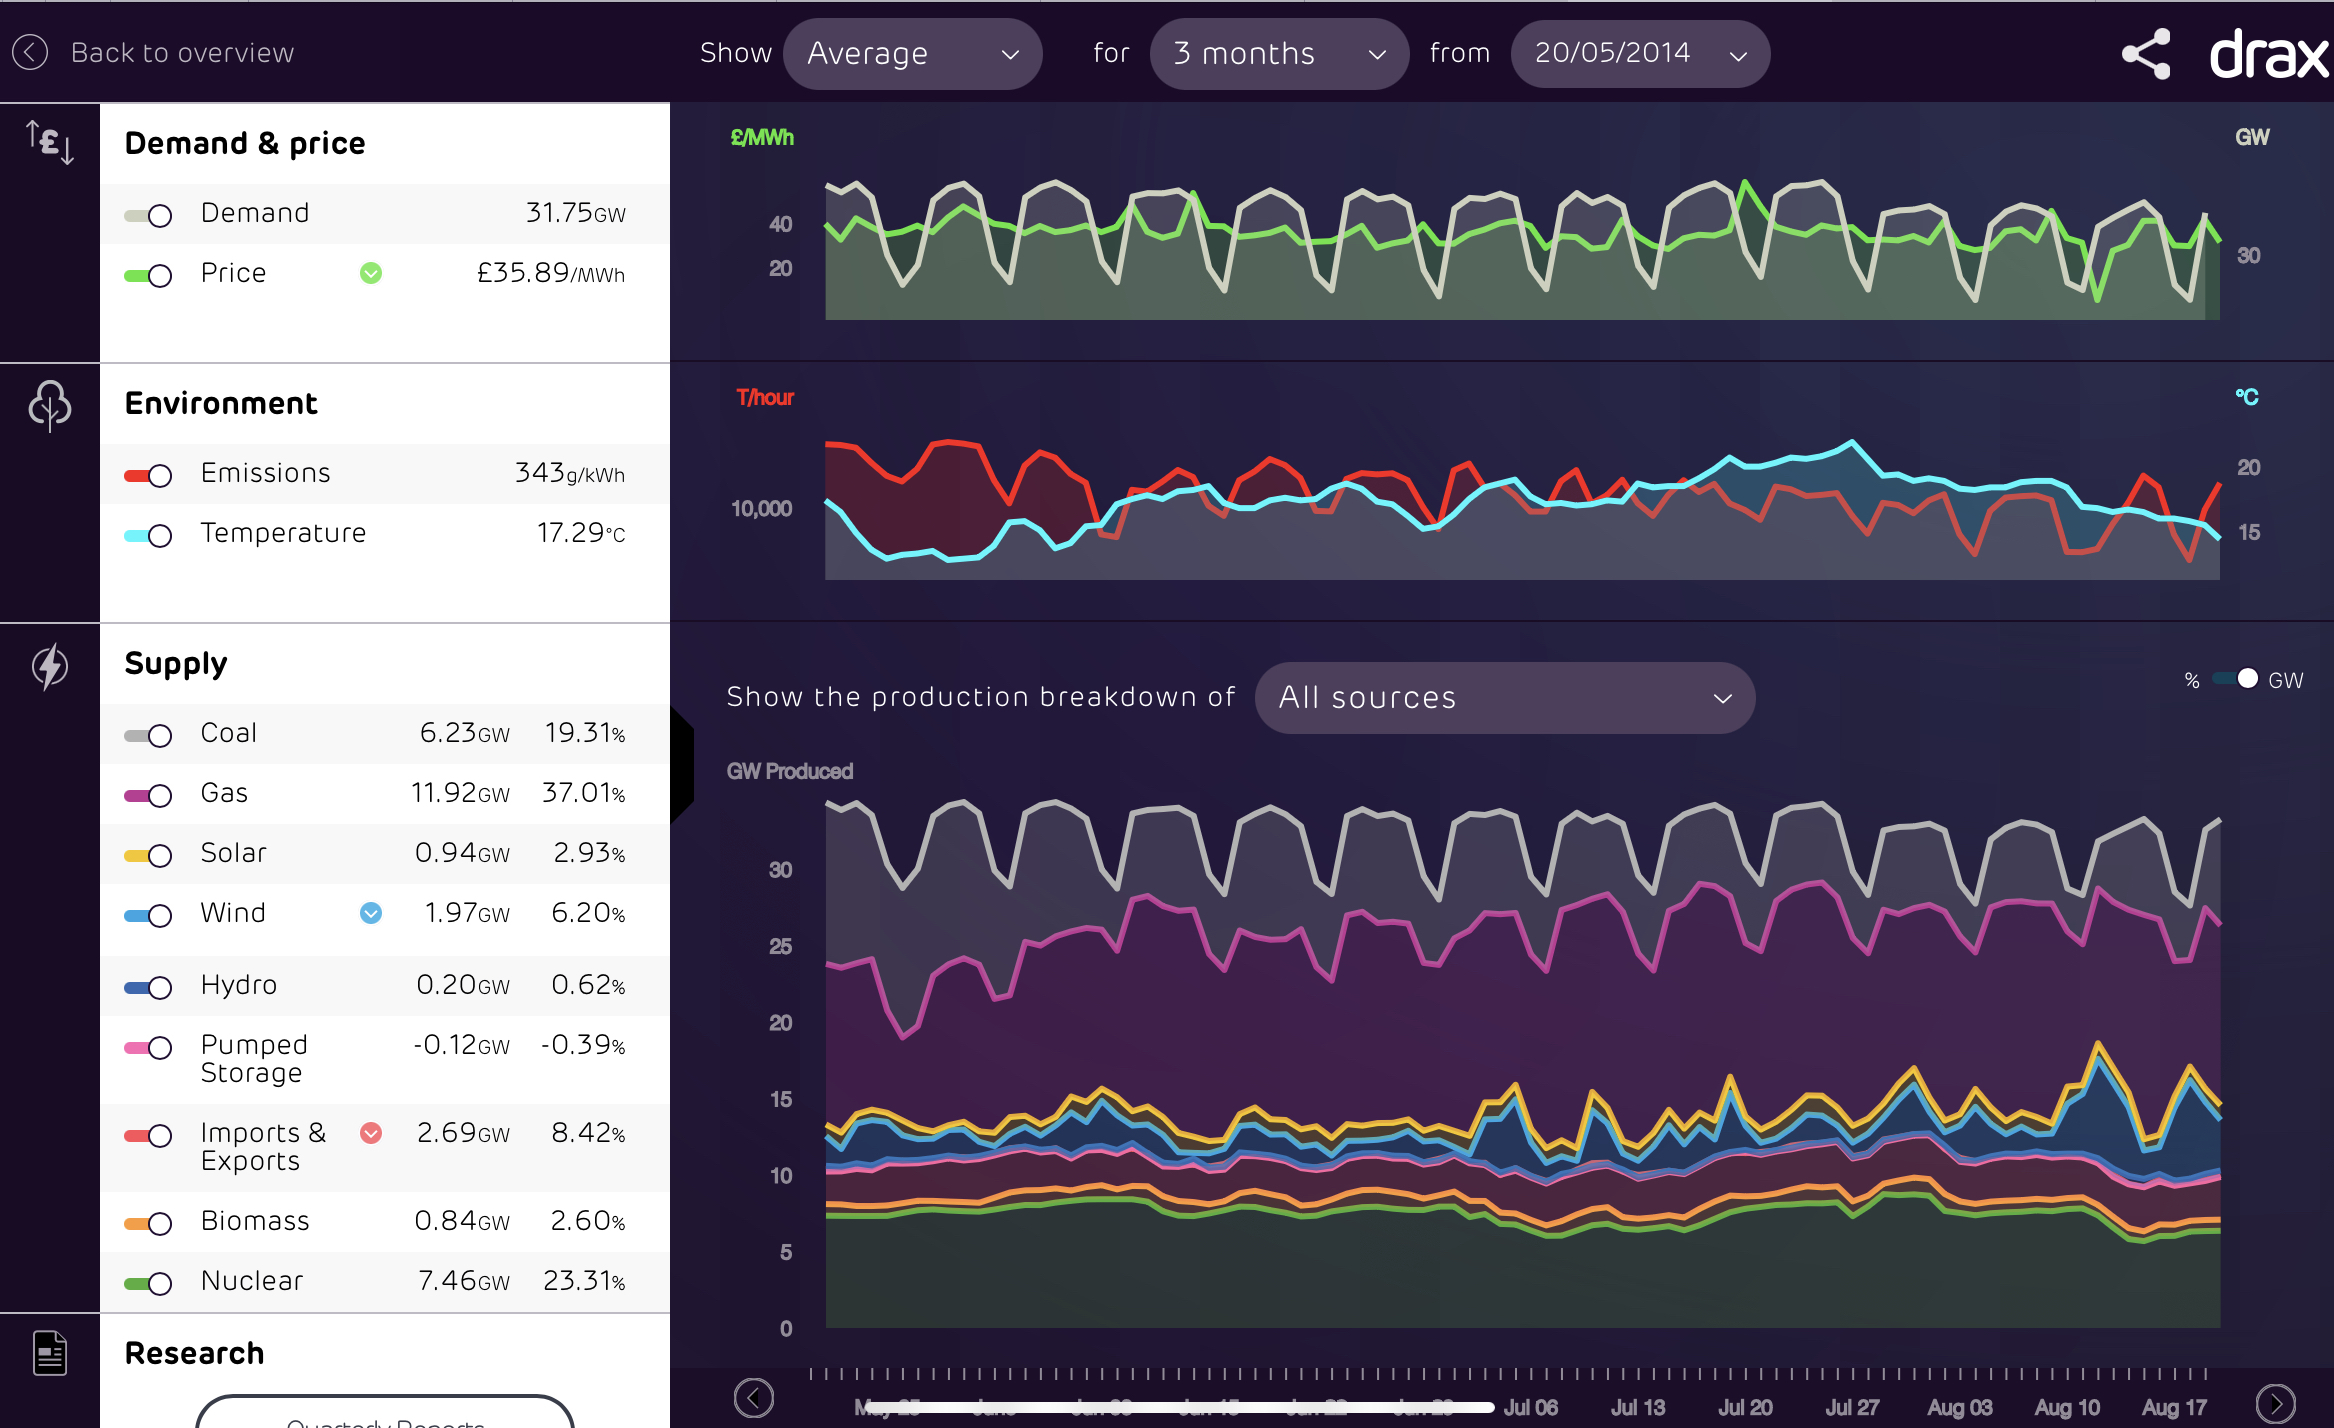
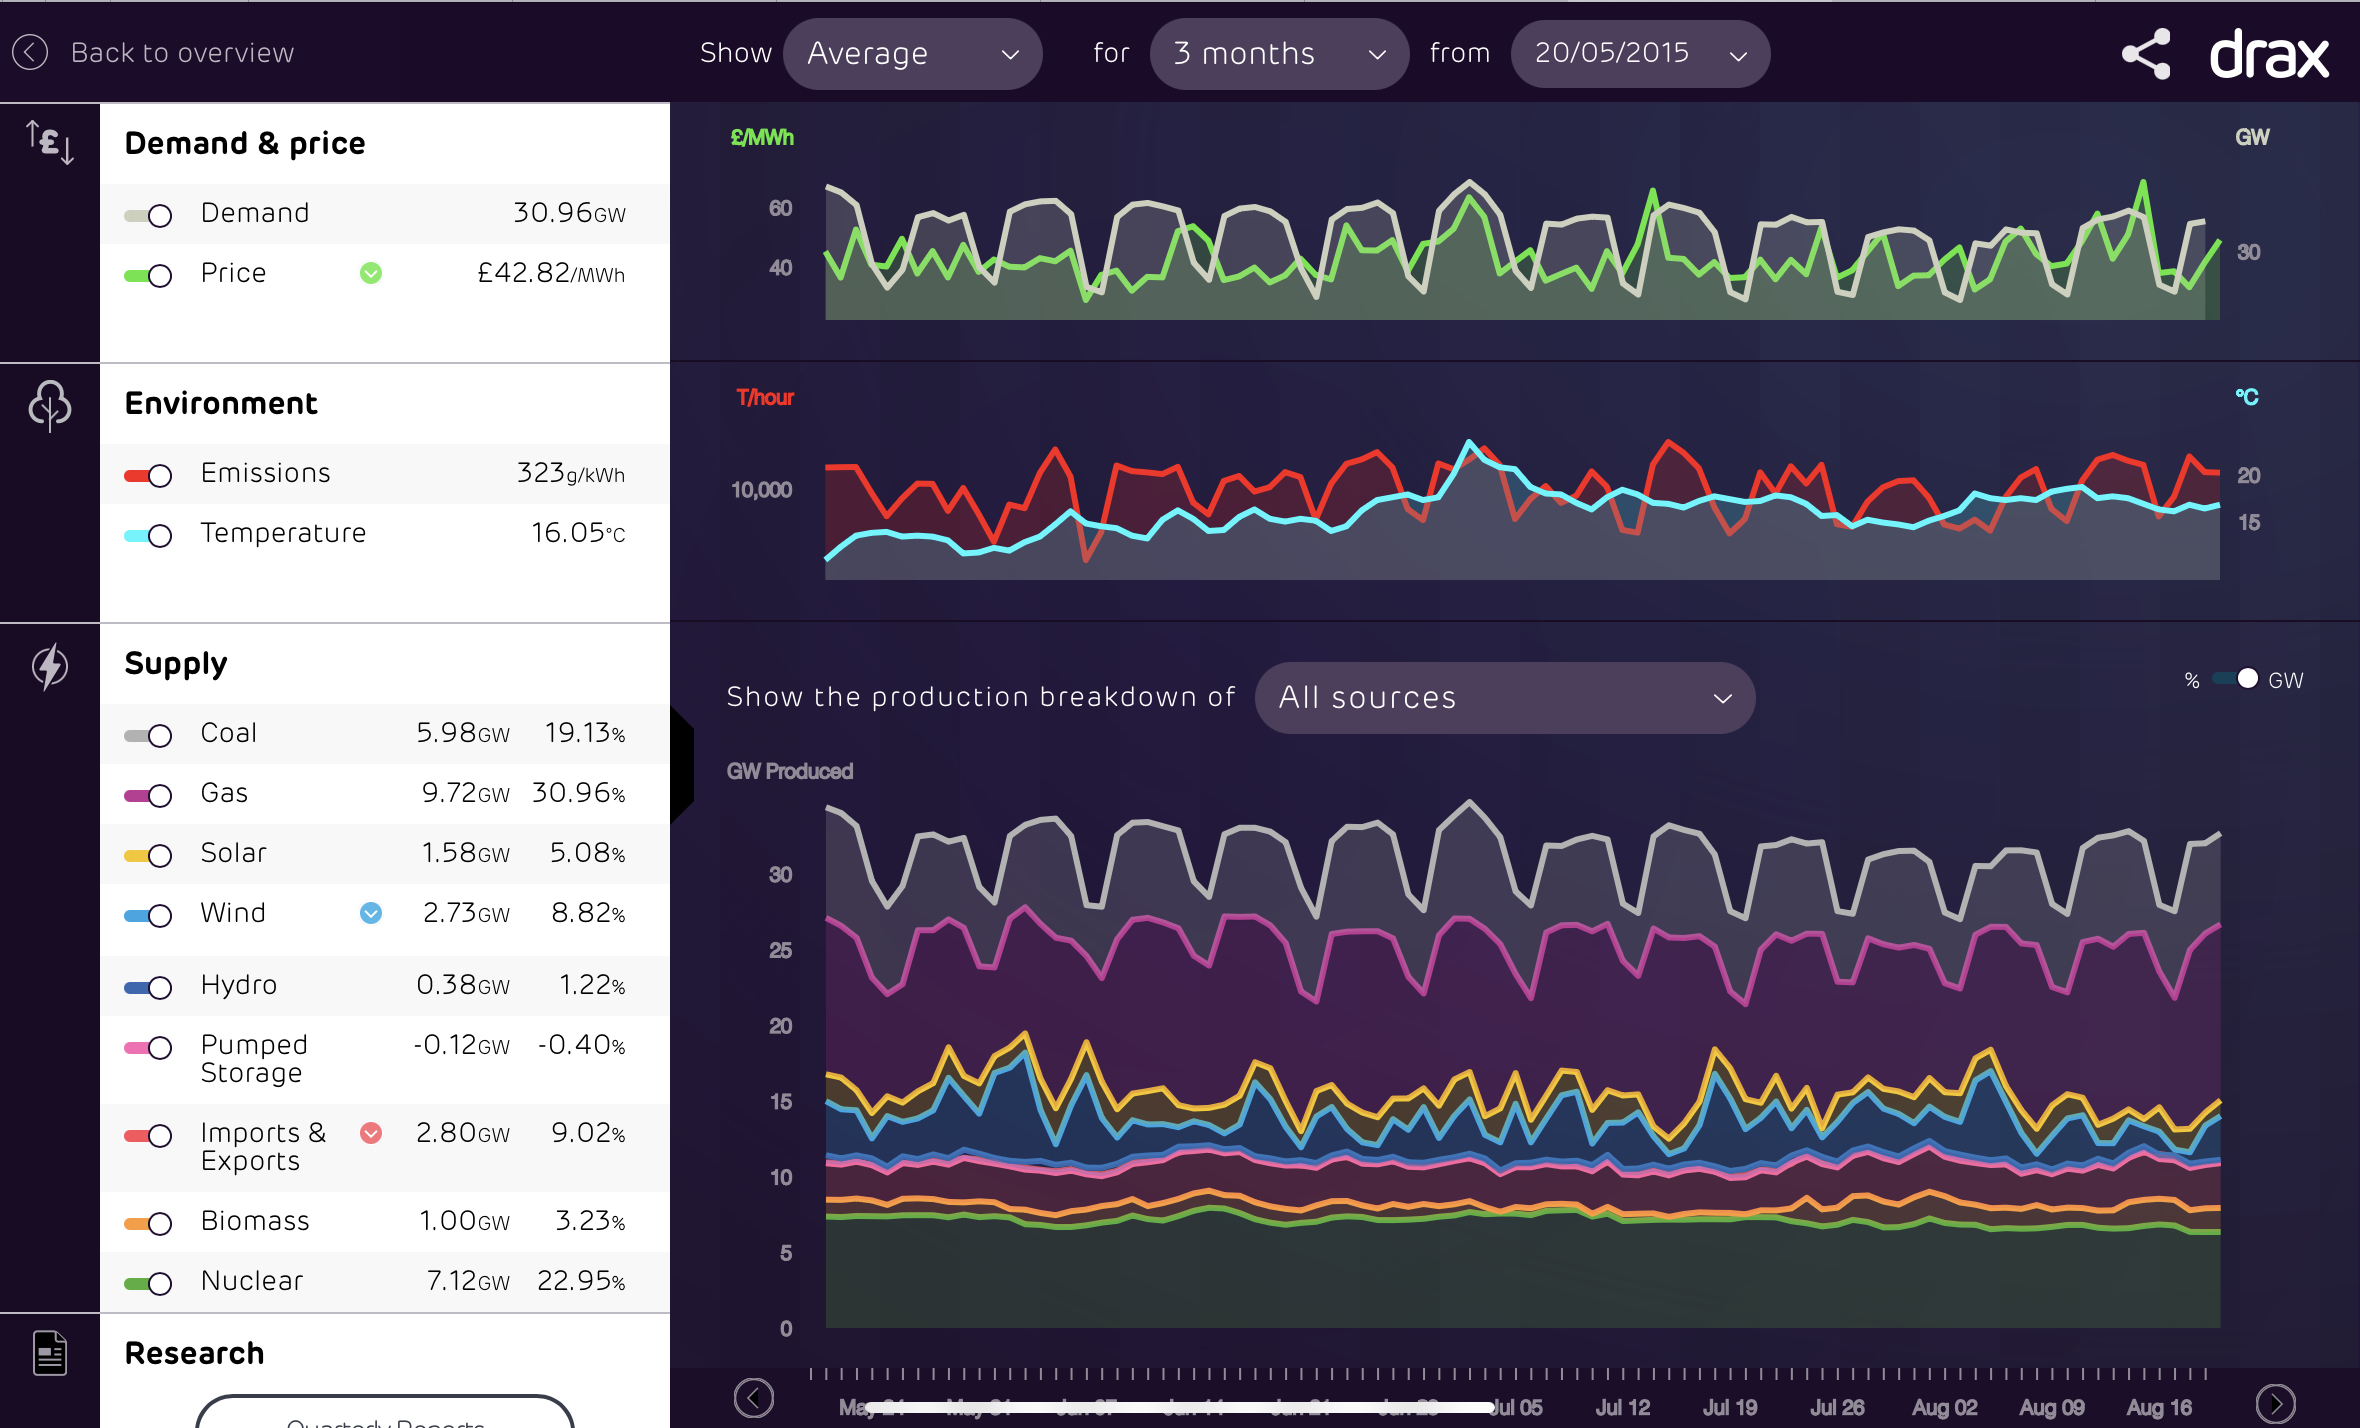
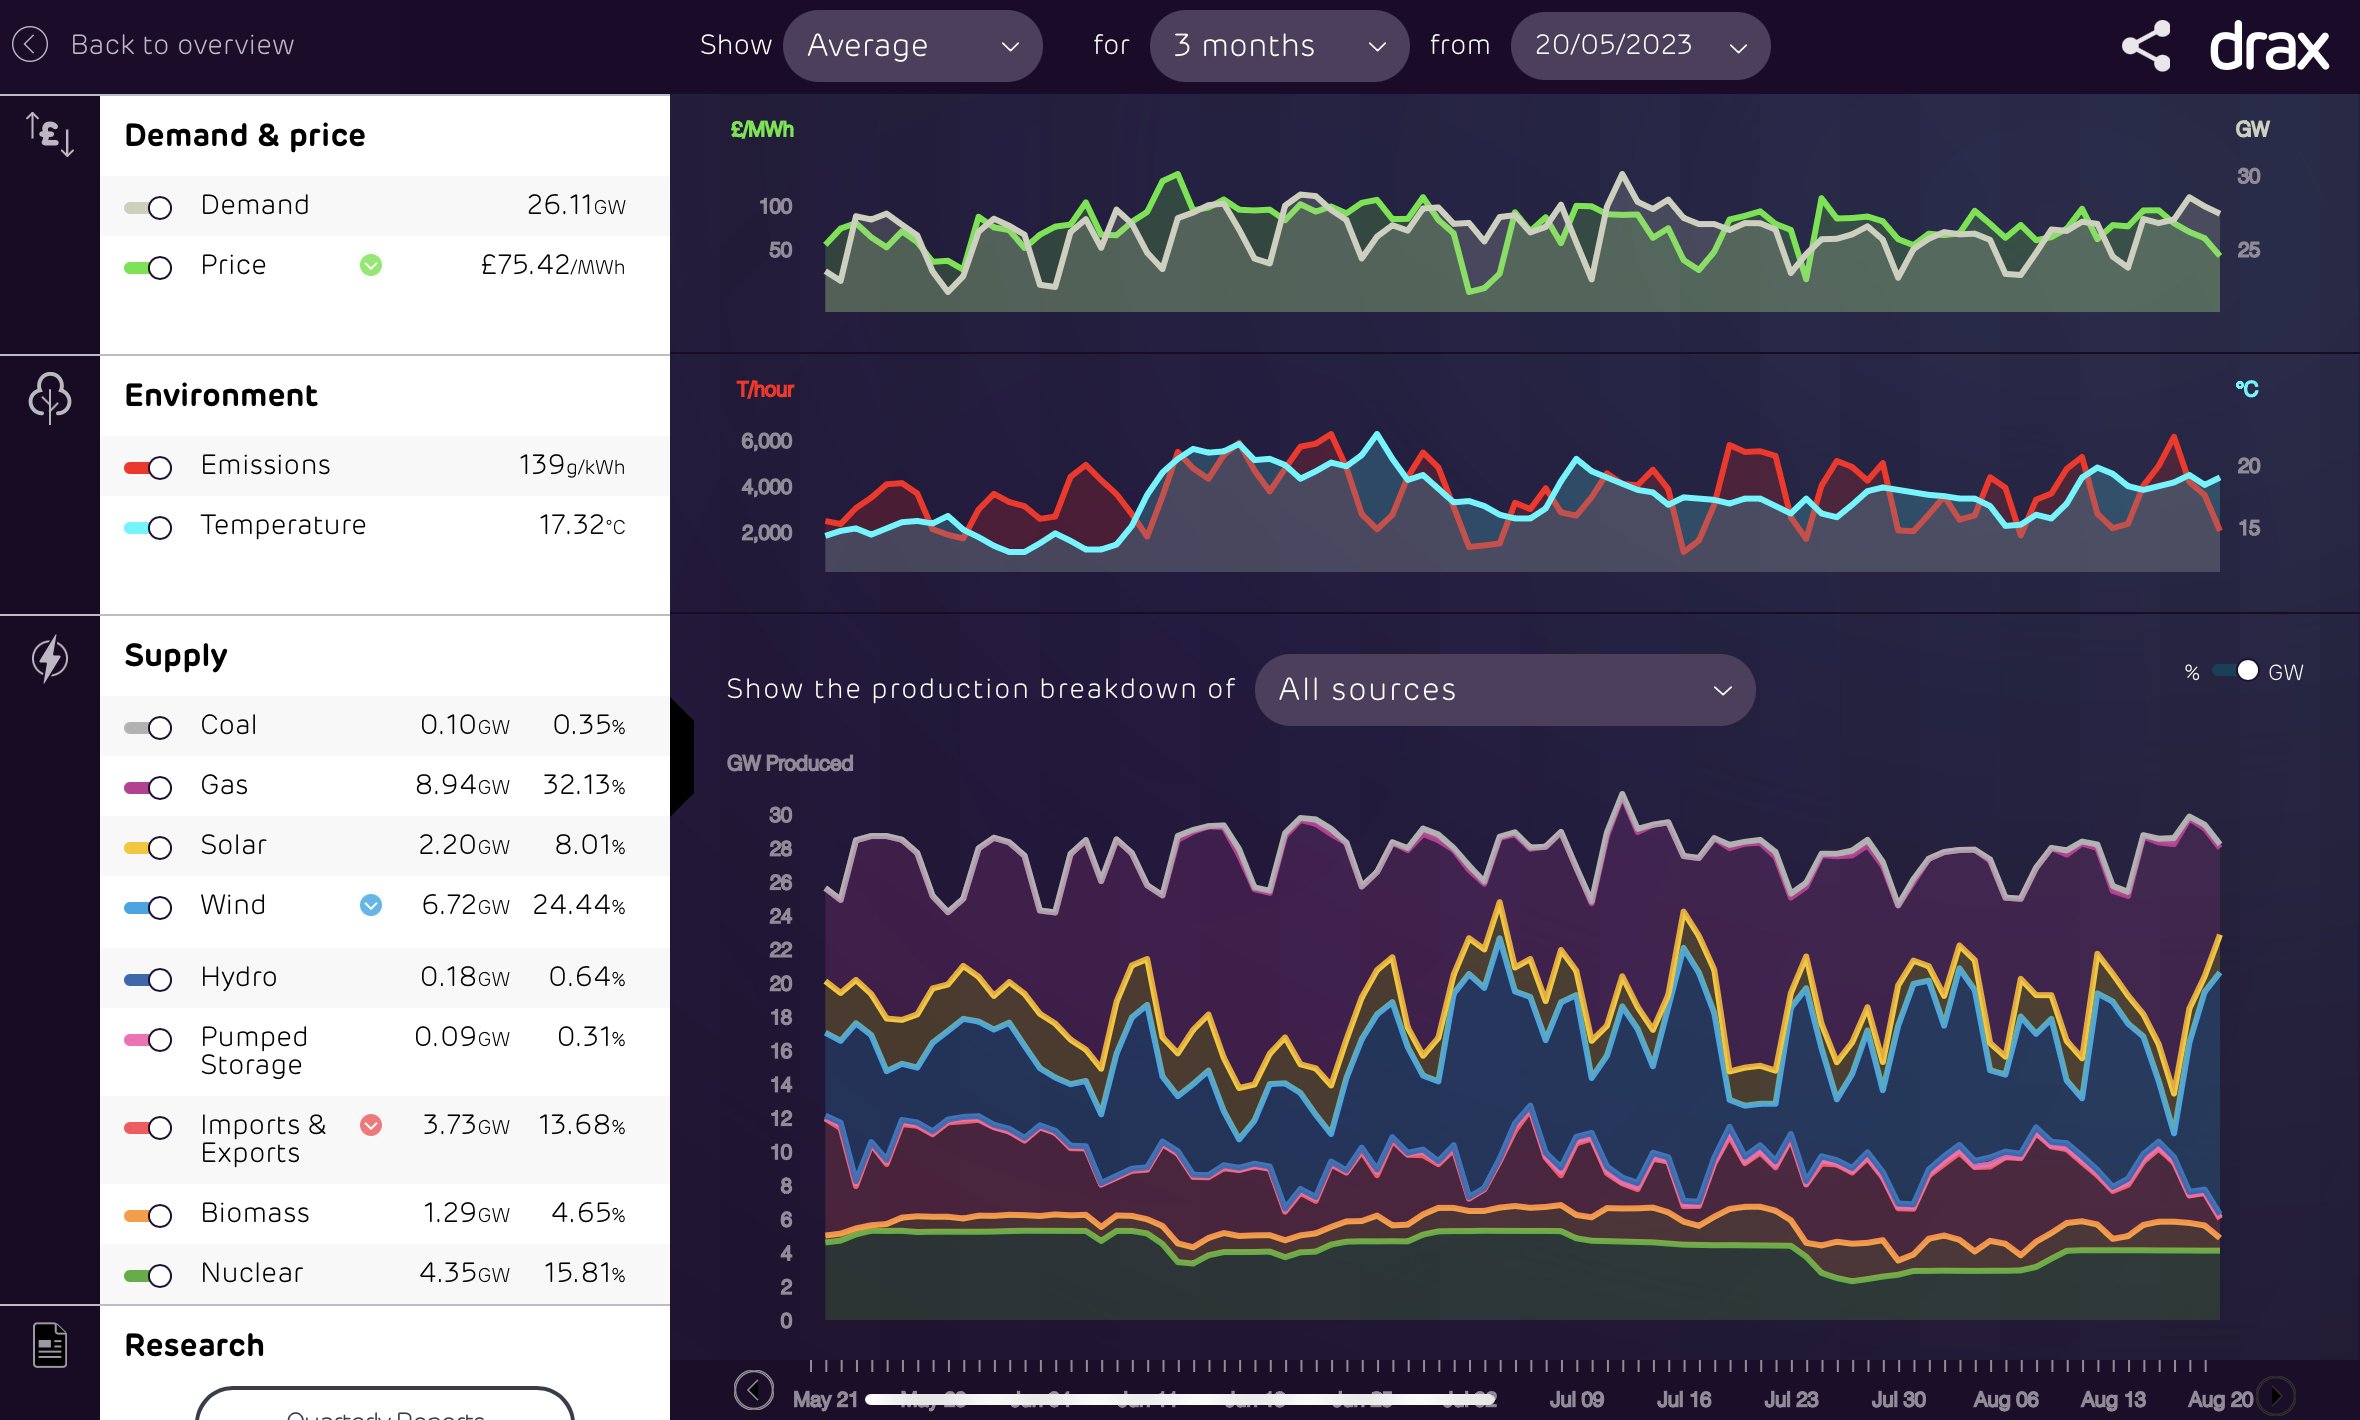
3 months from 20 May to 19 August. Sorry they are not in date order.michaels said:
Are these figures for each year 3 months to the end of July? Just wondering if they are comparing like with like?JKenH said:I was just looking at the very low CO2 emissions figures (looked at in g/kWh terms, not overall, throughout this post) for the last 3 months on the Electric Insights website and compared them with previous 9 years. There has been a significant increase in the % of our electricity generated from wind/solar but is this the reason for the fall in emissions?What I noticed was that the correlation between demand and emissions from 2017 appeared stronger than the inverse correlation between emissions and wind/solar generation. Demand this summer has been particularly low even compared to 2020 and the emissions significantly lower. In 2022 although the % generated from wind and solar rose significantly, emissions (in g/kWh terms) also rose as demand was higher.
There were significant reductions in emissions prior to 2017 but these I suspect were due to the switch from coal to gas but since 2917 the rate of improvement has slowed (until the last 3 months). What concerns me, is that despite our increasing the proportion of our generation from wind and solar in the future, if overall demand rises (from EVs and Heat pumps) will we may see generation CO2 emissions rise, not just overall but in g/kWh terms. We have picked the low hanging fruit of electricity generation CO2 savings and subsequent Gainsborough in reducing CO2 may be marginal.Unfortunately I don’t have the app on my iPad to convert these statistics into a graph.I am not expecting everyone to agree with this analysis but thought I would put my musings out there.Edit: swapped the reference to inverse over to demand rather than wind/solar as it makes more sense numerically.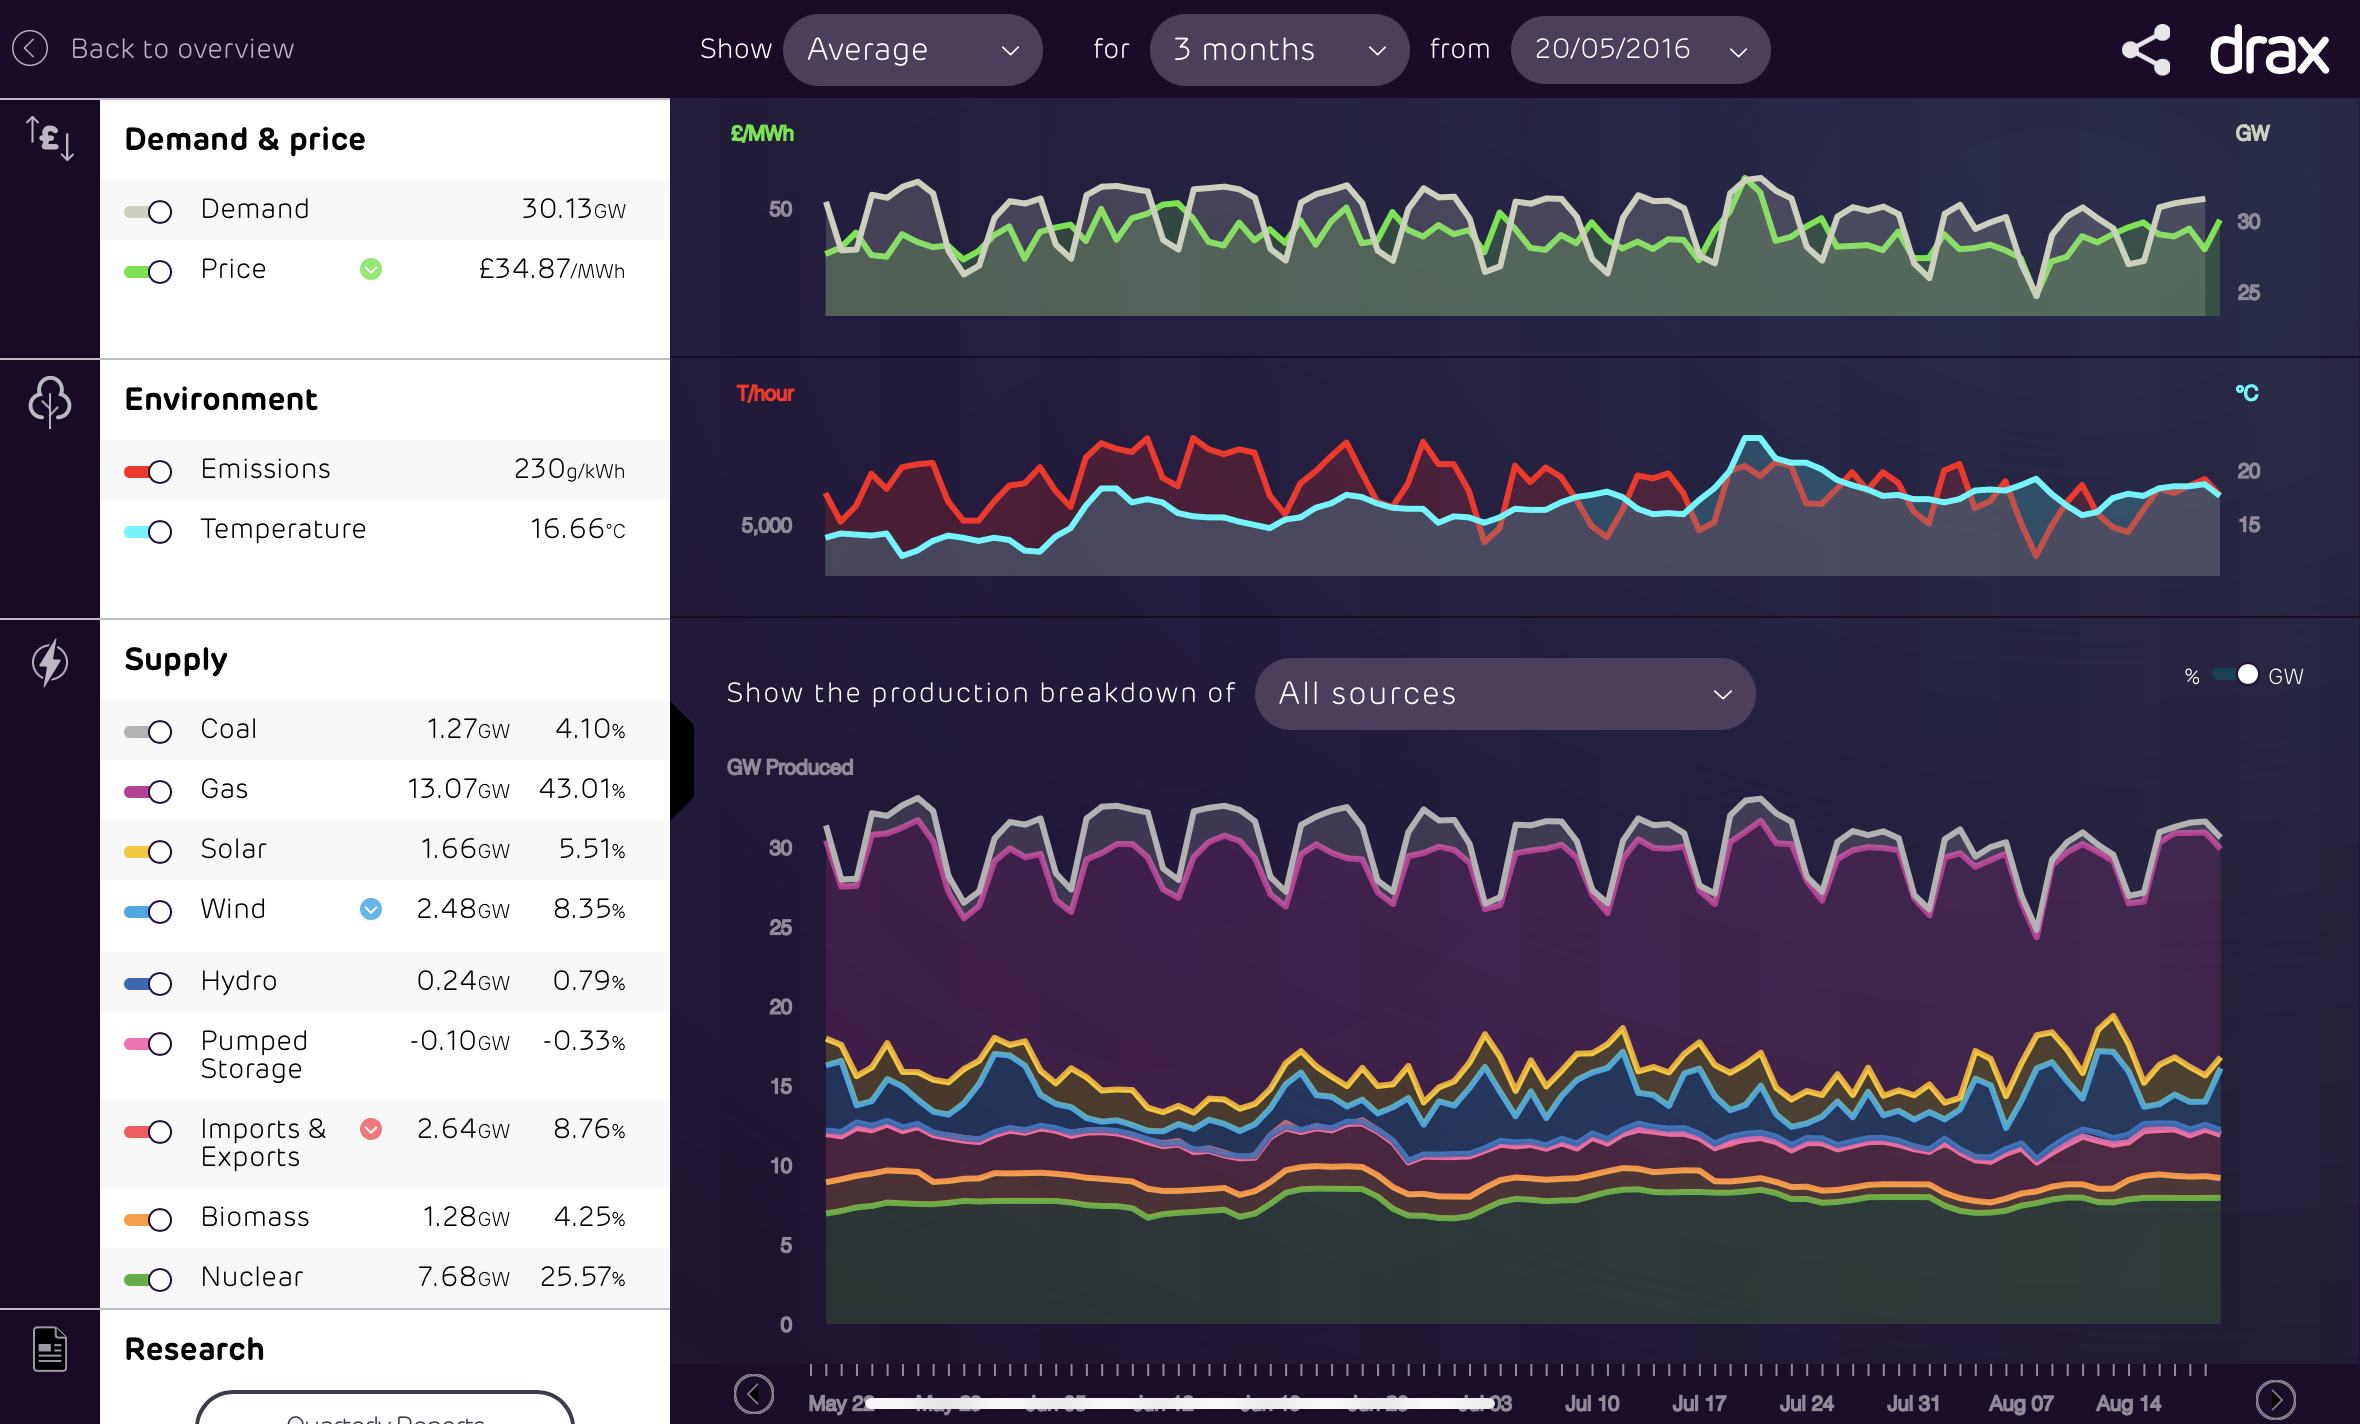
 Northern Lincolnshire. 7.8 kWp system, (4.2 kWwest facing panels , 3.6 kWeast facing), Solis inverters installed 2018, 5kW SSE facing system (shaded in afternoon) added in 2025 with Tesla PW3 battery, Mitsubishi SRK35ZS-S and SRK20ZS-S Wall Mounted A2A Heat Pumps, ex Nissan Leaf owner.1
 -
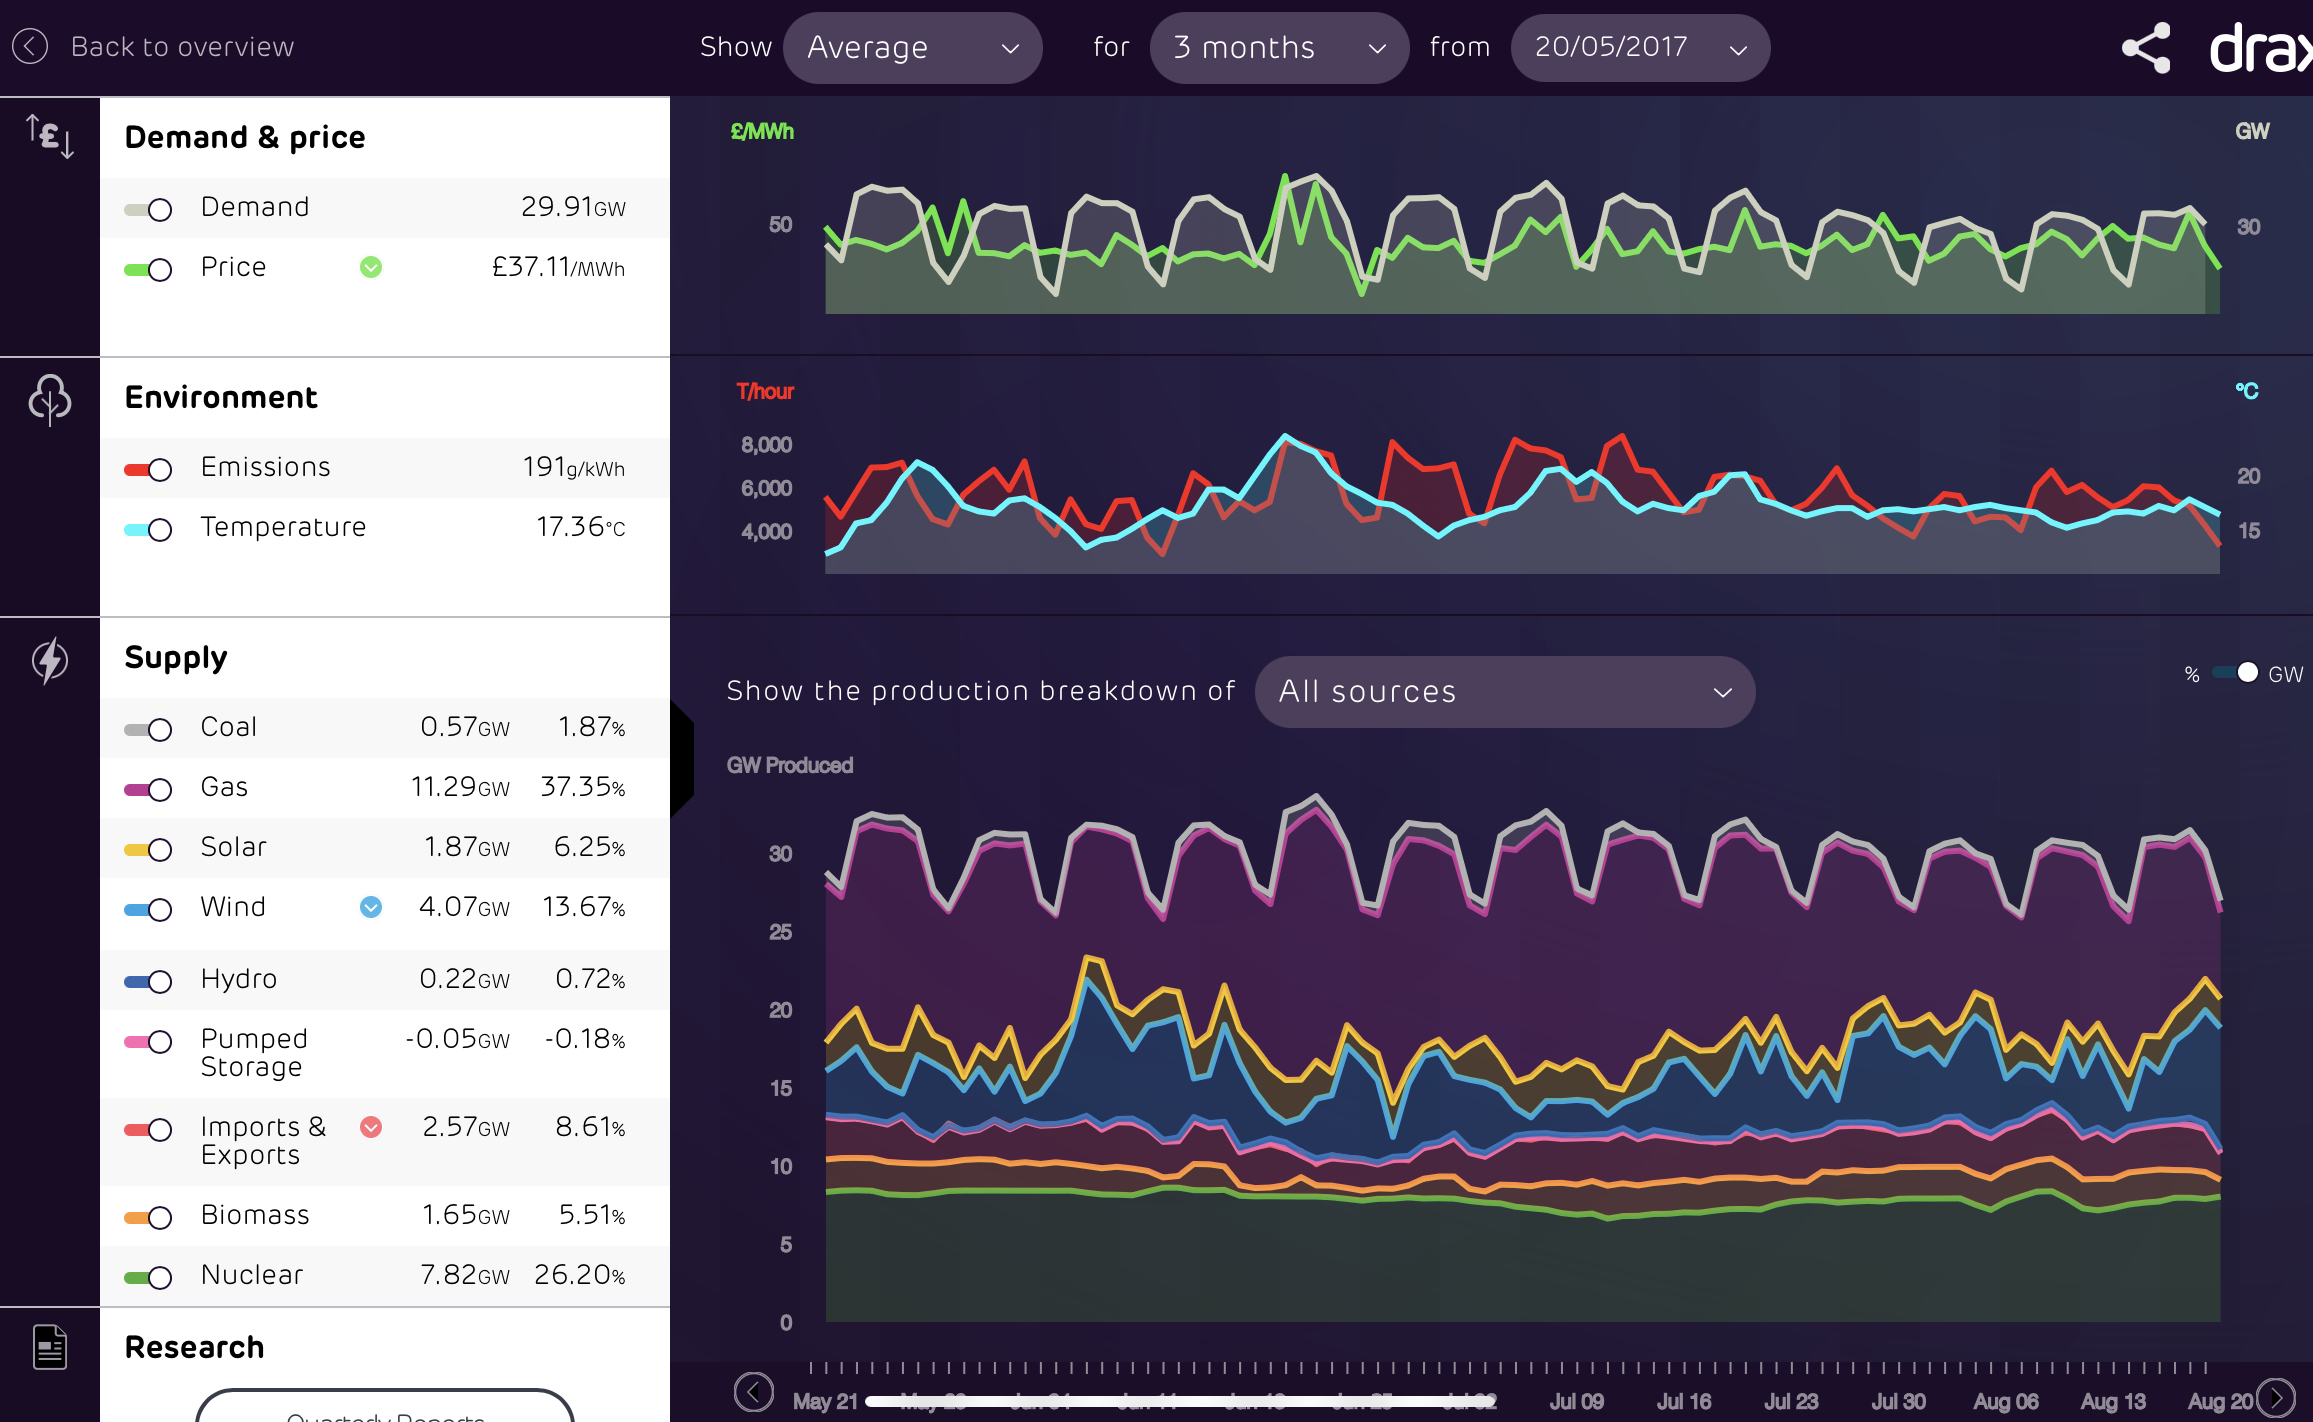
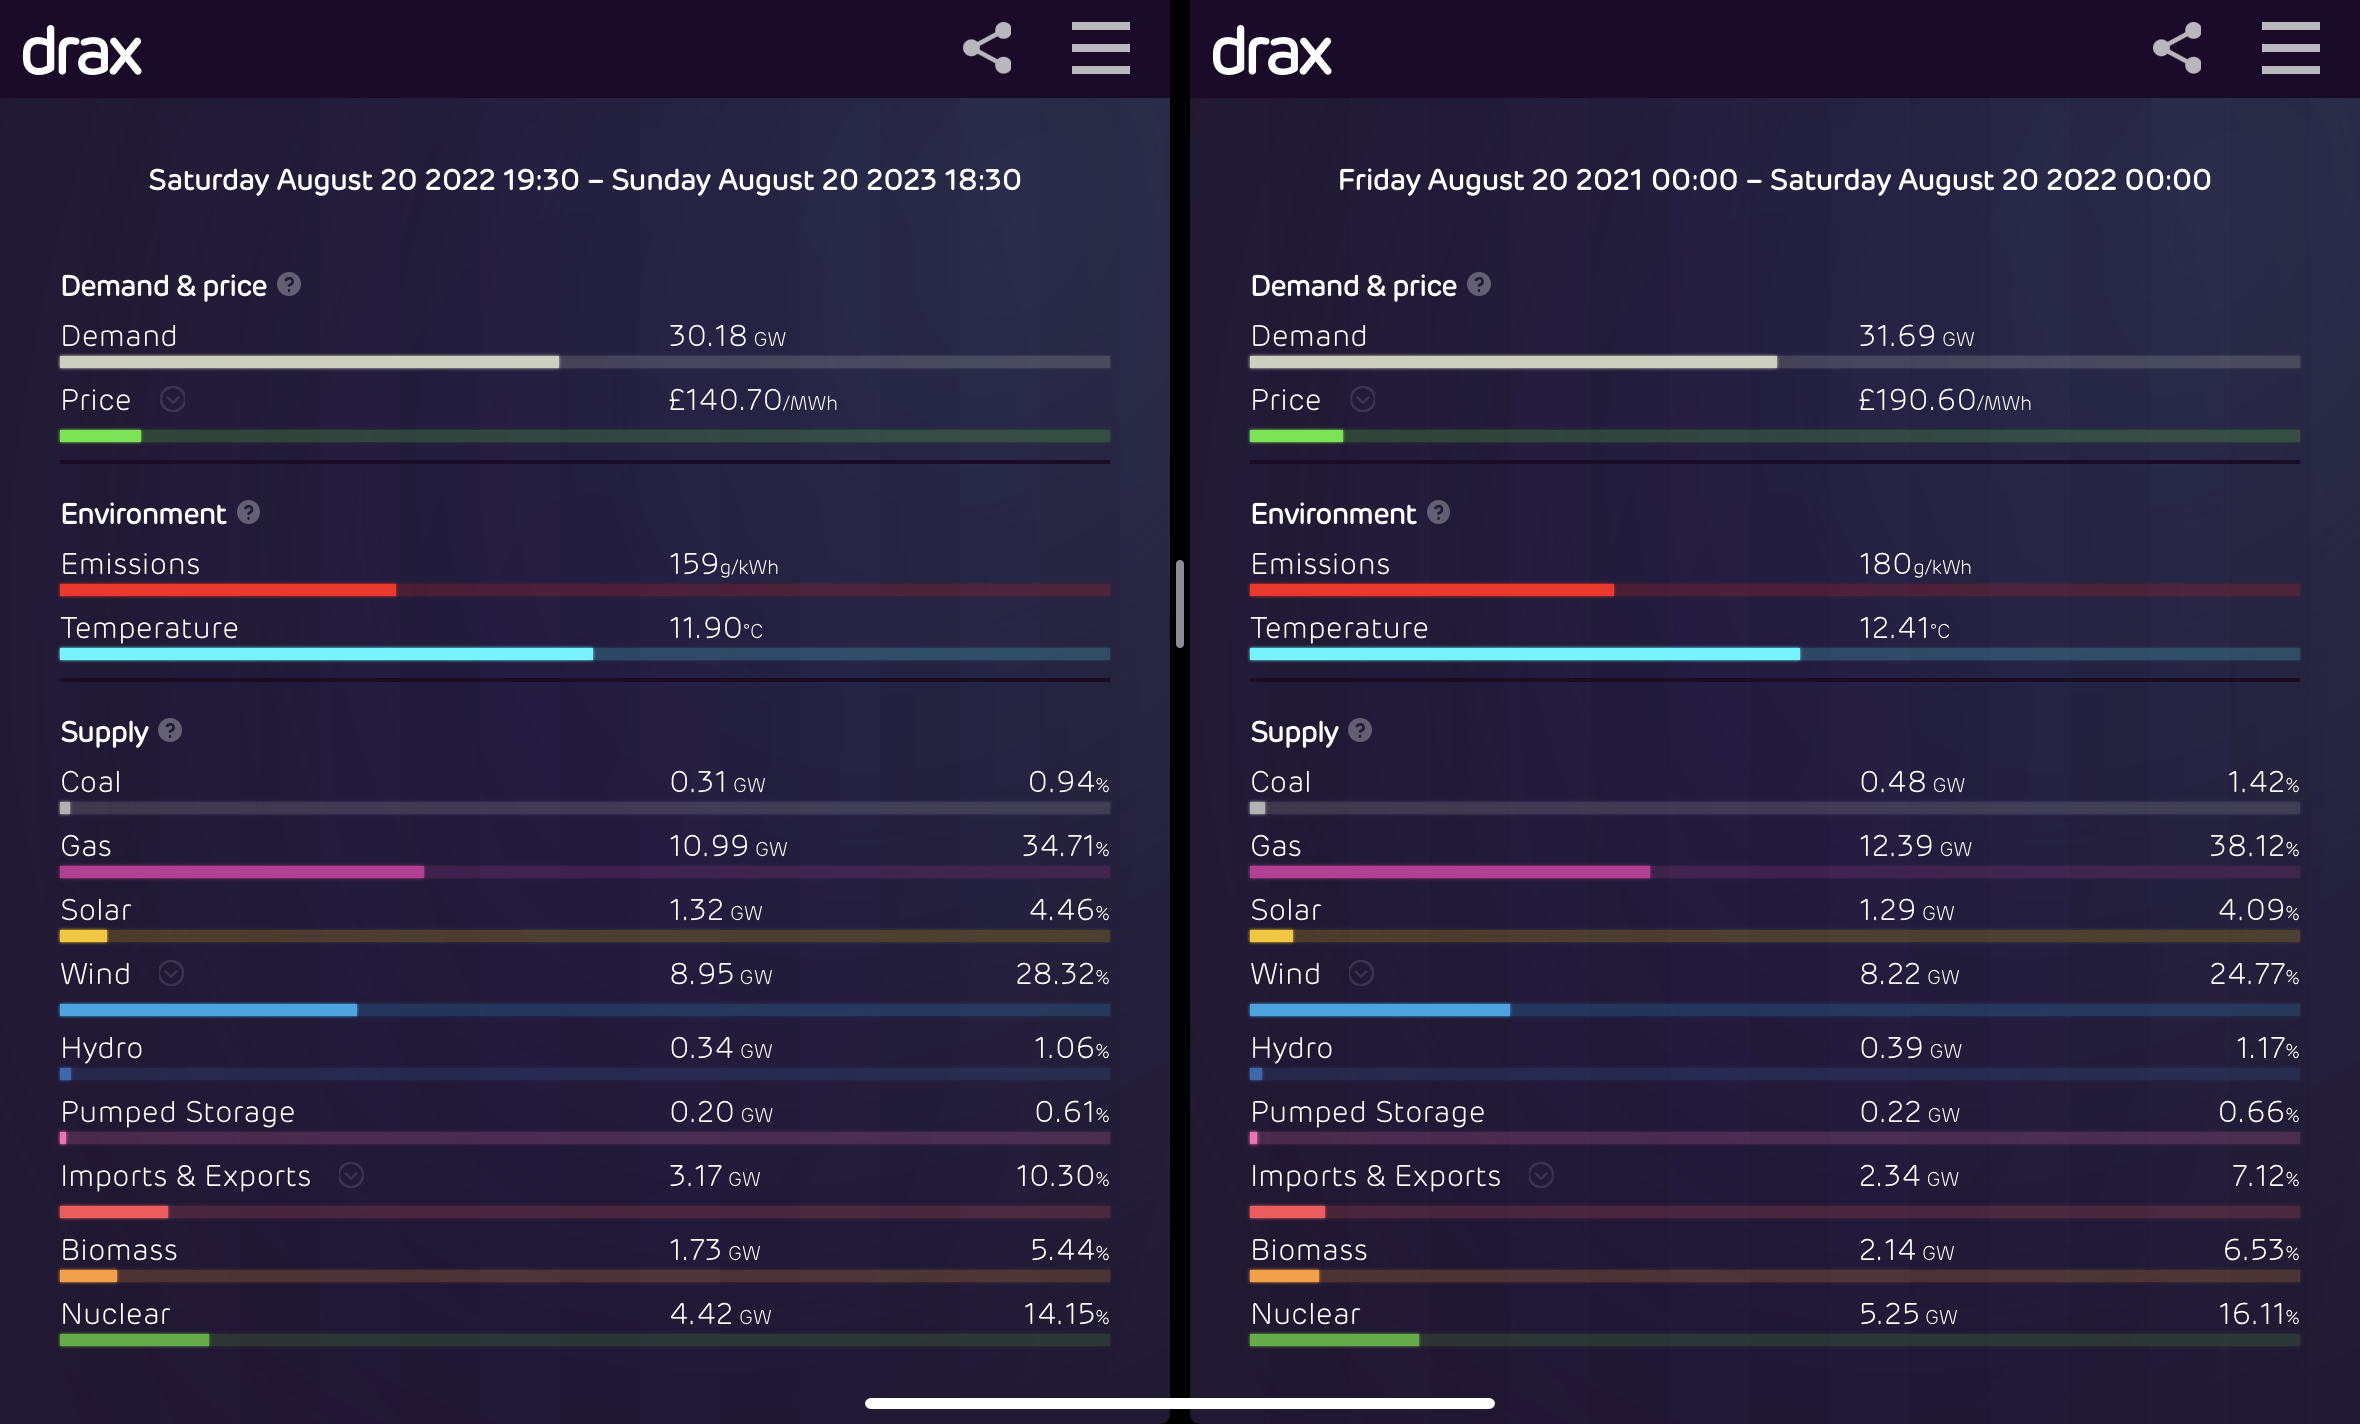
I agree, overall CO2 emissions should fall as we displace ICEVs and oil/gas boilers with EVs and heat pumps. It should struck me as significant that the CO2 content of grid generation seemed to more closely track overall electricity demand than roll out of grid scale solar and wind. It was the dramatic fall in CO2 to 139g/kWh which had sparked my interest and made me wonder if this was all down to new renewable capacity or if there was something else. One would expect renewables to provide a greater proportion of generation and for the grid to be cleaner with lower demand as there would be less call on fossil fuels but as I commented a greater proportion of renewables didn’t always equate to less CO2 being emitted.It needs a bit more work on it to look at the reasons. One issue perhaps is the treatment of imports. What figure do Electric Insights use for the CO2 content of imported electricity?Edit: I have updated the table to include gas, coal and nuclear generation sources. The correlation between CO2 and fossil fuel usage is quite high, as one would expect, but not perfect. In 2017 fossil fuels accounted for 39.92% of generation when emissions were 191 but in 2022 when fossil fuels accounted for 44.15% emissions were188. In 2019 the figures were 40.26 % and 181 but in 2021 the fossil figures were lower at 38.31% yet emissions were little changed (slightly higher) at 182.We seem to have been bobbing along at around the 180/190 mark for emissions since 2017 and nothing seemed to be changing until the last 3 months when demand fell significantly and CO2 with it.
 Northern Lincolnshire. 7.8 kWp system, (4.2 kWwest facing panels , 3.6 kWeast facing), Solis inverters installed 2018, 5kW SSE facing system (shaded in afternoon) added in 2025 with Tesla PW3 battery, Mitsubishi SRK35ZS-S and SRK20ZS-S Wall Mounted A2A Heat Pumps, ex Nissan Leaf owner.0
 -
I guess we have seen nuclear output decline over that period to an extent replaced by imports, not sure of the net CO2 consequences.
Possibly the big question is what has caused the fall in demand this year - the only similar low year is covid impacted 2020. could it be in reaction to the higher prices? I wonder if there is an issue with the data?I think....0 -
The govt attributes a reduction in household energy use on increased cost
4.7kwp PV split equally N and S 20° 2016.Givenergy AIO (2024)Seat Mii electric (2021). MG4 Trophy (2024).1.2kw Ripple Kirk Hill. 0.6kw Derril Water.Vaillant aroTHERM plus 5kW ASHP (2025)Gas supply capped (2025)1 -
A comparison of the last 2 years
 Northern Lincolnshire. 7.8 kWp system, (4.2 kWwest facing panels , 3.6 kWeast facing), Solis inverters installed 2018, 5kW SSE facing system (shaded in afternoon) added in 2025 with Tesla PW3 battery, Mitsubishi SRK35ZS-S and SRK20ZS-S Wall Mounted A2A Heat Pumps, ex Nissan Leaf owner.0
 -
Somewhat surprisingly we were burning coal today from about 4pm as imports tailed off. Demand was around 28.1GW. In fact several days this week we have been using coal. For a couple of hours on the morning of 16th August wind was generating less than 0.3GW, that’s little more than 1% of installed capacity and around 1% of demand.
Edit: There is no guarantee that charging one’s car overnight will be cleaner than during the day. Between midnight and 7am CO2 emissions were over 250g/kWh then remained below 250g/kWh for the rest of the day. From 1am to 6pm on 16th August, when much overnight charging is carried out, the day ahead and spot prices were below £77/MWh whereas during the evening peak the spot price was around £130 and day ahead over £100 demonstrating there is not necessarily a correlation between cheap prices and low CO2.Northern Lincolnshire. 7.8 kWp system, (4.2 kWwest facing panels , 3.6 kWeast facing), Solis inverters installed 2018, 5kW SSE facing system (shaded in afternoon) added in 2025 with Tesla PW3 battery, Mitsubishi SRK35ZS-S and SRK20ZS-S Wall Mounted A2A Heat Pumps, ex Nissan Leaf owner.0 -
If you look at all those charts in the earlier post, the emissions follow the path of demand... lower overnight than during the day.JKenH said:Somewhat surprisingly we were burning coal today from about 4pm as imports tailed off. Demand was around 28.1GW. In fact several days this week we have been using coal. For a couple of hours on the morning of 16th August wind was generating less than 0.3GW, that’s little more than 1% of installed capacity and around 1% of demand.
Edit: There is no guarantee that charging one’s car overnight will be cleaner than during the day. Between midnight and 7am CO2 emissions were over 250g/kWh then remained below 250g/kWh for the rest of the day. From 1am to 6pm on 16th August, when much overnight charging is carried out, the day ahead and spot prices were below £77/MWh whereas during the evening peak the spot price was around £130 and day ahead over £100 demonstrating there is not necessarily a correlation between cheap prices and low CO2.4kWp (black/black) - Sofar Inverter - SSE(141°) - 30° pitch - North LincsInstalled June 2013 - PVGIS = 3400Sunsynk Ecco Inverter & Pylontech 5x US2000, 3x US3000, 3x US5000 Batteries - 37kWh0 -
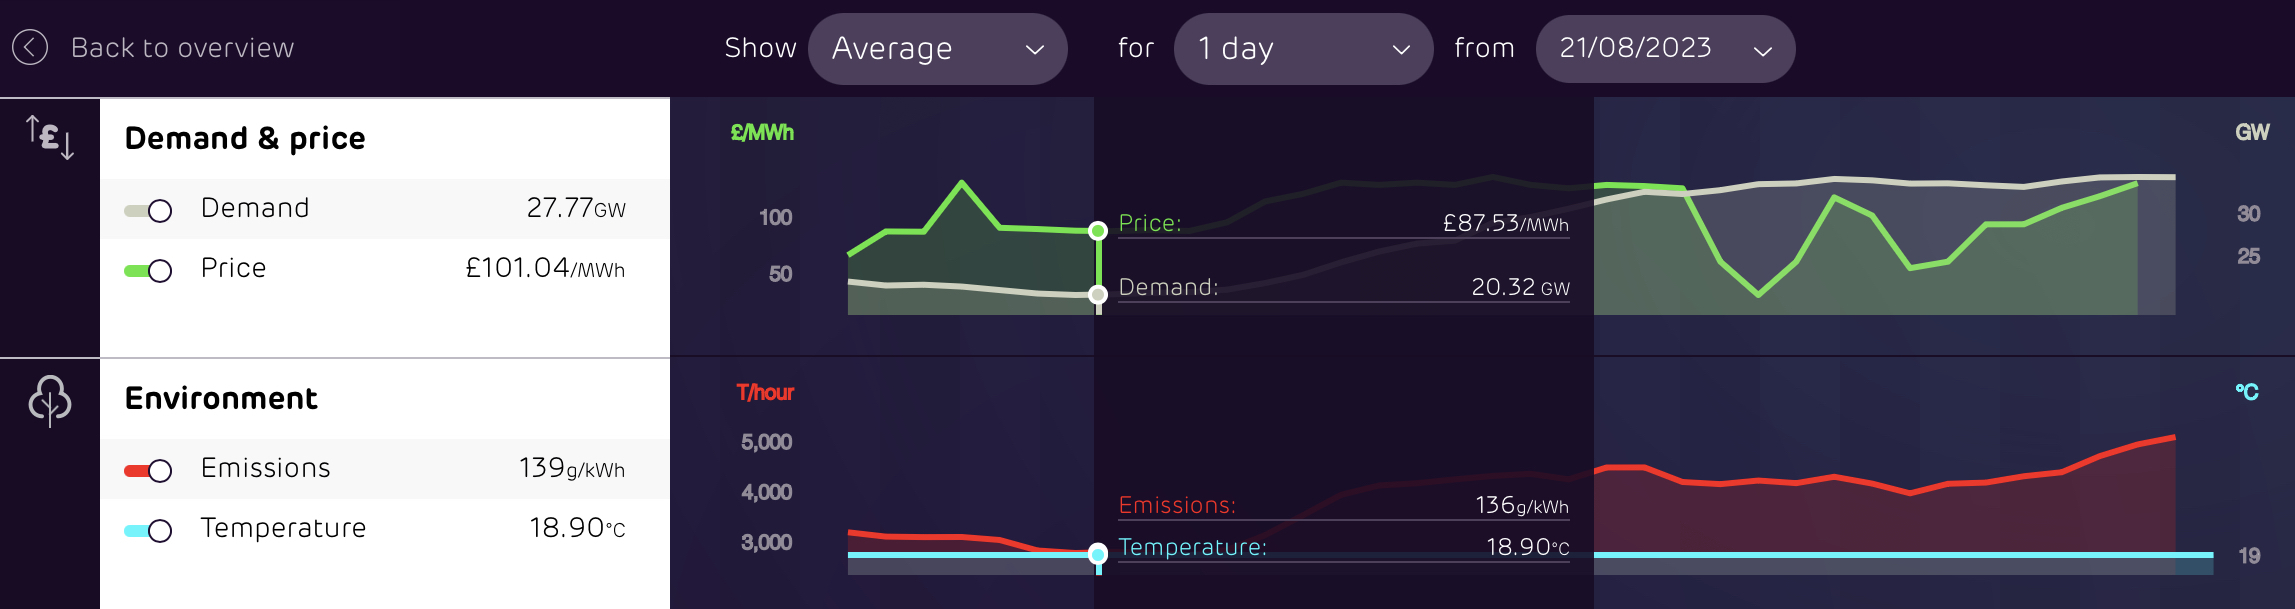
They often do but not always. Here’s Saturday’s data1961Nick said:
If you look at all those charts in the earlier post, the emissions follow the path of demand... lower overnight than during the day.JKenH said:Somewhat surprisingly we were burning coal today from about 4pm as imports tailed off. Demand was around 28.1GW. In fact several days this week we have been using coal. For a couple of hours on the morning of 16th August wind was generating less than 0.3GW, that’s little more than 1% of installed capacity and around 1% of demand.
Edit: There is no guarantee that charging one’s car overnight will be cleaner than during the day. Between midnight and 7am CO2 emissions were over 250g/kWh then remained below 250g/kWh for the rest of the day. From 1am to 6pm on 16th August, when much overnight charging is carried out, the day ahead and spot prices were below £77/MWh whereas during the evening peak the spot price was around £130 and day ahead over £100 demonstrating there is not necessarily a correlation between cheap prices and low CO2.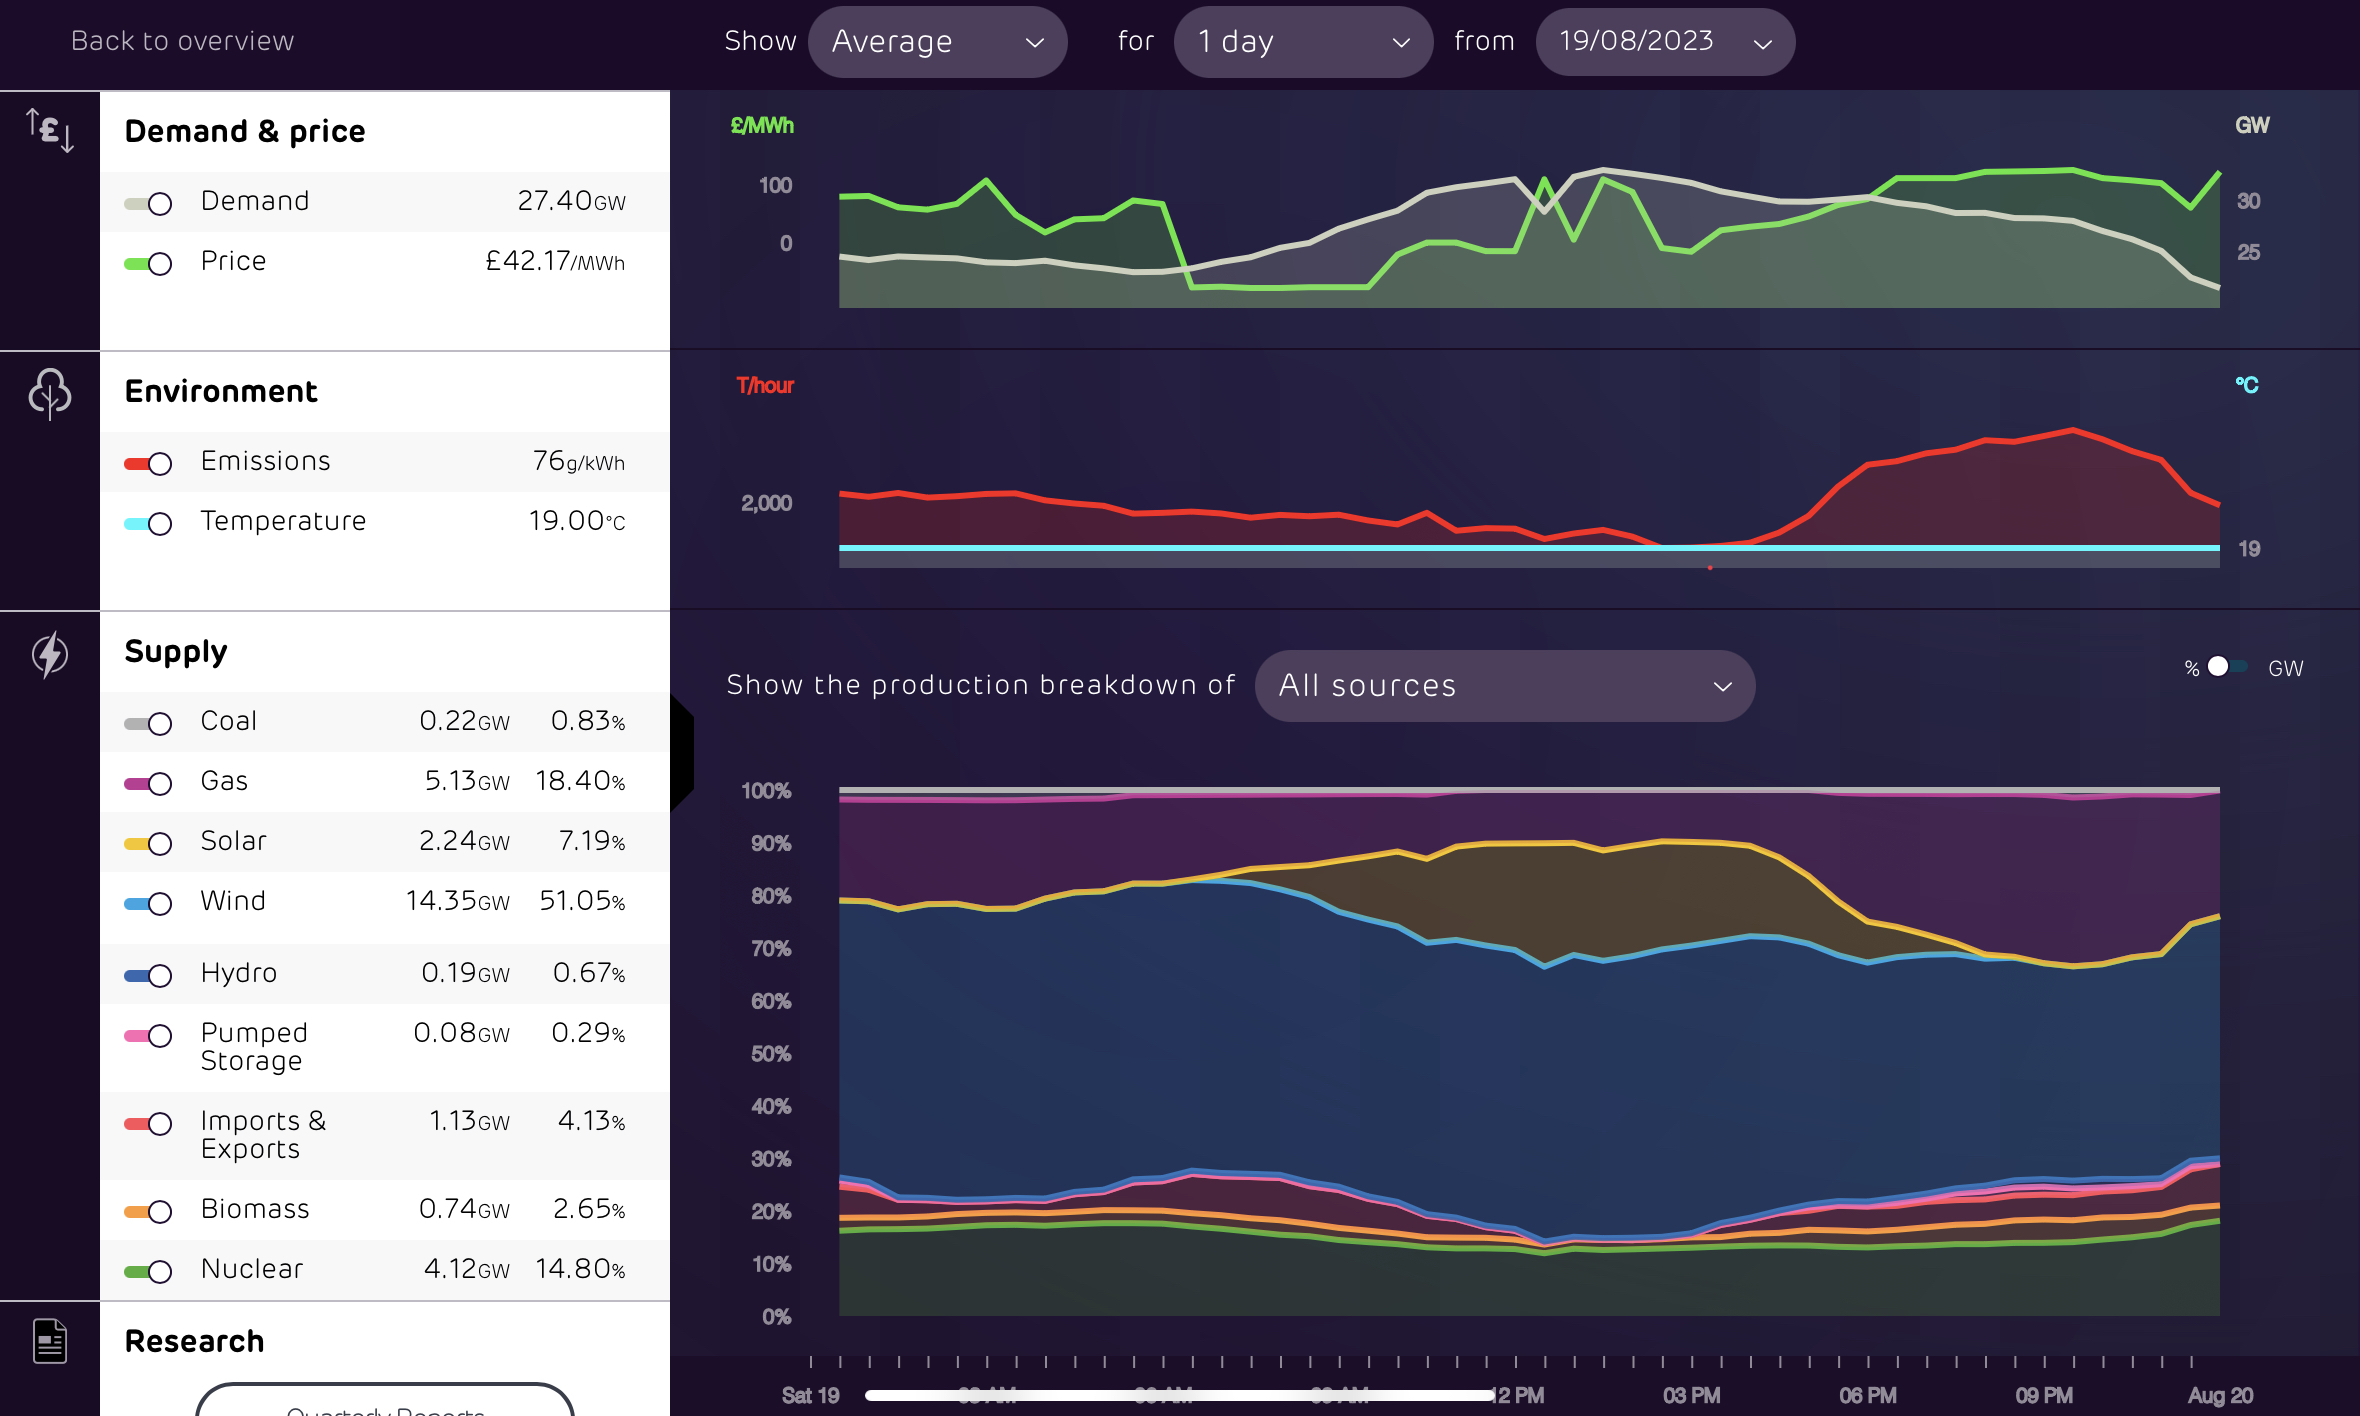
https://www.electricinsights.co.uk/#/dashboard?start=2023-08-19&&_k=w24pcl
One also needs to be careful looking at the graphs which show total emissions tons per hour rather than g/kWh.
Compare these two images from yesterday. The grid was marginally cleaner mid afternoon than at 2am due to solar generation.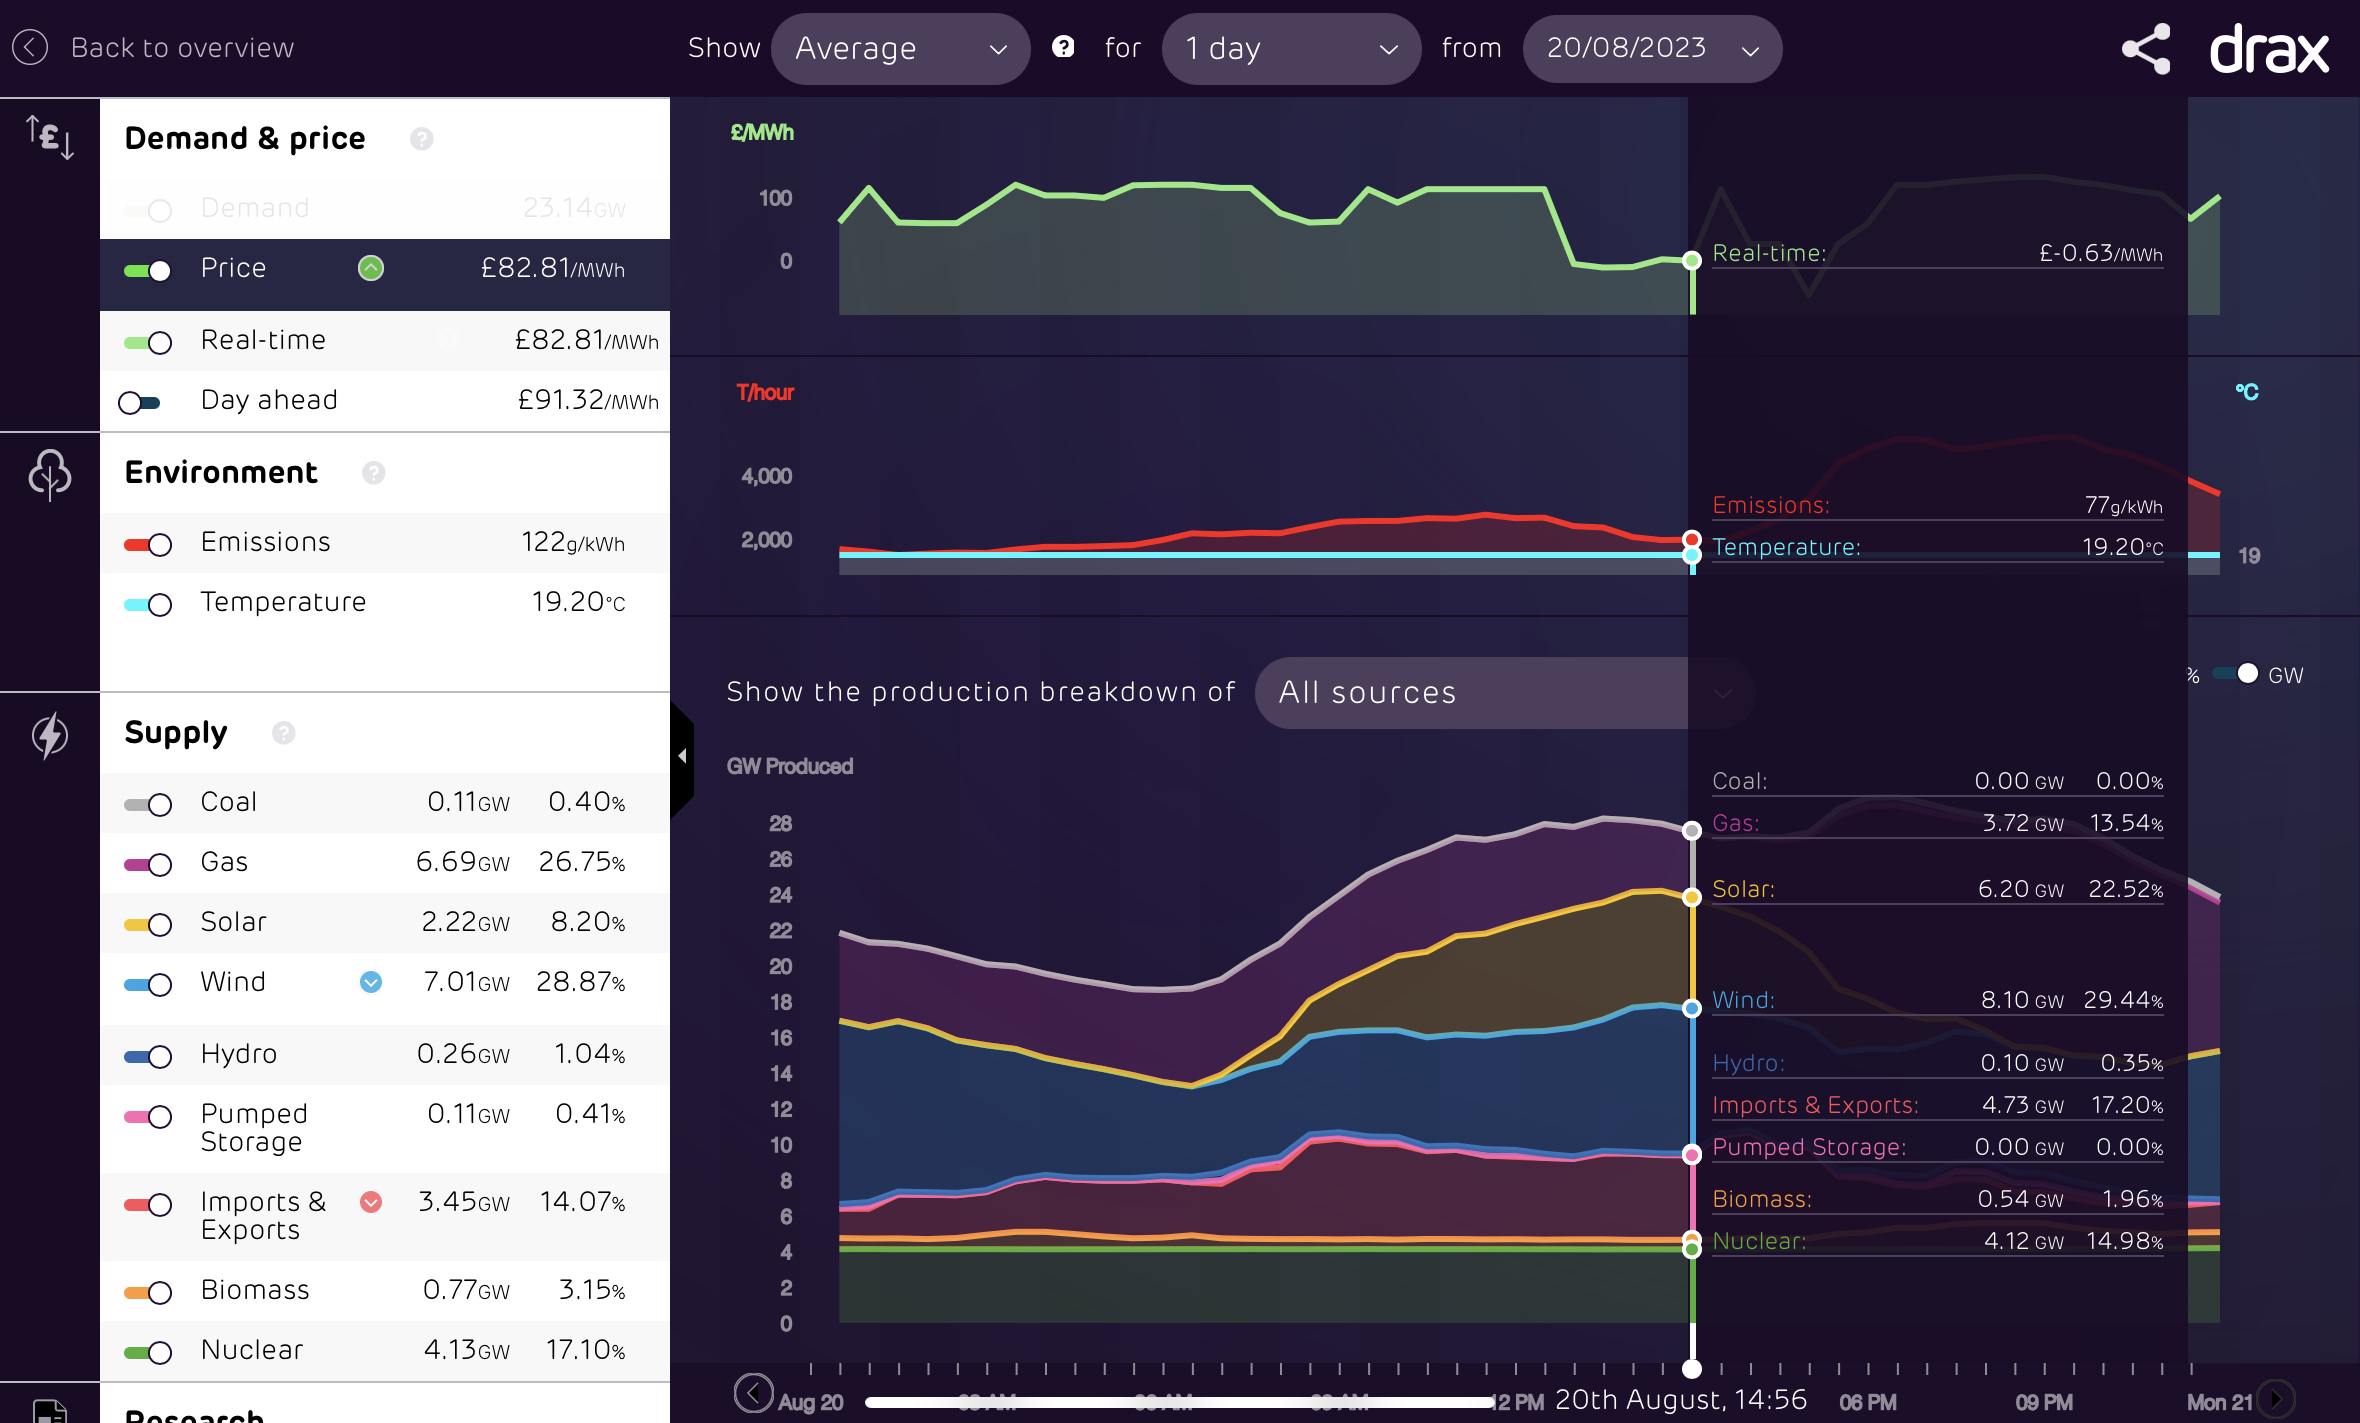
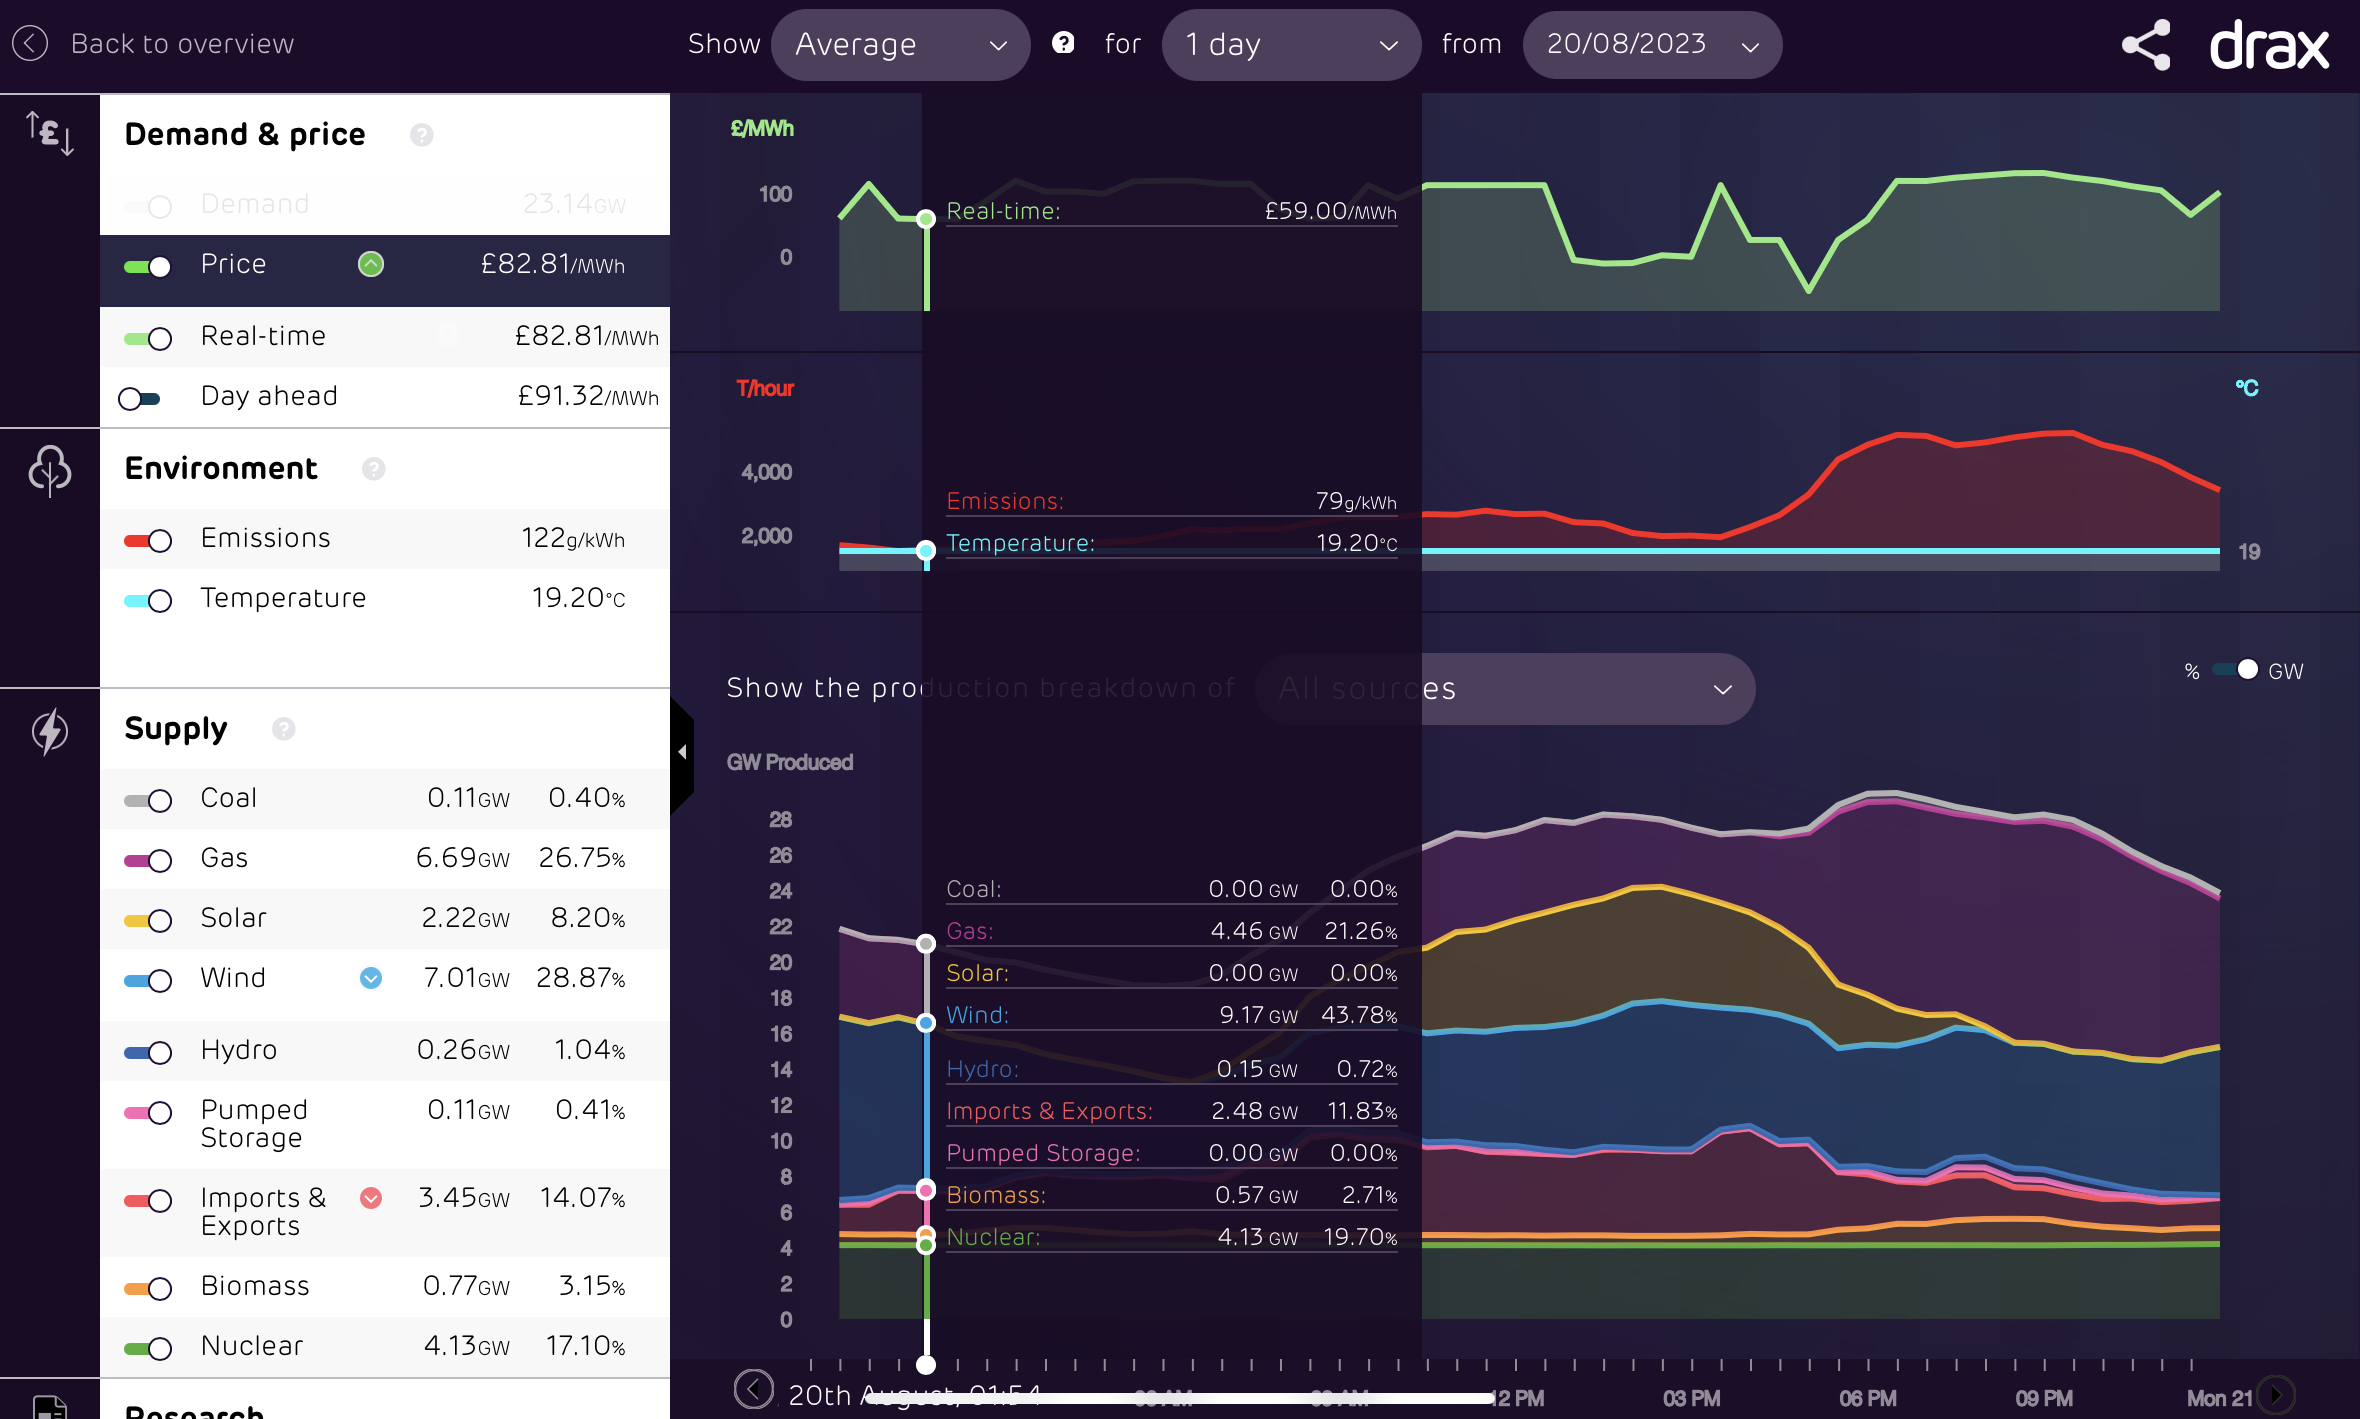
Edit: another example that emissions mid afternoon (2.30 pm today) can be lower than overnight (3.30am) although the graphs might initially give the impression mid afternoon emissions are higher.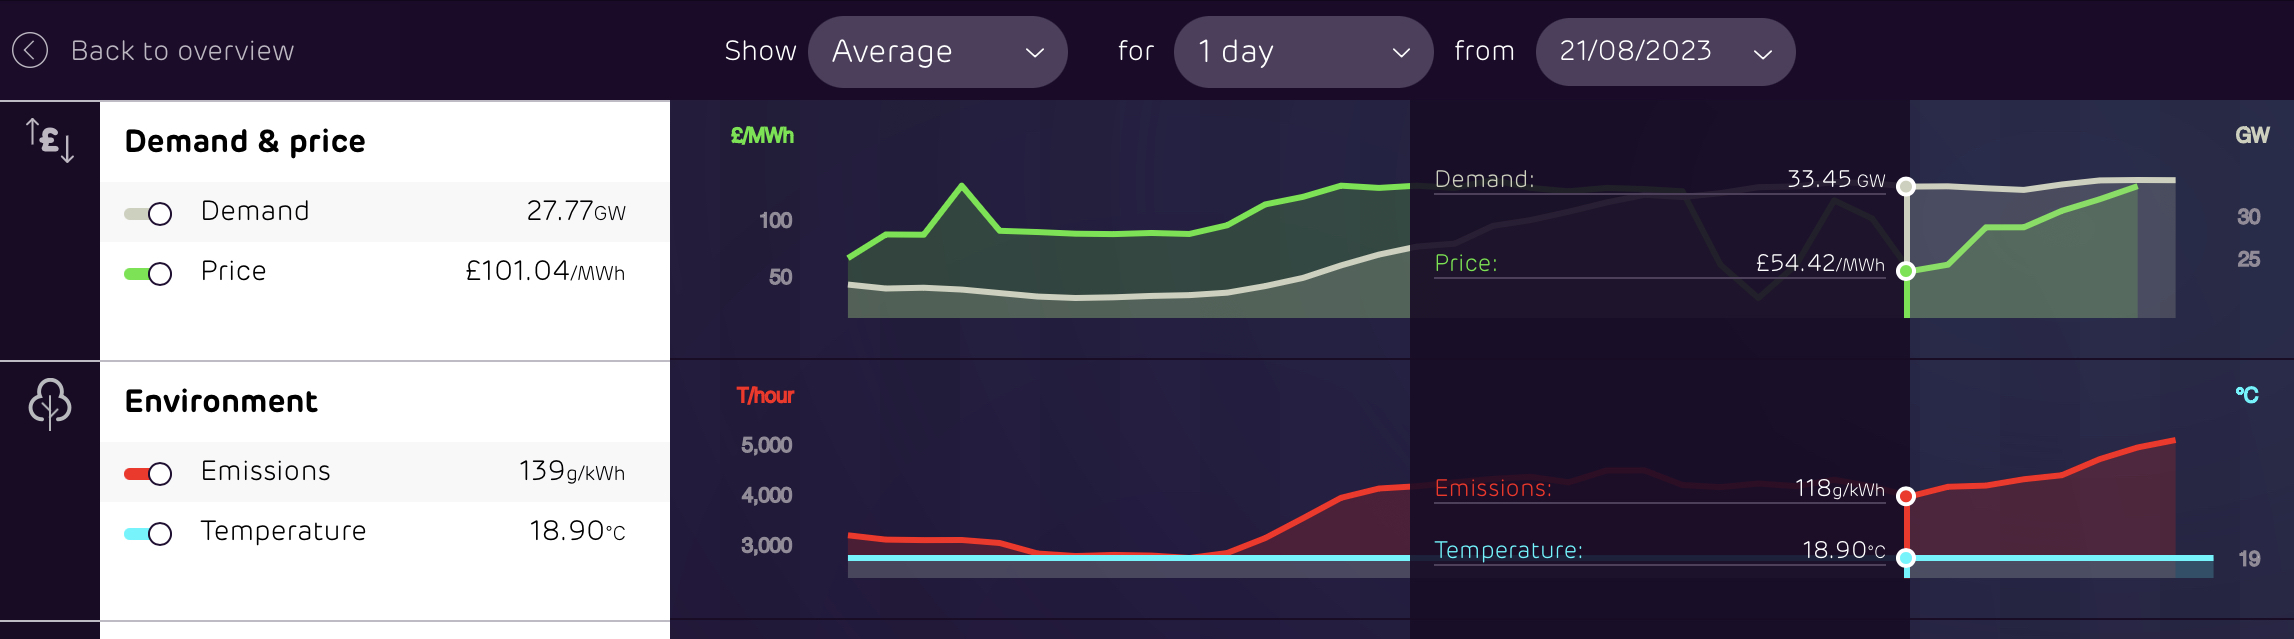
Northern Lincolnshire. 7.8 kWp system, (4.2 kWwest facing panels , 3.6 kWeast facing), Solis inverters installed 2018, 5kW SSE facing system (shaded in afternoon) added in 2025 with Tesla PW3 battery, Mitsubishi SRK35ZS-S and SRK20ZS-S Wall Mounted A2A Heat Pumps, ex Nissan Leaf owner.0


Confirm your email address to Create Threads and Reply

Categories
- All Categories
- 355.1K Banking & Borrowing
- 254.7K Reduce Debt & Boost Income
- 455.8K Spending & Discounts
- 247.9K Work, Benefits & Business
- 605K Mortgages, Homes & Bills
- 178.8K Life & Family
- 262.7K Travel & Transport
- 1.5M Hobbies & Leisure
- 16.1K Discuss & Feedback
- 37.7K Read-Only Boards