We’d like to remind Forumites to please avoid political debate on the Forum.
This is to keep it a safe and useful space for MoneySaving discussions. Threads that are – or become – political in nature may be removed in line with the Forum’s rules. Thank you for your understanding.
📨 Have you signed up to the Forum's new Email Digest yet? Get a selection of trending threads sent straight to your inbox daily, weekly or monthly!
Stocks and shares isas down in 2015
Comments
-
The valuation gain on my percolating IFA managed portfolio is +4.50%
That's from 5 Jan 2015 to 5 Jan 2016 with no external transactions.
From 5 Jan 2015 it peaked at +6.23% on 2 May 2015
It then dipped to it's lowest point after that of +2.58% on 5 October 2015'We don't need to be smarter than the rest; we need to be more disciplined than the rest.' - WB0 -
Arguably it is not relevant for any individual posters to compare how they did from a mixed portfolio of global equities funds, bonds funds and real estate funds etc, against some other person who has bet the farm on Dominos UK or Centrica...TheTracker wrote: »Interesting that none of the (I)FAs that percolate these forums gave statistics on how their clients did for the year. Yes they'd each have different needs, not just return, but not less relevant than individual posters. Perhaps their own showings, then...
We are all well aware that different underlying investments in the equities space made different returns from 100% down to over 100% up, and that currency rates have moved in the last year for example with the GBP moving throughout the year from below 1.3 to over 1.4 Eur or from above 195 JPY to 175. So it's only a bit of fun.
Probably don't need to see whether an IFA client invested for capital preservation and drawdown income achieved a different result to an IFA client who's a 30 year old with an aggressive equities focus. It's likely they did. If you fit into neither of those categories now, the figures are likely to be different for the years that you do. Though IFAs may encourage an annual review with their clients, my understanding is that they are more aiming for returns of 3,5,10,20 years to be in line with targets rather than to get a particular January to January return in one year.
I imagine that if an IFA were to say "I encouraged my client to take a particular investing approach based on his goals, and it delivered 5% net of my fees over the 12 months" you would say something like, "well a simple global tracker would have done 5.5% net with no IFA required, so yet again the fees creamed off by IFAs are not justifiable." Which misses the point. But hard to blame you for such a conclusion when it would be being drawn from meaningless data.
FWIW I haven't done a running IRR for my pensions and ISA for calendar 2015, generally look at them at end of March to tie in with tax year and pension/isa allowances etc.0 -
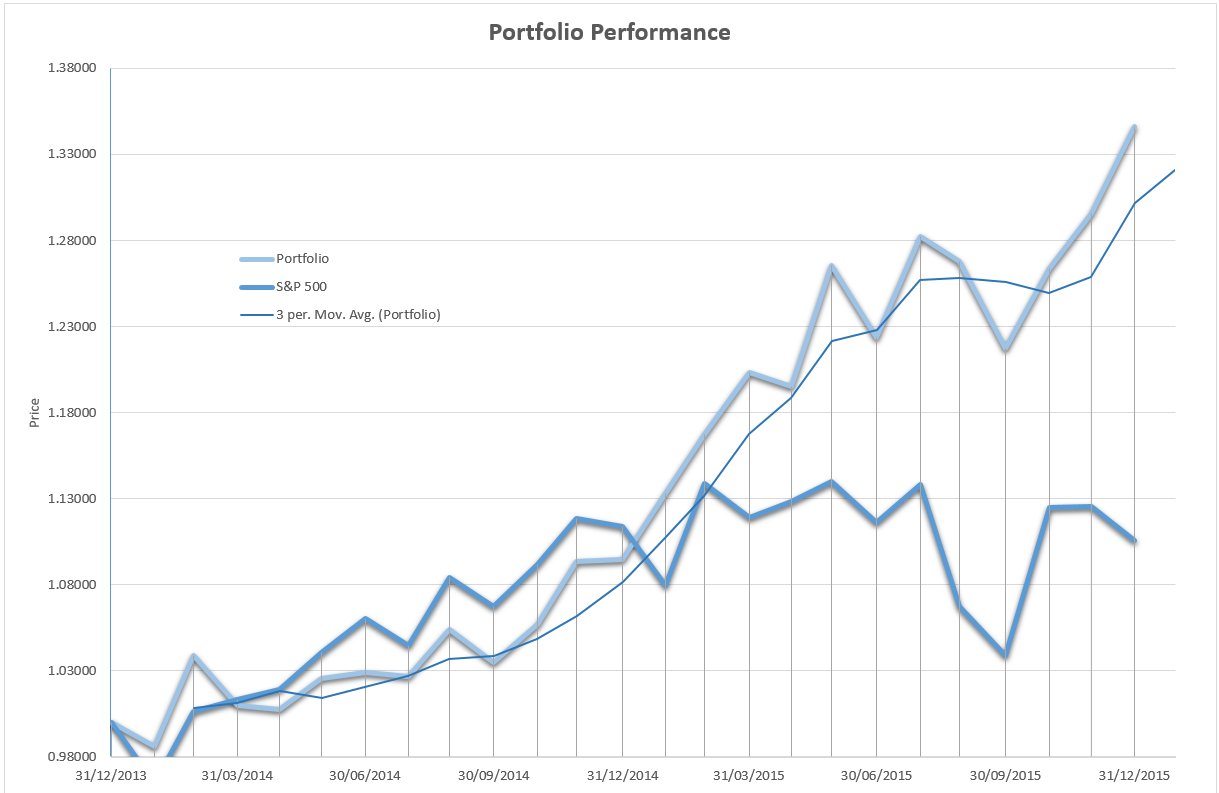
george4064 wrote: »I have now managed to obtain my 31/12/2014 valuation, using the same calculation method as before my portfolio has returned +21.58% for 2015 up to 24/12/15.
Pretty much bang on what it was from October to October.
Final figure for 2015 is +23.01%.
January will be nursing heavy losses, about -8% so far.
Here's a graph showing my portfolio performance, S&P 500 and 3-month moving average of my portfolio.
I need to try find somewhere where I can source S&P 500 prices with dividends re-invested. Any ideas?"If you aren’t willing to own a stock for ten years, don’t even think about owning it for ten minutes” Warren Buffett
Save £12k in 2025 - #024 £1,450 / £15,000 (9%)0 -
Spindices.com have factsheets for all their indices. For example
http://us.spindices.com/idsenhancedfactsheet/file.pdf?calcFrequency=M&force_download=true&hostIdentifier=48190c8c-42c4-46af-8d1a-0cd5db894797&indexId=340 , showing the index had total return of 1.38% for calendar 2015 (price return -0.73%).
They also let you download spreadsheets showing detail of what company in what sector paid what dividend - although only gives the month and dollar amount per share, not exact date or what proportion of the index the company made up at that date... so it would require a lot of research to work out how it would have been reinvested. More data is available under license.
The easiest thing might just be to find a low fee accumulating SP500 tracker and use that as a proxy for the index total return. There will of course be tracking error and costs.0 -
I suppose you could also use a tool like Portfolio Visualizer (dot com) to set the benchmark against which you compare your portfolio against.0
-
One obvious flaw in doing a graph like that (apart from the fact that your "benchmark" S&P is a different bag of assets from your actual portfolio with a different risk profile and different geographic exposure....) is that you are saying the s&p has been pretty flat from 31/12/14 to 31/12/15 (you should move it to a total return basis but it would still only be 1-2% up) BUT the index is a USD index.george4064 wrote: »Here's a graph showing my portfolio performance, S&P 500 and 3-month moving average of my portfolio.
If I invested $1000 in the index on 1 Jan and reinvested the divs I'd have $1010 or whatever on 31 Dec. But the investment would have cost me about GBP 640 and be worth GBP 680, a clear gain. Sterling got weaker so the dollar investment is worth more, while you are showing it as flat.
But presumably your actual portfolio returns are in GBP so you are not comparing apples with apples as far as I can see. It looks you are beating an S&P return but is certainly partially artificial because the S&P performed better for a GBP investor than what you are showing.0 -
bowlhead99 wrote: »One obvious flaw in doing a graph like that (apart from the fact that your "benchmark" S&P is a different bag of assets from your actual portfolio with a different risk profile and different geographic exposure....) is that you are saying the s&p has been pretty flat from 31/12/14 to 31/12/15 (you should move it to a total return basis but it would still only be 1-2% up) BUT the index is a USD index.
If I invested $1000 in the index on 1 Jan and reinvested the divs I'd have $1001 on 31 Dec. But the investment would have cost me about GBP 640 and be worth GBP 680, a clear gain. Sterling got weaker so the dollar investment is worth more, while you are showing it as flat.
But presumably your actual portfolio returns are in GBP so you are not comparing apples with apples as far as I can see.
I think a S&P500 tracker ETF would be the easiest option thanks. My portfolio is inclusive of fees, so it would be fair for it to be compared to a tracker with fees.
I appreciate your points that I'm technically comparing apples with oranges, what would you suggest would be a good index/tool to use as an index for my portfolio? (I didn't want to use the FTSE 100 because it is so heavily weighted towards miners and oil, which have done poorly)."If you aren’t willing to own a stock for ten years, don’t even think about owning it for ten minutes” Warren Buffett
Save £12k in 2025 - #024 £1,450 / £15,000 (9%)0 -
As TheTracker suggested, try http://www.portfoliovisualizer.com/FAQ and then expand "data sources for asset class returns" and then after reviewing that, "data sources". This shows you what indexes they use as a proxy for various stock markets and asset class types. Presumably you have a blend of assets and markets so should blend together various indexes in appropriate proportions for an aggregated benchmark which reflects the kind of thing you actually hold.george4064 wrote: »I appreciate your points that I'm technically comparing apples with oranges, what would you suggest would be a good index/tool to use as an index for my portfolio? (I didn't want to use the FTSE 100 because it is so heavily weighted towards miners and oil, which have done poorly).
Of course if you are skewed heavily to one market then you could come up with a generalist benchmark (rather than a properly reflective benchmark) to judge how your skewing affected your returns.
But either way, adjust for currency as there is no point seeing what returns the indexes say an American or French investor got from (e.g.) US or Europe or Asia Pacific when they are investing in dollars or euros and you want to know what your returns would have been in pounds, to compare to actuals in pounds.0 -
TheTracker wrote: »I suppose you could also use a tool like Portfolio Visualizer (dot com) to set the benchmark against which you compare your portfolio against.
Thanks I'll check it out"If you aren’t willing to own a stock for ten years, don’t even think about owning it for ten minutes” Warren Buffett
Save £12k in 2025 - #024 £1,450 / £15,000 (9%)0 -
if you are benchmarking your portfolio (which you look at in £) against something priced in $, then you should first combine that benchmark with historic £/$ exchange rate figures, to give you a benchmark priced in £.0


This discussion has been closed.
Confirm your email address to Create Threads and Reply

Categories
- All Categories
- 352.7K Banking & Borrowing
- 253.8K Reduce Debt & Boost Income
- 454.6K Spending & Discounts
- 245.8K Work, Benefits & Business
- 601.8K Mortgages, Homes & Bills
- 177.7K Life & Family
- 259.7K Travel & Transport
- 1.5M Hobbies & Leisure
- 16K Discuss & Feedback
- 37.7K Read-Only Boards