We’d like to remind Forumites to please avoid political debate on the Forum.
This is to keep it a safe and useful space for MoneySaving discussions. Threads that are – or become – political in nature may be removed in line with the Forum’s rules. Thank you for your understanding.
📨 Have you signed up to the Forum's new Email Digest yet? Get a selection of trending threads sent straight to your inbox daily, weekly or monthly!
UK Stockmarket 2009 and beyond
Comments
-
I kind of like these pullbacks even though they are stomach churning. It`s healthy and I think, with a bit of luck, that we will be going back up the channel soon. That rising wedge changed to channel action
tradetime, spx looks very oversold. imo, the buyers will be out in force soon0 -
Lot of study this weekend, S&P testing 1090's support, think that should equate to 5200 ish on the FTSE. Next week will be interesting. VIX up 24% today alone. Still only a correction in the order of 5-6% but after the constant grind upwards it seems like more.Hope for the best.....Plan for the worst!
"Never in the history of the world has there been a situation so bad that the government can't make it worse." Unknown0 -
I heard mid 90's called out coming up to the close and that is where we rest also Ftse 5200 looks to be support/resistance going back to September.
I dont really have these old levels mapped out, feels very uncertain but Im more certain of a more negative trend for the next few months personally.
Old trend defeated and now we must form a new one before it can really rise up again.
Im looking to rebalance things if we do recover short term but mostly holding, not looking to sell on lower prices.
On the shorter term view, if we can break this channel I hope we could go as far as retesting 5500
If we keep going down I would want to buy some silver stock hopefully.
Last price I thought of buying Fres was 550 on their august results. If they got anywhere near that price that would be attractive and another silver company is HOC
http://uk.finance.yahoo.com/q?s=hoc.l&m=L&d=
But I dont know what price to enter for that one, would probably scale in and watch silver price, closing price for SLV is 16.78 today and highest price in August was 14.79
Hopefully monday will look worse then it really is0 -
STT, HOC is also on my radar list.sabretoothtigger wrote: »IIf we keep going down I would want to buy some silver stock hopefully.
Last price I thought of buying Fres was 550 on their august results. If they got anywhere near that price that would be attractive and another silver company is HOC
http://uk.finance.yahoo.com/q?s=hoc.l&m=L&d=
But I dont know what price to enter for that one, would probably scale in and watch silver price, closing price for SLV is 16.78 today and highest price in August was 14.79
Hopefully monday will look worse then it really is
Looking at its chart alone (i.e. ignoring the current market trend/sentiment) its appears to have reached a significant support area; bottom of its rising channel and touching its 200 SMA. Also looking at the 21 day RSI it's (virtually) oversold.
Anyway, Caz has come out with a report recently (although I can find a link to it) where they feel they will be lowering their EPS next year, primarilly due to exploration costs (althoguh this could be beneficial longer term) and, believes that HOC stands at about a 33% discount to FRES.
For info Merrill has come out with an update following HOC's results.
EDIT: Forgot to say they have a price target of 440p
cloud_dogPersonal Responsibility - Sad but True
Sometimes.... I am like a dog with a bone0 -
tradetime, spx looks very oversold. imo, the buyers will be out in force soon
Agree kittie, we are now short term very oversold, early start to the week for me when futures open Sunday night.Hope for the best.....Plan for the worst!
"Never in the history of the world has there been a situation so bad that the government can't make it worse." Unknown0 -
Normally I'd agree but this time its different! It is oversold but sometimes it just keeps on going in a freefall type situation
110.7 was a significant point on the Spy Friday and it failed, the only reason we didnt close on the lowest point of the day for the second day was short covering for the weekend. (The ftse closed before this failure)
When we see usa show some strength I'll hope for the top of the channel to broken otherwise I think 5270 is top ftse price for monday.
Hopefully Im wrong and we go up for a week or something
For reference to sentiment change, I'm going to refer to Sept 08 for time it takes to challenge a trend of major negative sentiment
This is a futures type graph but its roughly the same and it shows the extremes
The 19th of Sept 08 was one of the biggest gains on the FTSE ever, then further along on the 29th we fall from about 5100 to 4550 before gaining and bouncing back to 5k the next day, etc.
Right now we're looking at 5200 for the ftse on friday and I rate the market as flaky in similar ways though I cant see we have the momentum this time to break out of the channel downwards, so a slippery slope not a sheer cliff
This is a rough guide, the lower the red bar on the side then the weaker that price is. A high red bar is a 'strong price' more likely to be highly traded by people willing to buy as well as sell
Views on a bounce this week -_trading_tips_service wrote:last month low 1077,this month low 1082 , next month low is at 1st week
there after a up move..but not beyonf 1150 in feb.hedge_fund,_etc wrote:109 is a strong point, 108 lowest point for monday
[URL="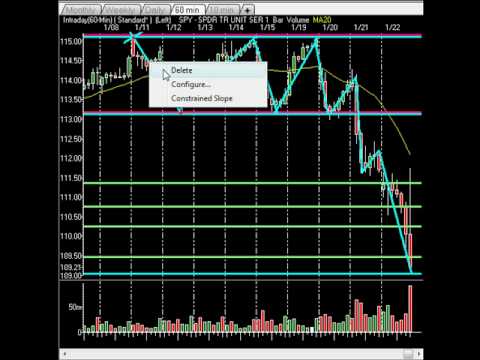 http://www.youtube.com/watch?v=sgtrFk4iXr4]"]http://www.youtube.com/watch?v=sgtrFk4iXr4] [/URL]
This chart seems to roughly confirm a higher red bar at this level but it also shows this fallback has been far higher volume then the previous rise to this point
 < A channel bounce scenario
0 -
well im getting excited again a few drops over the last week
i have come in again on a few which i had b4
and nr about to do my 2nd wave of some stocks i was with b4 also
mind you i do have a huge gamble on SAM with a good few shares which are minus figures
time well tell i surpose
even YELL im liking the look again as wellOh well we only live once ;-)0 -
Often referred to as the four most expensive words in trading. It might be different this time, but we won't know until it plays out. I pick on that not to be funny, but just to say when trading markets it is never a good idea to allow ourselves to use "absolute" terms or phrases, it encourages us to become complacent, as I say, it might be different, and as long as you accept the "might" then you will take appropriate risk management vis a viz stops and position sizing.this time its different!
My oversold observation, if anyone were to trade on it, was for a very short term trade, long into the close on Friday if brave and aggressive, or long at the open on Sunday night, based on aggressive buying into the close, the oversold conditions, the fact that we are still (for the moment) in a bullish intermediate market, and the trigger for the selling, targeting 1100 area on the futures (1105 Cash) . An oversold or overbought market in and of itself is never a valid reason for a trade.even in the very short term.
Fwiw I believe this is a very important market juncture, if we fail to hold the 1080 level S&P cash index, then it's likely we test the 200 day ma on the 1008 area, and that wouldn't be pretty. For now resistance is at 1105 and 1115, a break above 1115 would likely target the highs. I personally wouldn't put a whole lot of weight on what happened in 2008, granted it's better than planning around what happened in 1932, but not by much.
If you are an investor, then you buy things because they are cheap relative to how you value them. If you are a trader, then you buy and sell based solely on price levels, nothing more or less imhoHope for the best.....Plan for the worst!
"Never in the history of the world has there been a situation so bad that the government can't make it worse." Unknown0 -
STT, I notice you like those type of charts (Volume by price) I was wondering what they tell you, ie how you interpret what you see on them? They're not something I have used, so just wondered what people use them for specifically, or what info they take away from them.Hope for the best.....Plan for the worst!
"Never in the history of the world has there been a situation so bad that the government can't make it worse." Unknown0 -
I saw Yell got tipped / reviewed recently and the day traders even are moving on that one
Today was an optimistic day relatively, not much fear and a very strong rise from the worst case scenario friday presented.
We broke out of shorter term FTSE channel I posted above and retouched the top line at 4:30pm
Out of hours spy turned positive itself and I think maybe tomorrow could continue this recovery.
Apple report earnings later, I expect that to be a positive influence. I hope to sell or balance some things into the apparent strength if it can last that long, I have to estimate a large amount two days in advance unfortunately.
Right now shares Ive watched are pretty flat to me apart from the volatile banks, Barc lost 50p, but regained about half continuing today
Higher red bar is a significant price. If you turn your head and look at it as a rollercoaster thats my master analysisVolume by price
So vs market momentum, we have peaks and troughs through which it may gain or lose speed, I cant say what will prove the initial push or in which direction but I see it as underlying terrain
Its surprising how fast we move through some prices for various reasons, this volume guide is one of the maps to that
Tony is going to have a fit when he sees all these stupid graphs :laugh:
vwap is volume weighted by price, a nice moving average. Our present price above this indicates a positive market.
The faint bars are the volume by price, seperated out we see the lows of today were not that important really. Higher volume at the lows would be worrying but for now 109.8 and above seems to hold the most significance to buyers and sellers0
![[Deleted User]](https://us-noi.v-cdn.net/6031891/uploads/defaultavatar/nFA7H6UNOO0N5.jpg)


 < A channel bounce scenario
This discussion has been closed.
Confirm your email address to Create Threads and Reply

Categories
- All Categories
- 355.1K Banking & Borrowing
- 254.7K Reduce Debt & Boost Income
- 455.8K Spending & Discounts
- 247.9K Work, Benefits & Business
- 605K Mortgages, Homes & Bills
- 178.8K Life & Family
- 262.7K Travel & Transport
- 1.5M Hobbies & Leisure
- 16.1K Discuss & Feedback
- 37.7K Read-Only Boards