We’d like to remind Forumites to please avoid political debate on the Forum.
This is to keep it a safe and useful space for MoneySaving discussions. Threads that are – or become – political in nature may be removed in line with the Forum’s rules. Thank you for your understanding.
📨 Have you signed up to the Forum's new Email Digest yet? Get a selection of trending threads sent straight to your inbox daily, weekly or monthly!
Doom scrolling and the next financial crash!
Comments
-
There's an interesting article from John Bogle (https://johncbogle.com/speeches/JCB_Morningstar_6-02.pdf ) that looks at large vs small cap (the graphs are on page 4 of the article). He noted that "Virtually the entire small-cap advantage took place during the first 18 years", i.e., from 1928-1946. He also noted that "On balance, these to-and-fro reversions have cancelled each other out, and since 1945 [until 2001 - the end of the period he looked at] the returns of large-cap stocks and small-cap stocks have been virtually identical (12.7% vs. 13.3%). So ask yourself whether the evidence to justify the claim of small-cap superiority isn’t too fragile a foundation on which to base a long-term strategy."
In other words, the historical small cap advantage has been very period dependent.
FWIW, I hold a small amount (just under 10% of my portfolio) of global small cap that may disappear next time I make the effort to further simplify my holdings.
3 -
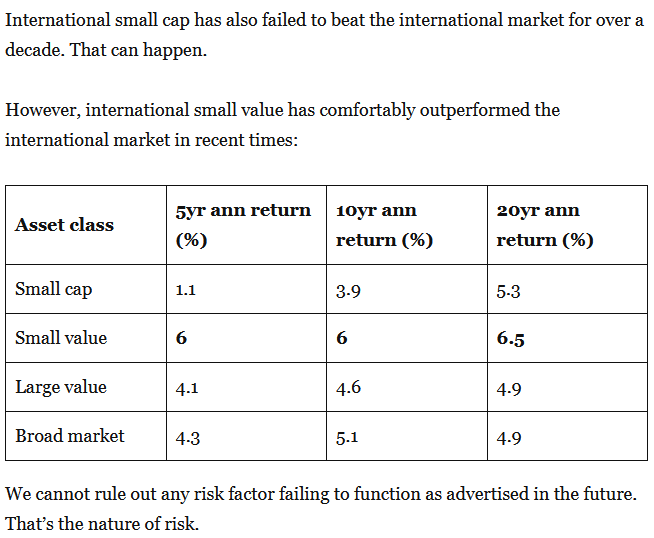
But that is small cap, not small cap value. Monevator's author shows that small cap without value doesn't show the same outperformance.
As the Bogle article is from 2002, I'll post this Monevator graph which addresses the years since:
 0
0 -
Here is 2003 to 2026 (perhaps someone can fill the gap):
Almost identical performance.
It does not look worthwhile paying for small cap exposure. It should save money by swapping my 0.9*VEVE + 0.1*VFEM for VALL (which includes both small cap and Emerging Markets).
I was considering swapping some Vanguard Developed World ex UK for VSML to bring my small cap exposure up to market weight. That is questionable. VSML is not cheap. Replacing the Vanguard Developed World ex UK with VALL is better on cost grounds.
"Small cap" is not tiny, but perhaps it is higher risk nonetheless. Adding small cap to dilute the mega caps? I am not an active investment believer. If it was free, I could justify adding a full market weight. If it costs, I think I will pass. If I pass, I will have about half the small cap market weighting. That is good enough.
0 -
Diversification is my over-riding strategic objective. This is to provide some protection against under-performance not as a search for hidden outperformance. Basing investment decisions on a historic failure to outperform could rule out a large part of the global economy.
The main problem I have found is achieving a sensible allocation to medium sized companies. Index trackers naturally focus on very large ones whereas small company funds do not seem to regard the mid range as part of their remit. I solve the problem by including a relatively small allocation to US and European Equal Weight funds.
1 -
Not quite like with like. FTSE includes EMs, MSCI does not. There are also a couple of countries FTSE but not MSCI considers developed, I think South Korea and Poland.

Diversification is my over-riding strategic objective. This is to provide some protection against under-performance not as a search for hidden outperformance. Basing investment decisions on a historic failure to outperform could rule out a large part of the global economy.
Completely understandable not to delve into remote corners of the investment universe to find something that promises (small p) outperformance if you wait enough decades. Perhaps I would not have been tempted if the Monevator articles hadn't appeared soon after I sold my last three actively managed funds and missed that little frisson of risk…
 1
1 -
Not quite like with like. FTSE includes EMs, MSCI does not. There are also a couple of countries FTSE but not MSCI considers developed, I think South Korea and Poland.
Yes that is right. I have managed to extract the numbers for MSCI World Small Cap and MSCI World from the same website.
MSCI World Small Cap
Jul 2026 78,232
Dec 2000 10,384
Gain = 7.533898MSCI World
Jul 2026 964,712
Dec 2000 189,115
Gain = 5.010192Never believe Google AI. The small caps outperformed by about 1.5% on an annualised basis. The MSCI small caps are about 14% of the all caps. Adding a market weight of the small caps would have boosted performance by about 0.18% pa. In my case, adding the second half a market weight would have boosted performance by about 0.09% pa. There is a good case for doing that.
0 -
The start (and end) dates are critical - 2000 was at the end of the 1990s run up and just before the dotcom crash so not a good place to start for MSCI world.
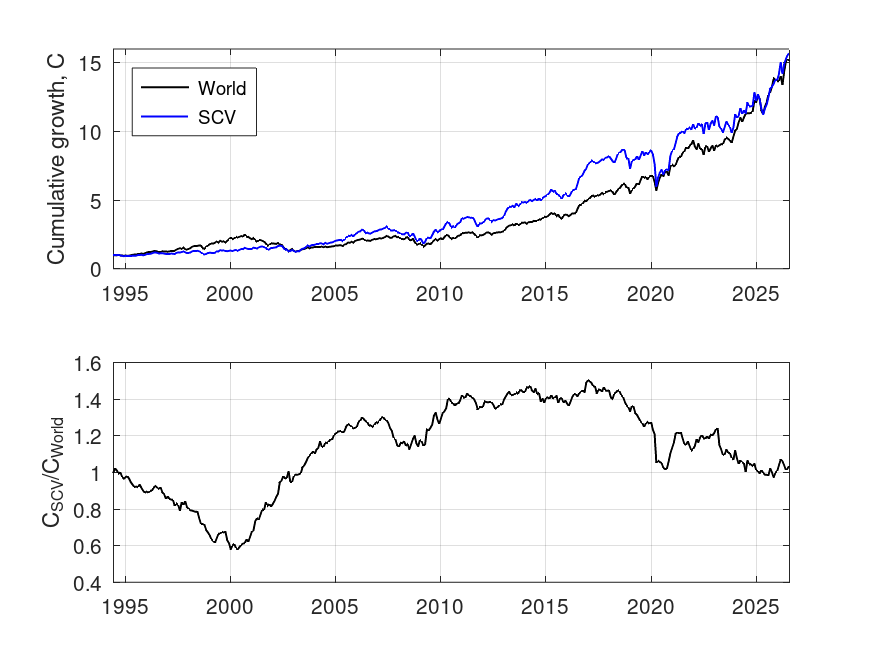
The top panel of the following figure shows the cumulative growth of MSCI world and MSCI world small cap value (raw data from https://curvo.eu/backtest/en/compare-indexes/msci-world-vs-msci-world-small-cap-value?currency=gbp ) from May 1994 to end of July 2026. Over that period, they provided roughly the same growth (annualised returns of 8.81% and 8.93% for world and SCV, respectively). The lower panel shows the ratio of the cumulative growth of SCV to world (i.e., a telltale chart). The first 6 years to about 2000 show world outperforming SCV during the 1990s run up (i.e., negative gradient) - the next 6 or so years were very good for SCV (positive gradient) and the next 6 years to 2012 continued to be moderately good for SCV (the gradient was still positive, but less steep). The period from 2012 to 2018 or so was pretty even (the gradient was close to zero), while after 2018, world has outperformed SCV bringing the overall growth over the entire period to about even.
Of course, over this period, a mix of the two would have provided a smoother ride to the same point which is also a useful goal.
1 -
The start (and end) dates are critical - 2000 was at the end of the 1990s run up and just before the dotcom crash so not a good place to start for MSCI world.
The top panel of the following figure shows the cumulative growth of MSCI world and MSCI world small cap value (raw data from https://curvo.eu/backtest/en/compare-indexes/msci-world-vs-msci-world-small-cap-value?currency=gbp ) from May 1994 to end of July 2026.
I was not able to find prices for MSCI World going back further than 2000. I would not consider adding small cap value to my portfolio. The conclusion that I drew from MSCI Small Cap and MSCI World was not that small cap is likely to outperform, but perhaps a market weight would add a meaningful amount of diversification. Overweighting some of the small cap stock stocks, on the other hand, would reduce my diversification.
0 -
"Of course, over this period, a mix of the two would have provided a smoother ride to the same point which is also a useful goal."
That was my primary motivation for including a slice. Having no other exposure to small caps in general, it also addressed that to some extent.
0 -
Small Cap Indexes tend to have lower tech percentages than whole equity market indexes and so right now I'm pro them.
US Vanguard Small Cap Index (VSMAX) has 14% tech while US Vanguard Total Market Index (VTSAX) has 40% tech. I'm far less interested in the historical comparison between small cap and large cap where tech has been a smaller factor. The conversation over small vs large is old and ongoing, but the current bias of large cap indexes to tech is new and potentially very disruptive.
And so we beat on, boats against the current, borne back ceaselessly into the past.0








Confirm your email address to Create Threads and Reply

Categories
- All Categories
- 355.8K Banking & Borrowing
- 254.9K Reduce Debt & Boost Income
- 456.2K Spending & Discounts
- 248.3K Work, Benefits & Business
- 605.9K Mortgages, Homes & Bills
- 179K Life & Family
- 263.8K Travel & Transport
- 1.5M Hobbies & Leisure
- 16.2K Discuss & Feedback
- 37.7K Read-Only Boards