We’d like to remind Forumites to please avoid political debate on the Forum.
This is to keep it a safe and useful space for MoneySaving discussions. Threads that are – or become – political in nature may be removed in line with the Forum’s rules. Thank you for your understanding.
📨 Have you signed up to the Forum's new Email Digest yet? Get a selection of trending threads sent straight to your inbox daily, weekly or monthly!
The Forum now has a brand new text editor, adding a bunch of handy features to use when creating posts. Read more in our how-to guide
Premium bonds for long term returns are absolutely terrible in respect to a stock index fund.
Comments
-
As ever it's horses for courses, so yes, I've maxed out my S&S ISA this year from accumulated savings and now will do the same next year too, courtesy of an inheritance, although to be honest I'd rather still have my mum..Then I shall max out out PBs before deciding what to do with the rest, and they are easily retrievable if I want to do something major like an extension to the house. A bit of fun into the bargain with less at risk than online betting or Ladies Day at Goodwood or even the punt I took on some shares for a company which went bust - thanks Rupert Lowe..;-) Back in the day post war dad lost money on Butlins Bahamas (!).To be honest my best two investment decisions were solar panels years ago for which I raided a virtually non-performing cash ISA, and putting as much as possible into the company share scheme when I last had a regular salary.PBs are just part of diversification and I'm not sure trying to show off your maths and chart reading skills does much to enlighten us all.0
-
[Deleted User] said:
I see what you're getting at but for this hypothetical, we have to use existing past data. So you look back through the life time of the index fund, in the case of MSCI world index and take the absolute worst year and the absolute best year and make those your limits. So a -100% return has a 0% chance because it's never happened.Linton said:
With coin tosses there is the obvious underlying probability of 50% which will be approached as the number of tosses approaches infinity.[Deleted User] said:
Yes the probably of getting exactly 2000 heads and 2000 tails is low, but the probably of getting very close to those figures is extremely high.masonic said:[Deleted User] said:I don't follow. If flipping a coin averages at 50% heads or tails. Then over a long period of flips the probability of getting 50% heads and 50% tails becomes very close to 100%.Incorrect. Suppose you flip a coin 4000 times. The probability of getting exactly 2000 heads is just 1.26%. The probability of fewer than 2000 heads is 49.37% and the probability of greater than 2000 heads is 49.37%. This seems to be the root cause of your misunderstanding.With investment returns, the standard deviation is quite large, so the range of possible, or even likely, outcomes over a 20 year period might surprise you.
I just did a simulated coin flip and first try got extremely close to 50% / 50%
I bet you could run this simulator all day and you'd get 50% / 50% give or take 1% either way. So applying that to the 7.7% return for 20 years would give you an expected multiple 5.46x your money. But in reality it's probably somewhere in the region of 4.5x - 6.6x. Getting smack bang on 5.46x would be really unlikely.
With a coin toss the number of possible outcomes is 2 - either heads or tails. With investments the return could be anywhere between -100% and plus some undefined large % . Is there an obvious underlying probablility of some particular investment return over an extended time period? If so what time period would be meaningful in determining its value without the result being compromised by shorter term events? We can see for example that 20 years is not sufficient. Is a lifetime sufficient? If not does the average matter?
My second point is that a coin tossed today will have the same expected result in say 100 years time. Can the investment returns of say 200 years ago be usefully compared with those of today? Or do changes in technology and the global economic environment affect average returns? If they do there is no meaningful future average return.
So in summary it seems to me that in practice assuming any particular average return can be very misleading. With investing you have to accept that the future is unknown.
Having a quick look at MSCI returns by year I can see that the best year was 42.8% and the worst year was -40.33% so we use those as the limits.
How does that affect the overall probability? Maybe it doesn't I dunno I'm totally lost at this point haha.That bit in bold isn't sound logic. Things are continuously happening for the first time ever and for the most part they do not have a probability of zero. Global stocks going to zero is vanishingly unlikely, but markets reaching a new, never before seen high, is rather likely.Historically, it is possible to do cumulatively worse than -40% over a period greater than one year. But over a 20 year period there would also be some upside captured.2 -
This is where the maths throws many people. If your £100 of capital has fallen to £59.67p. Then to recover to £100 again. It requires a rise of 67.58%. That's just to breakeven. Why it's equally as important not to lose capital permanently. Investing isn't just about making gains. Many investors have never encountered sustained volatility or a prolonged period of market recovery after a correction in their lives.[Deleted User] said:
Having a quick look at MSCI returns by year I can see that the best year was 42.8% and the worst year was -40.33% so we use those as the limits.
How does that affect the overall probability? Maybe it doesn't I dunno I'm totally lost at this point haha.5 -
That is very true, and right now there is a whole generation of virgin investors being tempted into the market by numerous glitzy TV adverts - eToro, AJ Bell etc. It probably won't end well. ;pHoenir said:
Many investors have never encountered sustained volatility or a prolonged period of market recovery after a correction in their lives.1 -
...and we're back to Zvi Bodie. Sorry he's American, but maybe someone can point to a UK equivalent ie someone who advocates a base of income from things like index linked gilts and only then looking at higher risk things like equities.boingy said:
That is very true, and right now there is a whole generation of virgin investors being tempted into the market by numerous glitzy TV adverts - eToro, AJ Bell etc. It probably won't end well. ;pHoenir said:
Many investors have never encountered sustained volatility or a prolonged period of market recovery after a correction in their lives.
The contrast that the OP pointed to between Premium Bonds and Equity funds is exactly why they (or their like) both have a place in most portfolios.And so we beat on, boats against the current, borne back ceaselessly into the past.1 -
Bought 1k of premium bonds today...more for lottery aspect than sensible investing measure...a bit of a flutter0
-
boingy said:
That is very true, and right now there is a whole generation of virgin investors being tempted into the market by numerous glitzy TV adverts - eToro, AJ Bell etc. It probably won't end well. ;pHoenir said:
Many investors have never encountered sustained volatility or a prolonged period of market recovery after a correction in their lives.
From an investment sense, nor would I think lottery/gambling adverts are likely to end well either 0
0 -
Just to clarify - are you suggesting that someone with £50k in Premium Bonds has a 60-70% chance of winning an average of £9k PA or does that £180k total prize figure include the effect of investing the winnings elsewhere over that 20 year period ?[Deleted User] said:So if you have £50,000 in premium bonds and left it there for 20 years, the probability of all your collective wins over that period of time amounting to at least £180,000 (£180,000 wins + initial £50,000 initial deposit = £230,000 total) is 60% - 70%.
0 -
I like the tax free benefit of premium bond.
At first did not think it was wise but trying it for the first month.0 -
The following two graphs are a rough attempt to model the situation (technical details and limitations below*)
The following graph shows the probability of a return as a function of return (in %) for a single year (top panel) and for 20 years (lower panel) with equities in black and PB in blue. As expected, the range of outcomes is much greater for equities with results after 20 years falling between 0 and 1000%.
The cumulative probability graphs below allow an estimate of how often PB would beat equities over a year or over 20 years, by looking at the probability when they cross. For a 1 year holding, they cross at a probability of a shade over 40% (which is why equities are 'risky' for short periods). For a 20 year holding period, the crossover occurs at just under 28% (i.e., PBs could out perform equities over a 20 year period)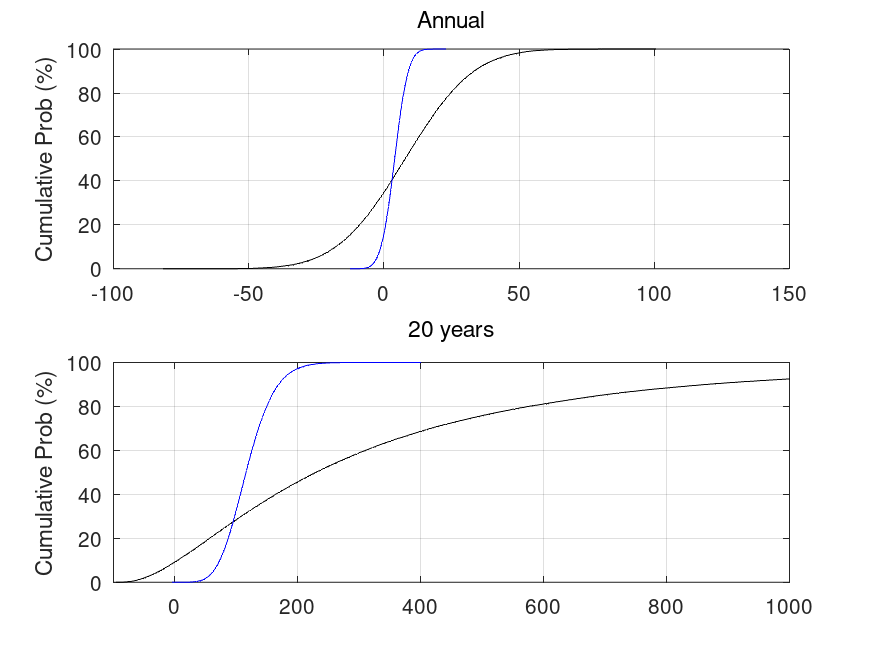
* Technical details. Normal distributions of annual returns have been generated with a mean of 1.08 (i.e. 8%, I note that 10% could be used) and standard deviation of 0.2 (i.e., 20% - based on long run US data rather than shorter period MSCI world, where it is 15%) for equities and mean of 1.04 (i.e. 4%) and standard deviation of 0.04 (also 4%) for PB. 20x100000 individual returns have been generated for each distribution (giving 100000 separate 20-year periods).
Limitations
- While I've used a normal distribution, it should probably be lognormal instead (this would prevent negative annual returns for PBs and negative annual returns below 100% for equities).
- I've assumed PB returns are compounded (which cannot be the case for a full holding). I've assumed that the interest rate can vary as well as the variability in PB outcomes (hence a larger standard deviation than cash).
1


Confirm your email address to Create Threads and Reply

Categories
- All Categories
- 354.6K Banking & Borrowing
- 254.5K Reduce Debt & Boost Income
- 455.5K Spending & Discounts
- 247.5K Work, Benefits & Business
- 604.4K Mortgages, Homes & Bills
- 178.6K Life & Family
- 261.9K Travel & Transport
- 1.5M Hobbies & Leisure
- 16.1K Discuss & Feedback
- 37.7K Read-Only Boards