We’d like to remind Forumites to please avoid political debate on the Forum.
This is to keep it a safe and useful space for MoneySaving discussions. Threads that are – or become – political in nature may be removed in line with the Forum’s rules. Thank you for your understanding.
📨 Have you signed up to the Forum's new Email Digest yet? Get a selection of trending threads sent straight to your inbox daily, weekly or monthly!
The Forum now has a brand new text editor, adding a bunch of handy features to use when creating posts. Read more in our how-to guide
Premium bonds for long term returns are absolutely terrible in respect to a stock index fund.
Comments
-
Thanks for this it's a good way to see it. However right at the bottom of your post you said "'ve assumed PB returns are compounded (which cannot be the case for a full holding). I've assumed that the interest rate can vary as well as the variability in PB outcomes (hence a larger standard deviation than cash)."OldScientist said:The following two graphs are a rough attempt to model the situation (technical details and limitations below*)
The following graph shows the probability of a return as a function of return (in %) for a single year (top panel) and for 20 years (lower panel) with equities in black and PB in blue. As expected, the range of outcomes is much greater for equities with results after 20 years falling between 0 and 1000%.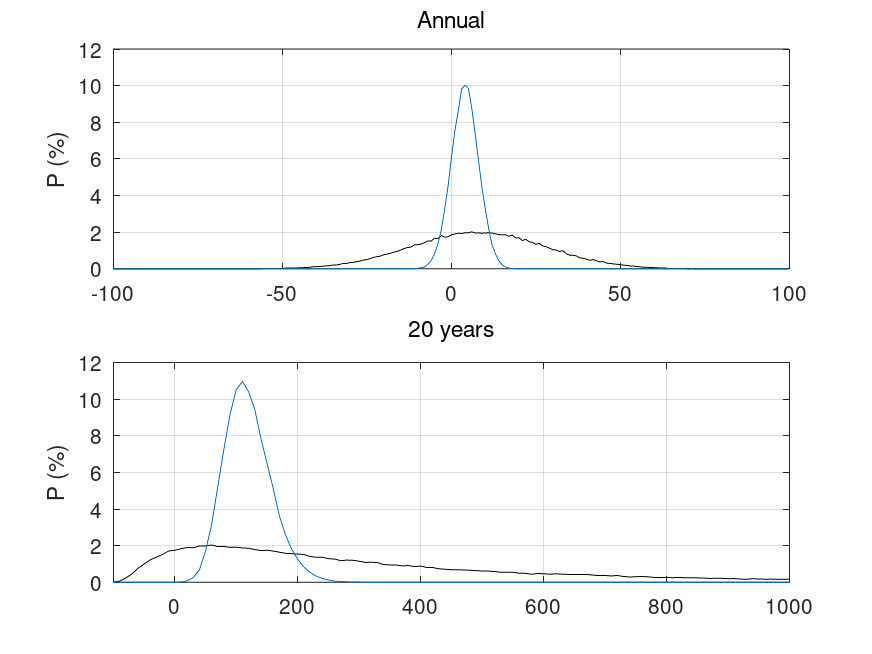
The cumulative probability graphs below allow an estimate of how often PB would beat equities over a year or over 20 years, by looking at the probability when they cross. For a 1 year holding, they cross at a probability of a shade over 40% (which is why equities are 'risky' for short periods). For a 20 year holding period, the crossover occurs at just under 28% (i.e., PBs could out perform equities over a 20 year period)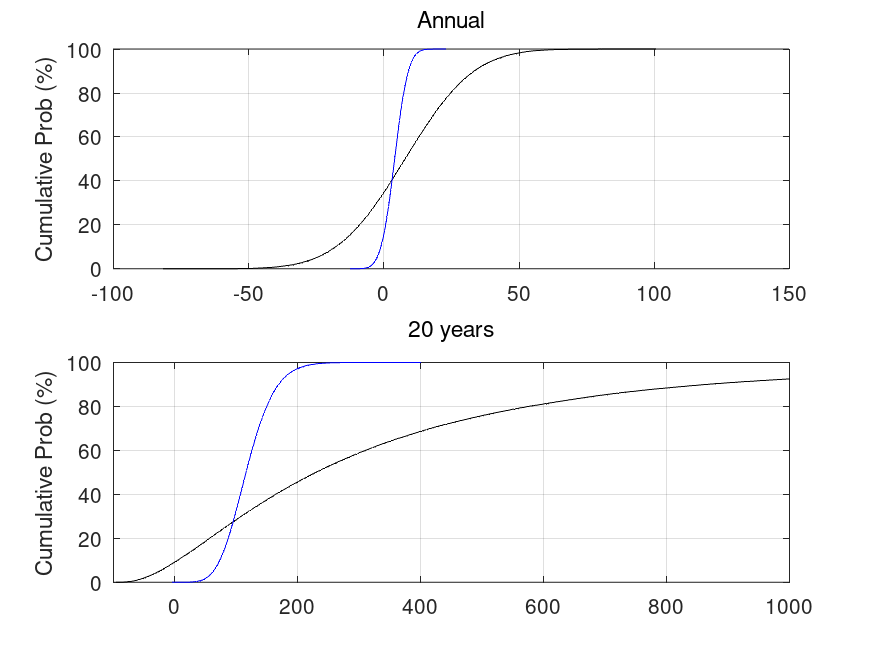
* Technical details. Normal distributions of annual returns have been generated with a mean of 1.08 (i.e. 8%, I note that 10% could be used) and standard deviation of 0.2 (i.e., 20% - based on long run US data rather than shorter period MSCI world, where it is 15%) for equities and mean of 1.04 (i.e. 4%) and standard deviation of 0.04 (also 4%) for PB. 20x100000 individual returns have been generated for each distribution (giving 100000 separate 20-year periods).
Limitations
- While I've used a normal distribution, it should probably be lognormal instead (this would prevent negative annual returns for PBs and negative annual returns below 100% for equities).
- I've assumed PB returns are compounded (which cannot be the case for a full holding). I've assumed that the interest rate can vary as well as the variability in PB outcomes (hence a larger standard deviation than cash).
But since the return on premium bonds cannot be compounded, £50k is the limit, I think it's not a good idea to included compounding in the graph, if that is indeed what you've done?0 -
I did include the compounding on the grounds that otherwise it is not a fair test since the equity returns will include reinvested dividends. However, I agree that with a full holding, PB winnings cannot be invested in additional PB, but, assuming they are not spent, they have to be invested somewhere.[Deleted User] said:
Thanks for this it's a good way to see it. However right at the bottom of your post you said "'ve assumed PB returns are compounded (which cannot be the case for a full holding). I've assumed that the interest rate can vary as well as the variability in PB outcomes (hence a larger standard deviation than cash)."OldScientist said:The following two graphs are a rough attempt to model the situation (technical details and limitations below*)
Limitations
- While I've used a normal distribution, it should probably be lognormal instead (this would prevent negative annual returns for PBs and negative annual returns below 100% for equities).
- I've assumed PB returns are compounded (which cannot be the case for a full holding). I've assumed that the interest rate can vary as well as the variability in PB outcomes (hence a larger standard deviation than cash).
But since the return on premium bonds cannot be compounded, £50k is the limit, I think it's not a good idea to included compounding in the graph, if that is indeed what you've done?
1 -
Caveats or not, it is nice to see visually what was being described in words much earlier in the thread.For most, if the PB winnings were reinvested in the best rolling 1 year fix or actively moved between top easy access accounts, the median return would be slightly better and the distribution slightly narrower.1
-
"Limitations
- While I've used a normal distribution, it should probably be lognormal instead (this would prevent negative annual returns for PBs and negative annual returns below 100% for equities)"
That's certainly needed for the one year graph, to stop the -ve returns for PBs. Here's the results of a simulation I did for holding for 5 years - you can also see a small chance of bigger winnings, if you get lucky with a larger prize (winnings, not reinvested, on X axis, number of times a precise amount (so in steps of £25) happened on the Y axis:
1
![[Deleted User]](https://us-noi.v-cdn.net/6031891/uploads/defaultavatar/nFA7H6UNOO0N5.jpg)


Confirm your email address to Create Threads and Reply

Categories
- All Categories
- 354.6K Banking & Borrowing
- 254.5K Reduce Debt & Boost Income
- 455.5K Spending & Discounts
- 247.5K Work, Benefits & Business
- 604.4K Mortgages, Homes & Bills
- 178.6K Life & Family
- 261.9K Travel & Transport
- 1.5M Hobbies & Leisure
- 16.1K Discuss & Feedback
- 37.7K Read-Only Boards