We’d like to remind Forumites to please avoid political debate on the Forum.
This is to keep it a safe and useful space for MoneySaving discussions. Threads that are – or become – political in nature may be removed in line with the Forum’s rules. Thank you for your understanding.
📨 Have you signed up to the Forum's new Email Digest yet? Get a selection of trending threads sent straight to your inbox daily, weekly or monthly!
What's your portfolio?
Comments
-
I think it also depends which data you use.......MSCI World, for instance, covers only the 23 "developed" countries (according to them at least), and only large and mid cap companies......the US represents about 68% of that. Their All Countries World Index adds 24 "emerging market" countries, but still only large/midcaps (in each market)......the US represents about 62% of that. You also have to consider that what is classed as a large company in an emerging market, might be smaller than companies classed as small cap in the US (and which are hence not included in the above indices). Still, even c62% is a lot different to 42.5%.........the FTSE Global All Cap Index also weights the US at 62%.
In the end, each needs to decide their own allocations, but one other consideration is that many global index funds have c96% of their holdings in non-sterling currencies.......can work in your favour (as it has in the last decade or so), but coukd easily work the other way too.......no way to know today, but it's another risk factor to consider.
As for China, could it be to do with "free float" market caps?0 -
The graph shows my current portfolio, not what happened over time. The results difference is mainly due to the time periods.. My graph starts at the earliest possible date and so is just over 5 years. Also the S&P 500 fund should have been Acc.aroominyork said:I was astonished by your performance given the US underweight, MINV having risen only 27% in five years, and EMs not having a good five years so I did a quick spreadsheet (figures from HL charts and estimating Kraneshares as Vanguard All Cap's rise) and got 58.48%. I assume you made some profitable changes during the five years?Holding 5 years Fidelity European W Acc 15% 59.97% 9.00% Fidelity UK Smaller Companies W Acc 5% 58.36% 2.92% iShares MSCI World Minimum Volatility ETF(MINV) 20% 27.64% 5.53% Janus Henderson European Small Companies I Acc 6% 48.20% 2.89% **Kraneshares MSCI China Clean Tech ETF 1% 64.17% 0.64% M&G Global Emerging Marketa I Acc 12% 25.52% 3.06% M&G Japan Smaller Companies Sterling I Acc 5% 71.58% 3.58% Matthews Asia Small Coms I Acc 7% 84.10% 5.89% T Rowe Price US Smaller Companies C Acc 11% 62.25% 6.85% Vanguard S&P 500 UCITS ETF Inc 18% 100.69% 18.12% 100% 58.48% Vanguard FTSE Global All Cap 64.17%
But we are talking noise really. An MSCI Global tracker outperforms both funds in that period to a greater extent than the difference between VFGAC and my portfolio.
It is interesting that you find the results “astonishing”. My belief is that the advocates of simple trackers and minimising costs overstate their case. Once you get into objectives other than simple long term performance the situation is far more nuanced and would justify more research.0 -
Having attempted to recreate Linton's portfolio from the list provided as closely as possible (had to exclude the China Clean Tech ETF as it only had a 3 year history - assuming I have the right one), the 5 year performance numbers match up more closely with aroominyork's:
 But reality will differ because presumably some rebalancing takes place within the real Linton portfolio, otherwise 5 years ago there would have been even less S&P500 and quite a bit more of MINV.Overall it looks like it has worked well as a VFGAC proxy with a reduced FE risk score and different sectoral balance. What it has lost through reduced US exposure, it has gained through smaller companies exposure and active management within the smaller companies space. It isn't surprising that the small cap risk premium can be better harvested through a non-cap weighted approach, since the largest small companies dominating a cap-weighted approach will not command much of a risk premium.Personally, all of my small cap exposure is gained via active funds (ITs) too.1
 -
I retired aged 56 in 2021 and will get a DB pension which I plan to put into payment in about 6 years time. I have valued it into my portfolio based on it's surrender value, but I don't intend to sell it. Also included my house (no mortgage left to pay), which in effect increases my income by me not having to pay rent. With these factored in, my portfolio would be:Cash 6%Property 21%Investments 32% (approximately 40/60 shares/bonds)DB Pension 40%Retired 1st July 2021.
This is not investment advice.
Your money may go "down and up and down and up and down and up and down ... down and up and down and up and down and up and down ... I got all tricked up and came up to this thing, lookin' so fire hot, a twenty out of ten..."0 -
masonic said:
Yes I agree with your analysis. My graph is based on buying my current units/fund in 2023 and then not rebalancuing, either forwards or backwards. Whether the actual would have been better or worse had I bought when the funds becoame available and rebalanced since then I have no idea. Though rebalancing is not a major activity and need not be done every year.Having attempted to recreate Linton's portfolio from the list provided as closely as possible (had to exclude the China Clean Tech ETF as it only had a 3 year history - assuming I have the right one), the 5 year performance numbers match up more closely with aroominyork's:But reality will differ because presumably some rebalancing takes place within the real Linton portfolio, otherwise 5 years ago there would have been even less S&P500 and quite a bit more of MINV.Overall it looks like it has worked well as a VFGAC proxy with a reduced FE risk score and different sectoral balance. What it has lost through reduced US exposure, it has gained through smaller companies exposure and active management within the smaller companies space. It isn't surprising that the small cap risk premium can be better harvested through a non-cap weighted approach, since the largest small companies dominating a cap-weighted approach will not command much of a risk premium.Personally, all of my small cap exposure is gained via active funds (ITs) too.
I am currently investigating where the difference between your/aroominyork's figures and mine comes from. We will see. One area could have been to do with the confusion between in S&P500 Inc and Acc funds. I accidentally had bought the Inc fund but have tried to change the allocation to correct the data in the graphs to a purchase of the intended Acc fund.
But these are really minor matters. If you chose a different timescale you could get numbers either way. My point is that as you say in performance terms it has worked well as a VGFAC proxy. This is during a time when actual economic events should have favoured VGFAC.
The intention was to illustrate my wider points on the relative unimportance of the allocations to countries/sectors etc.0 -
There's going to be all sorts of errors that will creep in due to minor differences, interestingly the Acc version of the S&P500 ETF does differ rather more than I assumed it would:
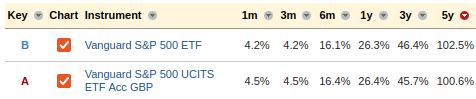 It doesn't help that Trustnet has one under "Vanguard" and the other under "Vanguard Group (Ireland) Limited", making it difficult to find the other. So on an 18% holding that will account for about 0.4% of the discrepancy. The rest could easily just be the result of us taking rounded percentages rather than exact numbers of units.0
 -
Well I'm sure everyone will say mine is completely wrong.
SIPP & Company Pension
City of London investment trust 78%
Royal London Global 9%
Bankers Investment trust 5.3%
Scottish Mortgage Investment trust 4.2%
BAE 3.2%
0 -
It would only be wrong if it were unsuitable for your objectives and risk tolerance.greenwood132 said:Well I'm sure everyone will say mine is completely wrong.
0 -
VTSAX (US Equity Index) 59%
VTIAX (International Equity Index) 24%
VWIAX (Wellesley Income Fund) 11%
Cash 3%
TIAA Traditional Annuity (Fixed Income) 3%And so we beat on, boats against the current, borne back ceaselessly into the past.0 -
It does pretty much what I set out to do. I saved for years into CTY with a goal of creating a £12k income and now I've achieved it I'm building positions in BNKRS and SMT to give me more global coverage and take advantage of current discounts.masonic said:
It would only be wrong if it were unsuitable for your objectives and risk tolerance.greenwood132 said:Well I'm sure everyone will say mine is completely wrong.0


Confirm your email address to Create Threads and Reply

Categories
- All Categories
- 354.9K Banking & Borrowing
- 254.6K Reduce Debt & Boost Income
- 455.7K Spending & Discounts
- 247.7K Work, Benefits & Business
- 604.7K Mortgages, Homes & Bills
- 178.7K Life & Family
- 262.4K Travel & Transport
- 1.5M Hobbies & Leisure
- 16.1K Discuss & Feedback
- 37.7K Read-Only Boards