We’d like to remind Forumites to please avoid political debate on the Forum.
This is to keep it a safe and useful space for MoneySaving discussions. Threads that are – or become – political in nature may be removed in line with the Forum’s rules. Thank you for your understanding.
Tesla Developments
Comments
-
Mining copper is any better that extracting oil?Magnitio said:There are so many reasons why we need to reduce our reliance on oil and transition to more sustainable forms of transport. The debate should be about how we improve efficiency, infrastructure, recyclability, safety and help people with this transition.0 -
They are cumulative totals, not per year/mile figures. The EV has a higher cumulative total at zero miles than an ICE, but ongoing it causes vastly lower emissions, so it's lifetime emissions are less at around 12k miles. The original graph is correct, you are incorrect.JKenH said:Without getting into an argument about the figures in the Carbon Brief report I thought I could use one of their graphs (modified) to help explain the point I was making earlier about the deferred payback of carbon debt.
Here is the original CB graph for reference
I have modified it below to demonstrate my argument. What I am suggesting is that the carbon debt from manufacturing the EV is not paid back when the two lines cross at 13k miles but at a later point when the yellow area equals the red area. Those of you familiar with graphical representations will recognise it is the area under the curve which is actually important rather than the lines themselves. With CO2 what we put in the atmosphere stays there for 100 years as I explained area so the extra carbon emitted during manufacturing represented by the red area stays there until it is cancelled out by the higher emissions of the ICE car in the yellow area. Once we get into the green area the extra carbon debt has been repaid and the EV continues to save emissions. Break even is where the yellow area meets the green area. Exactly where we draw the lines will depend on the assumptions about emission levels and mileage/time but there will always be red and yellow areas as well as greenThis is a simplification of course because the other factor is time. In this graph -10 to 0 is the mining and manufacturing phase. If there is a delay between completion of manufacture and putting the vehicle on the road there will be an extended red period which needs to be paid back. If I can draw this I will edit the post with a new graph.
HTH1 -
The actual mining part might be questionable. The difference is you have a practically infinitely recyclable product at the end of it. With fossil fuel you get to use it once and further damage the environment. Also, the biggest use for cobalt is the refining of oil, whereas the use of cobalt in batteries is declining as better chemistries are developed.Hoenir said:
Mining copper is any better that extracting oil?Magnitio said:There are so many reasons why we need to reduce our reliance on oil and transition to more sustainable forms of transport. The debate should be about how we improve efficiency, infrastructure, recyclability, safety and help people with this transition.1 -
Hi, if it helps, Visual Capitalist have many graphics to help us get a reference on the scale of materials we mine/extract. Here is the FF image for 2021:Hoenir said:
Mining copper is any better that extracting oil?Magnitio said:There are so many reasons why we need to reduce our reliance on oil and transition to more sustainable forms of transport. The debate should be about how we improve efficiency, infrastructure, recyclability, safety and help people with this transition.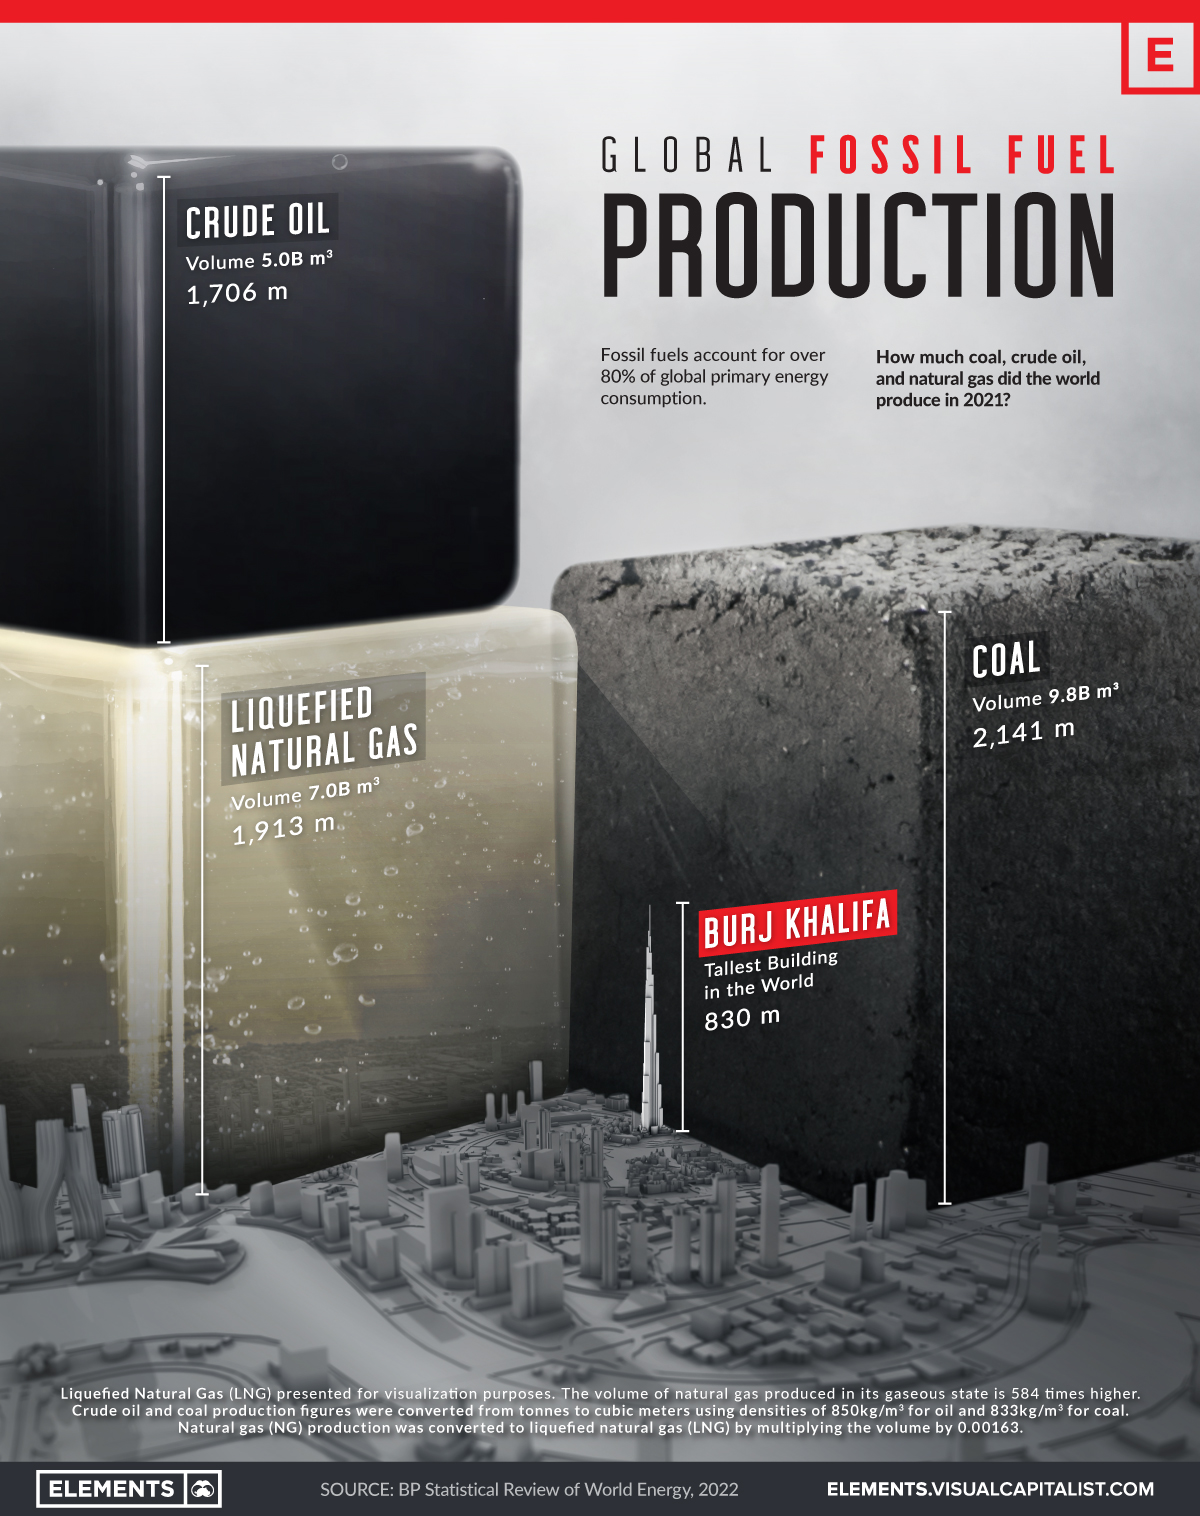
In tonnes the figures are:
Crude oil - 4.5bn
LNG - 3bn
Coal - 13bn
Here is the metals image for 2022:
Mart. Cardiff. 8.72 kWp PV systems (2.12 SSW 4.6 ESE & 2.0 WNW). 28kWh battery storage. Two A2A units for cleaner heating. Two BEV's for cleaner driving.
For general PV advice please see the PV FAQ thread on the Green & Ethical Board.2 -
Between my original post which you referenced above and your post appearing I had deleted my post as I wanted to think about it a bit more before reissuing it. I then went out to do some gardening and now have chance to complete my exercise. My amendments include an additional paragraph and my referring to the impact of the EV manufacturing phase on temperature rather than referring to it as purely as carbon debt debt.Yes, you are correct as is the CB graph but my point is it doesn’t tell the whole story. Hopefully this revised version will explain it better. I have also included another graph as promised to illustrate the impact of a delay in EVs being put into service.MattMattMattUK said:
They are cumulative totals, not per year/mile figures. The EV has a higher cumulative total at zero miles than an ICE, but ongoing it causes vastly lower emissions, so its lifetime emissions are less at around 12k miles. The original graph is correct, you are incorrect.JKenH said:Without getting into an argument about the figures in the Carbon Brief report I thought I could use one of their graphs (modified) to help explain the point I was making earlier about the deferred payback of carbon debt.
Here is the original CB graph for reference
I have modified it below to demonstrate my argument.What I am suggesting is that the carbon debt from manufacturing the EV is not paid back when the two lines cross at 13k miles but at a later point when the yellow area equals the red area. Those of you familiar with graphical representations will recognise it is the area under the curve which is actually important rather than the lines themselves. With CO2 what we put in the atmosphere stays there for 100 years as I explained area so the extra carbon emitted during manufacturing represented by the red area stays there until it is cancelled out by the higher emissions of the ICE car in the yellow area. Once we get into the green area the extra carbon debt has been repaid and the EV continues to save emissions. Break even is where the yellow area meets the green area. Exactly where we draw the lines will depend on the assumptions about emission levels and mileage/time but there will always be red and yellow areas as well as greenThis is a simplification of course because the other factor is time. In this graph -10 to 0 is the mining and manufacturing phase. If there is a delay between completion of manufacture and putting the vehicle on the road there will be an extended red period which needs to be paid back. If I can draw this I will edit the post with a new graph.
HTHWithout getting into an argument about the figures in the Carbon Brief report I thought I could use one of their graphs (modified) to help explain the point I was making earlier about the deferred payback of carbon debt.
Here is the original CB graph for reference

I have modified it below to demonstrate my argument.

What I am suggesting is that the impact from manufacturing the EV is not paid back when the two lines cross at 13k miles but at a later point when the yellow area equals the red area. Those of you familiar with graphical representations will recognise it is the area under the curve which is often actually more important rather than the lines themselves.
The payback period suggested by CB at 13k (their figure, not mine but let’s go with it as this is about the principle not the figure) is the point at which both the EV and ICE car have emitted the same amount of carbon dioxide to the atmosphere but, and it is a big but, that until that point is reached the CO2 “blanket” from the EV has been on average thicker and hence the warming effect has been greater. At around 13k miles we enter the yellow area of my graph and the blanket is now the same thickness but up to that point with the ICE car it would have been thinner and more heat will have escaped. It is only sometime afterwards that the temperature of the planet reaches the level it would have reached with the EV (transition to green area). This is the point at which the impact of the EVs greater carbon manufacturing cost is neutralised. Of course once we are past this later crossover point and into the green area the temperature will continue to rise with the ICE car emissions but fall slightly with EV emissions. I am talking purely about the impact of the battery here as in practice it probably will still rise (as it does in the CB graph) from emissions produced in generating electricity. The long term benefit of the EV is much greater but that crossover point isn’t quite as early as suggested by the CB graph.
Exactly where we draw the lines will depend on the assumptions about emission levels and mileage/time but there will always be red and yellow areas as well as green
This is a simplification of course because the other factor is time. In this graph -10 to 0 is the mining and manufacturing phase. If there is a delay between completion of manufacture and putting the vehicle on the road there will be an extended red period which needs to be paid back. If I can draw this I will edit the post with a new graph.
HTH
Edit: the impact of an EV being in transit/awaiting sale for a year. The excess CO2 phase from manufacturing is extended and because the extra thickness of the EV blanket has been in place longer the temperature will have risen more.

Northern Lincolnshire. 7.8 kWp system, (4.2 kWwest facing panels , 3.6 kWeast facing), Solis inverters installed 2018, 5kW SSE facing system (shaded in afternoon) added in 2025 with Tesla PW3 battery, Mitsubishi SRK35ZS-S and SRK20ZS-S Wall Mounted A2A Heat Pumps, ex Nissan Leaf owner.0 -
Your argument seems to predicated on global warming being cumulative - a bit like heating your home, the more hours you heat for the warmer the house. I thought it was more like choosing a duvet, put on a 4.5 tog summer duvet and you will be colder that night than had you put on the 10.5 tog all seasons duvet - regardless of which duvet you used last night.
I suspect the answer may be a bit of both, probably the land and atmosphere don't really retain huge amounts of heat energy but perhaps the oceans do.I think....0 -
The earth is constantly being heated by the sun. Our ever increasing blanket of CO2 is stopping heat being radiated back to space. The thicker the blanket gets, the less heat goes back to space and the planet gets warmer. That’s a simplified version. This video explains it in more detail.
https://youtu.be/oqu5DjzOBF8?si=QTUskBBWeI2z5jlu
My premise is that putting the blanket on earlier less heat escapes. Don’t get me wrong. In the longer term EVs are good but only because they displace CO2 from ICE cars. If we build too many and they stand around unsold that is bad, as is only doing a few thousand miles a year in a new EV. So is putting bigger batteries in cars than we need. (If a 50kWh battery will do the job we never will get payback from the extra CO2 put in to the atmosphere from a bigger battery.) We install bigger batteries for our convenience not for the benefit of the planet. The 24kWh battery in a Leaf is far better for the planet than a 75kWh battery.Northern Lincolnshire. 7.8 kWp system, (4.2 kWwest facing panels , 3.6 kWeast facing), Solis inverters installed 2018, 5kW SSE facing system (shaded in afternoon) added in 2025 with Tesla PW3 battery, Mitsubishi SRK35ZS-S and SRK20ZS-S Wall Mounted A2A Heat Pumps, ex Nissan Leaf owner.0 -
I'd argue that the 24kWh battery fitted to the Leaf was inadequate & likely to be responsible for the early demise of the vehicle. Many of the original 2013/14 Leafs are now only capable of 40-50 miles on a charge.JKenH said:The earth is constantly being heated by the sun. Our ever increasing blanket of CO2 is stopping heat being radiated back to space. The thicker the blanket gets, the less heat goes back to space and the planet gets warmer. That’s a simplified version. This video explains it in more detail.
https://youtu.be/oqu5DjzOBF8?si=QTUskBBWeI2z5jlu
My premise is that putting the blanket on earlier less heat escapes. Don’t get me wrong. In the longer term EVs are good but only because they displace CO2 from ICE cars. If we build too many and they stand around unsold that is bad, as is only doing a few thousand miles a year in a new EV. So is putting bigger batteries in cars than we need. (If a 50kWh battery will do the job we never will get payback from the extra CO2 put in to the atmosphere from a bigger battery.) We install bigger batteries for our convenience not for the benefit of the planet. The 24kWh battery in a Leaf is far better for the planet than a 75kWh battery.
A vehicle with a 300 mile range would likely still be serviceable after 250,000 miles even if that range had dropped to 210 miles. Based on average mileage that's around 25 years.
I had a quick look on Autotrader & the number of 24kWh Leafs making it past 125K miles is 1.4kWp (black/black) - Sofar Inverter - SSE(141°) - 30° pitch - North LincsInstalled June 2013 - PVGIS = 3400Sofar ME3000SP Inverter & 5 x Pylontech US2000B Plus & 3 x US2000C Batteries - 19.2kWh0 -
The problem with the early Leaves was the inadequate thermal management of the battery. And 40 to 50 miles range is still perfectly adequate for a local runaround, provided you can charge it at home.0


Confirm your email address to Create Threads and Reply

Categories
- All Categories
- 354K Banking & Borrowing
- 254.3K Reduce Debt & Boost Income
- 455.3K Spending & Discounts
- 247.1K Work, Benefits & Business
- 603.7K Mortgages, Homes & Bills
- 178.3K Life & Family
- 261.2K Travel & Transport
- 1.5M Hobbies & Leisure
- 16.1K Discuss & Feedback
- 37.7K Read-Only Boards