We’d like to remind Forumites to please avoid political debate on the Forum.
This is to keep it a safe and useful space for MoneySaving discussions. Threads that are – or become – political in nature may be removed in line with the Forum’s rules. Thank you for your understanding.
Challenge to Financial Advisers
Comments
-
Is that not irrelevant without reference to the earnings and profit level? Share price alone doesn't tell us much.Albermarle said:
I have just been reading a comparison between Nvidia and Cisco in 1999.
In both cases their share price went up 7 fold in less than 2 years. Then in 18 months Cisco shares went down 86%.1 -
It is a fair point, but my point is that share prices can get caught up in bubbles. Also being discussed here.NoviceInvestor1 said:
Is that not irrelevant without reference to the earnings and profit level? Share price alone doesn't tell us much.Albermarle said:
I have just been reading a comparison between Nvidia and Cisco in 1999.
In both cases their share price went up 7 fold in less than 2 years. Then in 18 months Cisco shares went down 86%.
It's beginning to look a lot like Christmas. 1999. — MoneySavingExpert Forum
0 -
A share price is future expectatations though. Earnings in the short term can be manipulated. Tesla a more recent example of investor FOMO rather than trading fundamentals.NoviceInvestor1 said:
Is that not irrelevant without reference to the earnings and profit level? Share price alone doesn't tell us much.Albermarle said:
I have just been reading a comparison between Nvidia and Cisco in 1999.
In both cases their share price went up 7 fold in less than 2 years. Then in 18 months Cisco shares went down 86%.0 -
To be fair the Magnificent 7 have a lot more solid financials than some of the internet stocks of 1999, so a full blown rout of Alphabet, Apple etc seems unlikely.
You are probably right for these companies, although it wasn't just the tech crash that caught investors out - I think of Enron for example (see https://en.wikipedia.org/wiki/Enron)

0 -
Thank you for all your comments. Let me first apologies for any perceived rudeness on my part in this thread, it was never meant as such. I'm just a newbie and sometimes get a little carried away! A sincere apology to anyone I've insulted personally.
Believe it or not I do have a lot of respect for you Financial Advisers. I know it's a tough world to survive in. I just wonder if you have been let down by a lack of access to the right technology.
My question really was "To what extent do Financial Advisers carry out quantitative analysis on the investment landscape before recommending portfolios to their clients?". That is not to disparage qualitative analysis, but such analysis should only come after quantitative analysis as a basis to digress from it, not as a means to give advice in and of itself.
I posed a simple challenge, one that any firm with decent analysis systems could easily plug in to produce a result. In all the responses, not only did I not get a single contender, I didn't even get a response suggesting that such systems exist.
If you're charging customers year after year 0.5% plus then you owe it to them to deliver value for money.
Many of you seem to think that I think I can predict the future and always pick portfolios to beat everyone else's. Of course that's not true. I get it wrong sometimes just like everyone else.
What I do, however, is an awful lot of analytical work to try to maximise my change of investing successfully. I do believe that,in that, science and mathematics can play a major role and that before anyone recommends a portfolio to anyone, at the very least, they need to be able to say
"I haven't chosen the mathematically most efficient portfolio based on 1,3,5,15 years of multivariate analysis, I've diverted from that because..(state your reason here)..and the difference, historically, in risk return is this....(state the difference here)".
If you diverge from the optimal portfolio then the difference will always be such that based on historical analysis the portfolio you are recommending is sub-optimal. But the customer at least deserves to know that and see the difference.
I have concerns that advisers don't carry out extensive quantitative analysis in the first place. Certainly not at a customer level and that's why I think the fees are a lot.
So, for the last time, this is what I do. Please don't ask me more questions, this will be my last post on this thread.
There are about 100,000 registered collative investment funds and ETFs in Europe (although only 15000 are sterling). I look at every one of them and I run the historic prices through an algorithm which boils down to a ratio of "a function of return divided by a function of risk".
My algorithm for return has the following components:- Straight return over the given period of time (1,3,5,10,15 years)
- Lowest return in any 1 year, over the past 3.5.10.15 years
- Lowest return over any 3 years, over the past 5.10.15 years
- Lowest return over any 5 years, over the past 10.15 years
- Average return for the same again..
- Same again for return relative to benchmark funds (funds in the same investment category)
- Same again for return relative to index funds (index funds in the same investment category)
I use this algorithm to rank each fund and each fund manager from the top percentile to the 100th percentile (worst). I do this for multiple time periods and multiple durations.
I then have an algorithm that weeds out funds which have had sporadic (inconsistent) performance over a significant period of time. To do this I have invented for myself a set of algorithms that target the problems.
When this analysis is complete I start to get picture of certain funds and certain fund managers which always seem to do well (always in terms of converting risk to return) no matter what the time period.
I then start to look at combinations of funds which fit together well. I do this using correlation matrices.
I then tend to apply my own qualitative rules like for example no long dated bonds, avoid, if possible, domestic equities etc.etc.
When finally deciding where to invest I then think of issues like liquidity requirements over 1-3 years 5,7 years and thereafter and a few other personal requirements required of my portfolio. Since I already own rental properties, I don't tend to buy property funds. They never appear in my top 50 of analysed funds anyway but they are good for diversification as they often don't correlate with equity funds even in a crash.
For long dated portfolios I tend to end up with about 5 funds maximum (more usually 4). It may surprise you to know that I never end up with more than 25% of index funds, typically bonds / property, never equities.
I then run these 4/5 funds through an Efficient Frontier model at multiple durations. To those who don't know what this means here's an example output: -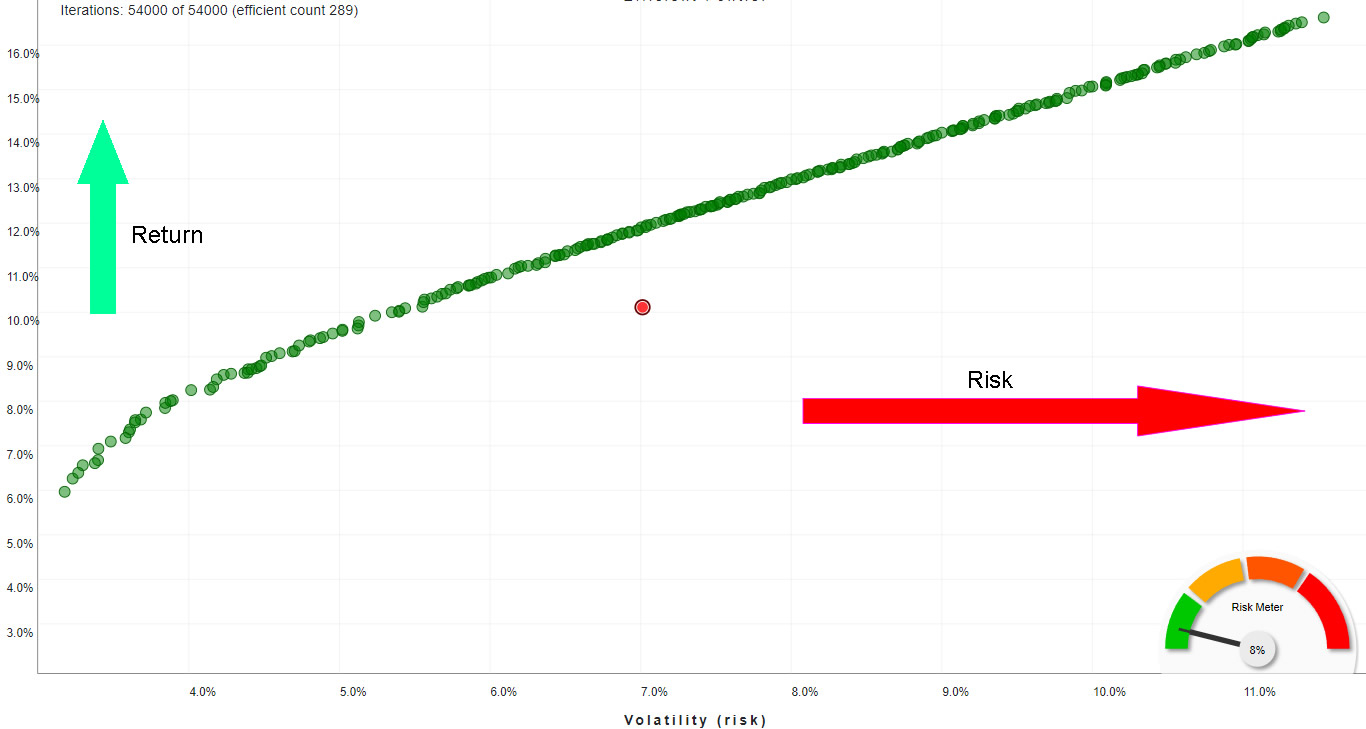
This is the output of 4 investment funds chosen by my methods above.
Risk is measured from east to west and return is measured from south to north.
Each green circle represents the optimal historic risk and return of a portfolio based on a specific spread of asset weightings.
The red circle is the risk / return of my input portfolio which is 25% invested in each fund. You can easily see that there are many green circle alternatives which sit above and to the left of the red circle and so are more efficient.
This result is based on 54,000 iterations of random portfolios. I usually keep going until a pattern emerges as you can see here. Of the 54,000 portfolios only 209 are efficient (sit on the frontier). All the rest are discarded.
If I choose a portfolio (green circle) on the left, I get an historic outcome like this: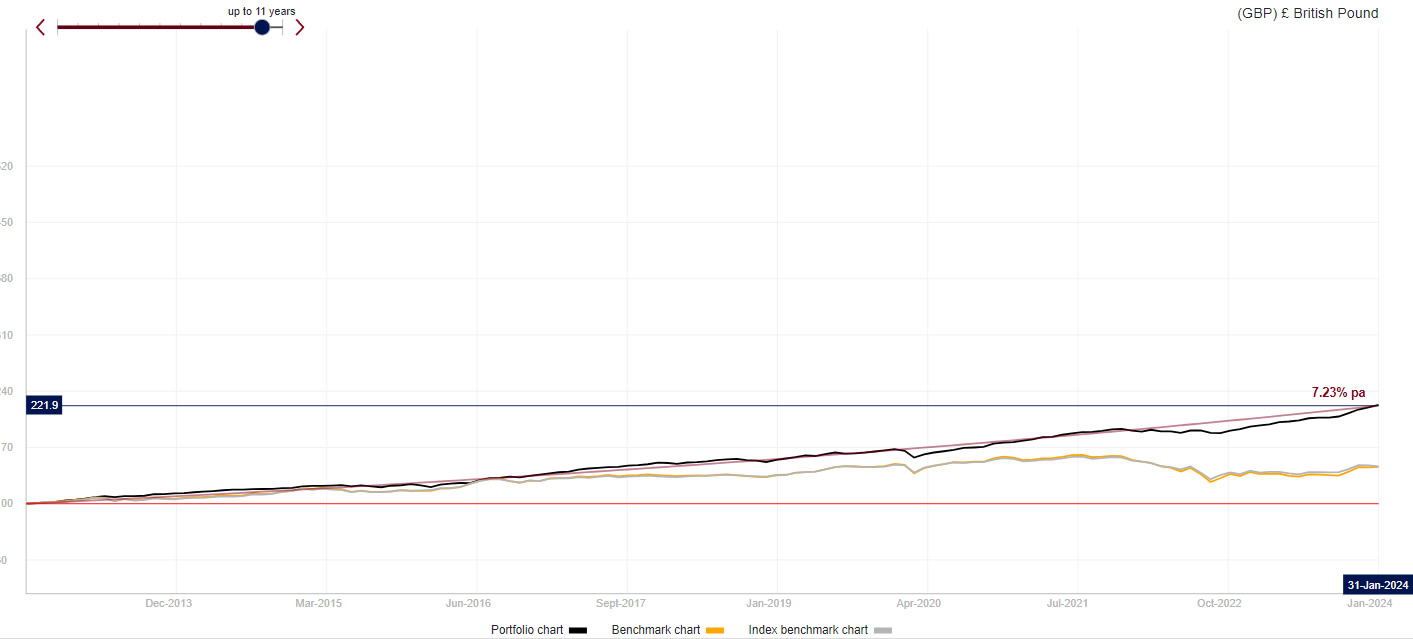
Nice and smooth (not too many potholes) as you can see and way ahead of the competition.
If I choose a portfolio (green circle) on the right hand side I get a result that looks like this: -
Clearly lots of potholes along the way but nevertheless, way better than the competition.
I repeat this Efficient Frontier analysis for all durations from 12 months to as many months for which I have pricing data. This will allow me to exclude the portfolios which are efficient at one duration but not at another (very important!).
Finally I'd like to answer those of you who disparage the technology sector as too much of a concentration risk and current flavour-of-the-month.
I'm not wedded to tech funds but I do see this...
Over the next 5 to 15 years technology (especially artificial intelligence) is set to infiltrate all of other investment sectors. Financial Services, Motor, Industrial, Utilities etc, and most especially Healthcare. Within 10 years I suspect that all other sectors will be just just a sub-sector of a technology holding.
Anyone who ignores this is doing a disservice to their customers and again should at least explain to them why.
But.... having said that, here is the sector breakdown of my favourite fund manager, in whom I have a sizeable investment holding: -
The technology I have developed is online, but for now I'm not interested in promoting it. The web site is private (family and friends only). But I'm always happy to share the underlying processes/algorithms etc. I genuinely want what's best for my fellow retirees. I can't give you my code but I can certainly talk about blueprints.
It's taken me about 7 years to complete. I started it as a hobby after I retired because I just got fed up with the dismal quality of advice I was seeing from the local advisers here in Europe. I now use it for myself and to "train" my fellow retirees and other friends to better understand their finances.
It's primary role is in the management of pension drawdown in retirement for money purchase arrangements. I have found that asset drawdown (asset decumulation and contingent stochastic spending) is one of the most mathematically complex processes in financial services. But the difference they make to spending capability in retirement and longevity risk management is colossal.
There is virtually no room for any qualitative subjectivity here. Please tell me you guys are treating it accordingly.
I always thought that the top UK financial advisers firms must be employing systems better than or at least as good as this when recommending portfolios.
After seeing the responses on this thread, now I'm not so sure.
I intend to start a new thread / discussion on asset decumulation soon as it seem to be becoming an ever increasing requirement in this aging population.
I promise to be more polite and sorry again if I've offended you!0 -
'Many of you seem to think that I think I can predict the future and always pick portfolios to beat everyone else's. Of course that's not true.'
Thus, I don't see the point of your analyses. If I could always pick a portfolio to beat all, then risk would be irrelevant. But since you and I can't I have to choose the best return for the risk I'm taking. That, theoretically comes from a cap weighted market portfolio for stocks, and over about 15 years such funds have beaten all others in about 90% of cases, says SPIVA. So I anticipate having better returns for my risk level than 90% of other choices. I'd ask about whether I could get the closer to 100%, but you've asked for no new questions.
'Within 10 years I suspect that all other sectors will be just just a sub-sector of a technology holding.........
Anyone who ignores this is doing a disservice to their customers and again should at least explain to them why. 'If the tech sector goes crazy up sometime I'm already there. I owned Nvidia the day it went into a global index. But more seriously, new market sector business opportunities invite more competition into the market; the spoils keep getting diluted among new players.
Please don't ask me more questions, this will be my last post on this thread.'No more questions, but you did miss Q1-3 several pages back, before you set your question limit.
3 -
1. Don't you agree it's a bit weird to post on a forum about money saving and then form an opinion about the top UK financial advisers as a result of the posts on the thread?daimes said:
I always thought that the top UK financial advisers firms must be employing systems better than or at least as good as this when recommending portfolios.
After seeing the responses on this thread, now I'm not so sure.2. It's been mentioned several times that advisers aren't simply about maximising return.3. Looking backwards is no guarantee of future performance. If you think you have found a secret algorithm that will perform best in the future then great - why not apply for a job at a hedge fund and leverage your algo so that the returns of you and yours will be even higher? From what I can see, such endeavours usually fail to perform as well as simple, unbiased, index portfolios over the long term.2 -
Although it does seem like you have put a great deal of thought into selecting investments there is a flaw in your work.
- Straight return over the given period of time (1,3,5,10,15 years)
- Lowest return in any 1 year, over the past 3.5.10.15 years
- Lowest return over any 3 years, over the past 5.10.15 years
- Lowest return over any 5 years, over the past 10.15 years
- Average return for the same again..
- Same again for return relative to benchmark funds (funds in the same investment category)
- Same again for return relative to index funds (index funds in the same investment category)
3 -
@JohnWinder Do you question whether using SPIVA analysis is truly independent and unbiased, as they are an indices based company that I would guess are much better off if their indices become more relevant, followed, data purchased etc?JohnWinder said:'Many of you seem to think that I think I can predict the future and always pick portfolios to beat everyone else's. Of course that's not true.'Thus, I don't see the point of your analyses. If I could always pick a portfolio to beat all, then risk would be irrelevant. But since you and I can't I have to choose the best return for the risk I'm taking. That, theoretically comes from a cap weighted market portfolio for stocks, and over about 15 years such funds have beaten all others in about 90% of cases, says SPIVA. So I anticipate having better returns for my risk level than 90% of other choices. I'd ask about whether I could get the closer to 100%, but you've asked for no new questions.
'Within 10 years I suspect that all other sectors will be just just a sub-sector of a technology holding.........
Anyone who ignores this is doing a disservice to their customers and again should at least explain to them why. 'If the tech sector goes crazy up sometime I'm already there. I owned Nvidia the day it went into a global index. But more seriously, new market sector business opportunities invite more competition into the market; the spoils keep getting diluted among new players.
Please don't ask me more questions, this will be my last post on this thread.'No more questions, but you did miss Q1-3 several pages back, before you set your question limit.
Is there an alternative truly independent analysis that you could refer to?
0 -
So this entire thread was a marketing pitch for a new analytical tool you have developed? Edit: Oops, sorry that was a question
4


Confirm your email address to Create Threads and Reply

Categories
- All Categories
- 354.3K Banking & Borrowing
- 254.4K Reduce Debt & Boost Income
- 455.4K Spending & Discounts
- 247.3K Work, Benefits & Business
- 604K Mortgages, Homes & Bills
- 178.4K Life & Family
- 261.5K Travel & Transport
- 1.5M Hobbies & Leisure
- 16K Discuss & Feedback
- 37.7K Read-Only Boards