We’d like to remind Forumites to please avoid political debate on the Forum.
This is to keep it a safe and useful space for MoneySaving discussions. Threads that are – or become – political in nature may be removed in line with the Forum’s rules. Thank you for your understanding.
📨 Have you signed up to the Forum's new Email Digest yet? Get a selection of trending threads sent straight to your inbox daily, weekly or monthly!
The Forum now has a brand new text editor, adding a bunch of handy features to use when creating posts. Read more in our how-to guide
The time has come to buy more units during this ‘’sale’’

original1
Posts: 17 Forumite


Unit price on downwards trend
0
Comments
-
That's not the only risk. US growth stocks 'seem' to have moved from a 'buy the dip' mentality to 'sell the rally' due to interest rate and valuation concerns. If this continues, it pulls down most markets with it.Section62 said:original1 said:The time has come to buy more units during this ‘’sale’’Unit price on downwards trendDo you think we've seen the worst of the Ukraine/Russia crisis yet?
One of the risks of 'timing' is thinking the worst is already past.0 -
A crash is 20%. The major crashes are 40%. We are currently down around 10%. Buying today is better than buying in December but it may only be early days into a decline. Also, not all declines happen quickly. There were three negative years in a row just over 20 years ago.I am an Independent Financial Adviser (IFA). The comments I make are just my opinion and are for discussion purposes only. They are not financial advice and you should not treat them as such. If you feel an area discussed may be relevant to you, then please seek advice from an Independent Financial Adviser local to you.3
-
A fall over 10% is deemed to be a correction. Not in bargain territory yet.
While units maybe on a downward trend. Some companies have performed extremely well. What really matters is your underlying asset allocation.1 -
I have a little headroom left in my ISA this side of April which I will top up at some point. Might leave it a few more weeks though. I make monthly contributions to my share ISA but, if I have any spare, will usually put something extra in if there is a drop.0
-
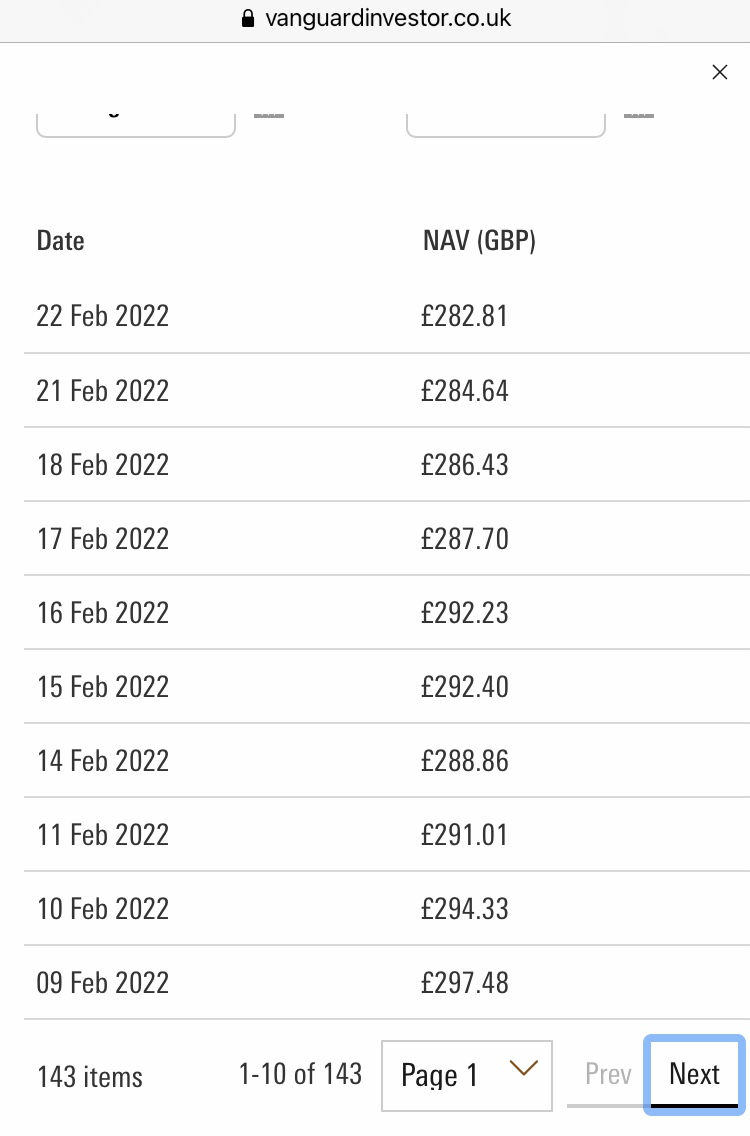
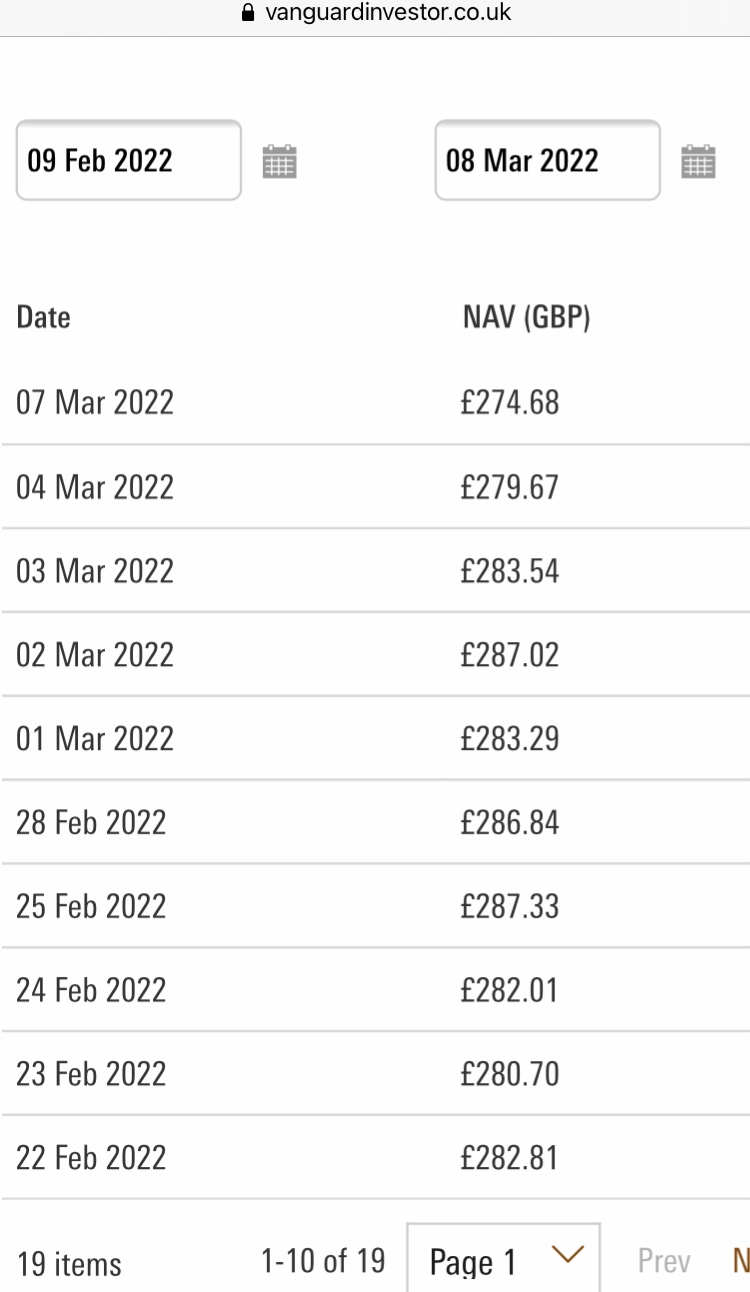
Further drops in Vanguard LifeStrategy 100 % Equity fund.Buying the dip.What is buying the dip? The term 'buying the dip' refers to the practice of buying a stock or other asset after it has declined in value, hopefully with some research that indicates it is likely to rise again following the dip
 0
0 -
0
-
GeoffTF said:
Good video, though it focuses on a continuous drip feed over 30 years. Many people on this forum seem to have a large pot of cash waiting to go back in, and certainly now is 10-20% better than a few months ago. Perhaps drip feed that in over the next few months. Guessing how low the market will go is impossible.
"For every complicated problem, there is always a simple, wrong answer"1 -
Video is summed up in the early minutes. Waiting to buy at a set percentage below the recent high won't work. It might go up 100% before it falls 20% and it could be years away. Buy the dip is just a general term for buying after any sell off. Many ways to do it but most people just simply drip feed monthly or add money when available.k6chris said:GeoffTF said:
Good video, though it focuses on a continuous drip feed over 30 years. Many people on this forum seem to have a large pot of cash waiting to go back in, and certainly now is 10-20% better than a few months ago. Perhaps drip feed that in over the next few months. Guessing how low the market will go is impossible.
I use charts and lower indicators for buying and selling and yes nothing works all of the time. There's certainly a link with indicators such as RSI and Full Stochastic shown on the chart. Could even top up at a moving average such as 50 day although we are way below that now.
$SPX | SharpChart | StockCharts.com
On another thread in July last year I highlighted that all indicators were on the top in all timeframes. That's doesn't happen often . Here's the weekly chart today which shows lower indicators near the bottom of the range . Look at RSI and Stochastic. Market of course is lower and generally a good time to buy when the weekly is oversold. Again it doesn't happen that often.
$SPX | SharpChart | StockCharts.com
Here's the monthly chart in July last year. All indicators on the top so long term overbought.
usa+m+jun30.png (640×614) (bp.blogspot.com)
Today they are moving lower. What happens next who knows as monthly indicators don't play out that often. If they do then the market will have crashed.
AVvXsEgcL3k-821Je9tSZTBwPey65Pdz_xARTqBUraTe21HNZVxigcIyNDU_EMHlAFe-8IB2-8YrFvmxviFmhhdzKYP-O5RGy846lJY_eamcghQGPaN0Hichg4RGBuGWuPy6f-vAGB4f___szlJLcBzJ8k8Zjv4jbX4-a-QpHx9w8gim3sMJVvipLQnap72Vyg=w640-h614 (640×614) (googleusercontent.com)
1


 https://www.youtube.com/watch?v=UvkqIDE9itg


Confirm your email address to Create Threads and Reply

Categories
- All Categories
- 354.8K Banking & Borrowing
- 254.5K Reduce Debt & Boost Income
- 455.6K Spending & Discounts
- 247.6K Work, Benefits & Business
- 604.5K Mortgages, Homes & Bills
- 178.6K Life & Family
- 262.1K Travel & Transport
- 1.5M Hobbies & Leisure
- 16.1K Discuss & Feedback
- 37.7K Read-Only Boards