We’d like to remind Forumites to please avoid political debate on the Forum.
This is to keep it a safe and useful space for MoneySaving discussions. Threads that are – or become – political in nature may be removed in line with the Forum’s rules. Thank you for your understanding.
📨 Have you signed up to the Forum's new Email Digest yet? Get a selection of trending threads sent straight to your inbox daily, weekly or monthly!
The Forum now has a brand new text editor, adding a bunch of handy features to use when creating posts. Read more in our how-to guide
Calculating value
Comments
-
Most will have a set asset allocation and leave it unless it needs a slight change here and there. Buy and hold as they say and give it 10 years at least.Bobziz said:
Thanks, that's helpful. I've been looking at the PE 10 recently to get a feel for where the markets are at generally. Useful grounding to see that the PE10 of the s&p500 has only every been higher than it is now on one occasion over the last 120 years.maxsteam said:
The first statistic that you should look at is PE ratio. Average PE ratios can be calculated for indices and sectors. These calculations lead to statements such as US stocks are more expensive than UK stocks. A company/sector/index with a high PE ratio is more expensive than one with a lower PE ratio.Bobziz said:how do you go about calculating the value of an individual stock or fund etc ?
It's not the only important statistic by any means. The debt/equity ratio will often explain why companies in the same sector can have significantly different PE ratios. Assets per share is also an important factor. Growth expectations together with expected and historical PE ratios affect valuations.
Having said all that, it's quite normal for a company's share price to fluctuate for no reason over a period when there is no relevant news.
I wonder how many investors have a plan in place ready to follow....
You've got to start somewhere and yes it's easy to get concerned about things going in the wrong direction. Drip feed into the market if you need that reassurance otherwise it's in today with a lump sum.
The market itself who knows what happens ? Valuations play a part but other events might take it in another direction ? You can go on forever and the media has a headline everyday.
If you wait for P/E's to adjust you could miss out on a 50% rally. Forward earnings give you an indication.
EaKs-ESWkAccon0 (900×483) (twimg.com)
EZ_91bOXQAAp1Zo (1400×1169) (twimg.com)
EdnQ6gMWkAIhcXy (700×548) (twimg.com)
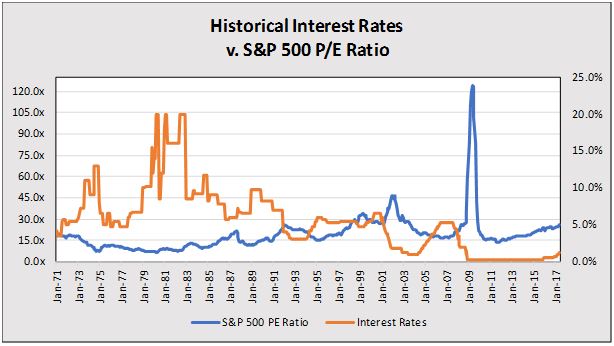
Interest rates were low in the 1960's and valuations were high just like today.
White-Paper-Image-4.jpg (614×346) (valuescopeinc.com)
Even if the market goes sideways to correct valuations the waves during this process can be huge. You could say it's happening now as we've had two corrections of 20% or more in the last few years. Keep buying the dips it's worked so far.
EhCv7GqUwAACMF8 (900×504) (twimg.com)
1 -
Averages can hide a multitude of variances. PE is a manipulable figure. Share buybacks can enhance EPS.Bobziz said:
Thanks, that's helpful. I've been looking at the PE 10 recently to get a feel for where the markets are at generally. Useful grounding to see that the PE10 of the s&p500 has only every been higher than it is now on one occasion over the last 120 years.maxsteam said:
The first statistic that you should look at is PE ratio. Average PE ratios can be calculated for indices and sectors. These calculations lead to statements such as US stocks are more expensive than UK stocks. A company/sector/index with a high PE ratio is more expensive than one with a lower PE ratio.Bobziz said:how do you go about calculating the value of an individual stock or fund etc ?
It's not the only important statistic by any means. The debt/equity ratio will often explain why companies in the same sector can have significantly different PE ratios. Assets per share is also an important factor. Growth expectations together with expected and historical PE ratios affect valuations.
Having said all that, it's quite normal for a company's share price to fluctuate for no reason over a period when there is no relevant news.
I wonder how many investors have a plan in place ready to follow....1 -
I find this chart particularly useful, thanks. What's the general consensus on how to buy the dips in terms of where/how funds are held prior to purchase ? Cash, CGT/PNL type IT's, top slicing or switching, bonds ?coastline said:Even if the market goes sideways to correct valuations the waves during this process can be huge. You could say it's happening now as we've had two corrections of 20% or more in the last few years. Keep buying the dips it's worked so far.
EhCv7GqUwAACMF8 (900×504) (twimg.com)0 -
Many investors will have added new money during last years crash. Really depends how your platform is set up and your own investments. Real time deals can be done with IT's and ETF's and shares but others can take a few days. It's up to yourself if you want to hold a bit of cash in your account not that you'd be getting much interest on it anyway.Bobziz said:
I find this chart particularly useful, thanks. What's the general consensus on how to buy the dips in terms of where/how funds are held prior to purchase ? Cash, CGT/PNL type IT's, top slicing or switching, bonds ?coastline said:Even if the market goes sideways to correct valuations the waves during this process can be huge. You could say it's happening now as we've had two corrections of 20% or more in the last few years. Keep buying the dips it's worked so far.
EhCv7GqUwAACMF8 (900×504) (twimg.com)
Many rebalance regardless to keep asset allocations in line. I wouldn't have thought trying to time the markets was an aim just a case of keeping things on track.
Regarding buying the dips there's no guarantee as ever but there's plenty of opportunities to top up when markets are off the boil. Look how many 5% corrections happen in just one year. Trying to catch the big event you could wait forever just like waiting for P/E values to correct.
D7QjWt7WwAA6HYW.jpg (1200×661) (twimg.com)
Let's say your global tracker was VWRL.L and you were adding new money. No guarantee but you could buy in near the 50 day or 200 day moving average in a mechanical system. It's not in the rule book of investing but it's possible to gain here and there. Stretch the chart out a bit for a better look.
VWRL.L | SharpChart | StockCharts.com
1


Confirm your email address to Create Threads and Reply

Categories
- All Categories
- 353.5K Banking & Borrowing
- 254.1K Reduce Debt & Boost Income
- 455K Spending & Discounts
- 246.6K Work, Benefits & Business
- 602.9K Mortgages, Homes & Bills
- 178K Life & Family
- 260.5K Travel & Transport
- 1.5M Hobbies & Leisure
- 16K Discuss & Feedback
- 37.7K Read-Only Boards