We’d like to remind Forumites to please avoid political debate on the Forum.
This is to keep it a safe and useful space for MoneySaving discussions. Threads that are – or become – political in nature may be removed in line with the Forum’s rules. Thank you for your understanding.
📨 Have you signed up to the Forum's new Email Digest yet? Get a selection of trending threads sent straight to your inbox daily, weekly or monthly!
The Forum now has a brand new text editor, adding a bunch of handy features to use when creating posts. Read more in our how-to guide
FTSE tracker
Comments
-
bowlhead99 said:
Yes, I assumed the answer to your rhetorical 'where have I heard that' question was "from every one of his previous accounts"NottinghamKnight said:
I'm suggesting far more recently on these boards by someone no longer posting.Thrugelmir said:
Shortly before the Nikkei crashed. What's the famous saying.NottinghamKnight said:Where have I heard all this before.......
“Bull markets are born on pessimism, grown on scepticism, mature on optimism, and die on euphoria.”
The way the story generally goes is that the US only outperformed the UK because the companies which make up the index were rated higher by investors and people will now pay more per pound of earnings for the types of companies that are growing faster, dominating the US index (the Microsoft Azures and Amazons) vs the large low-growth ones that are in the UK FTSE (the BPs and BATs); 'relative speculation' as he mentions, so the return differential isn't sustainable.
Of course, those relative valuations could well be justifiable for reasons connected to the characteristics of the companies that happen to dominate the respective indexes, so there's no reason the values would have an urgent need to flip flop and drive the value of BAT and Microsoft to the same P/E or the S&P and FTSE to the same CAPE, if they are made up by quite different company types. But the difference in returns that came from the PE growing (or not shrinking) in one index over the other is perhaps less sustainable.
It's a bit like saying a UK house used to cost 3x average household income and now costs 10x average household income, at some point there will be a practical limit to how much can be made from the expansion of the multiple (i.e. over the next x years will average houses go to 30 or 100x salaries... probably not). It doesn't call into question whether a Mayfair flat should command a higher valuation than an shed in Grimsby but at some point the rate of change of the multiple (rather than the rate of change of the underlying earnings) may run out of road.
Another_saver contends on various threads that it all must average out in the end because each market can only overall grow to a capped amount that reflects the growth in long term local GDP, though this ignores the fact that the various companies may operate in different global markets so aren't constrained by a particular local GDP growth. If a leading UK or US company doubles its share of Chinese customers (market share of the Chinese market) or its share of that market stays the same but the number of Chinese customers that could be interested in the types of products it's selling doubles (size of the Chinese market for that type of product increases), it may double its profits even though the UK or US GDP only grew by a couple of percent.
The 'long term' over which a hypothesis can be proved about 'the GDP growth is about the same in these two markets so in the long term the stock market return should be about the same in these two markets', is the kind of long term which well exceeds a generation or even a lifetime. There is no point doing a thought experiment that starts "imagine there is only one company in an economy that produces anything or employs anyone, and it's listed on the stock exchange, and there are no companies not listed on the stock exchange and nobody works in the public sector" to conclude that long term stock exchange total return of that country should match GDP growth.Right, but the 'last decade' when standing at the *start* of the last decade and looking backward would not have been 'massively in favour of the S&P500'; indeed the US had a decade of being the worst place to be invested when its returns were measured in a global basket of currencies. So even if som ine of what is posted here from time to time is flawed, you should take care not to dismiss it out of hand purely due to recency bias (more familiarity with, or ease of access to, relatively recent data).I'm going to ignore the first part of your post because I don't know what you are talking about.There are perfectly valid concerns about "home bias" for a UK investor, I am providing a different opinion and context. This is a forum to exchange ideas and improve individual's financial education, that is what I am doing because the people who ask questions on here ought to know that popular opinion about UK equity is not entirely well-founded. The title of this thread is FTSE tracker, if someone's looking at say, the FTSE 100 it's important to understand why it's done so darn crap lately, mainly since the referendum but the same sinking below the global market appears if you sent the start date on a graph to 2007.re: capital dilution and effects of speculation over time - your point makes no sense. This is how capital markets work. I don't know how else to explain it more simply, where have you learned whatever you have learned?The components of equity returns are dividends, speculation, capital dilution, change in the size of the market relative to GDP, inflation, real earnings growth, and structural changes.
I notice you still haven't replied to my reply to your last post in the VVFUSI Vs VMID thread. You have provided no data, evidence or referred to anyone to back up what you are saying, I have. Your arguments are all hypothetical.These papers support my points:
https://papers.ssrn.com/sol3/papers.cfm?abstract_id=667507
https://www.google.com/url?sa=t&source=web&rct=j&url=https://www.researchaffiliates.com/documents/FAJ-2003-Two-Percent-Dilution.pdf&ved=2ahUKEwiKoaaQ1dnsAhWlQkEAHbjWD8sQFjAAegQIAhAB&usg=AOvVaw3k73yZYUiPErU7pmTxLLQD&cshid=1603969972388
Are there more recent studies to the contrary I am not aware of?
To answer your point about very long term data becoming meaningless, Ritter suggests using the cyclically adjusted earnings yield as the least bad predictor of future real total returns at a national and global level for developed markets, because of the numerous factors that can pull returns away from GDP over an investing lifetime. I know @jamesd has referred to the CAPE/PE10, but I don't see the same ridiculous criticism sent their way.
If you're going to disagree then kindly back up your points (or actually make one) rather than attacking my credibility, strawmanning, or using caveats I acknowledged. Trade is included in GDP, corporate profits tend to be the part of the economy that does the trading. Over long but finite periods corporate profits can grow or shrink relative to GDP but not forever (barring the extremes of the Russian Revolution, and you have to allow for the growth of market over time since capitalism). Other caveats include the fact that the UK is a headquarters of convenience for multinationals, perhaps the FTSE 100 market cap's growth relative to GDP to date is explained by the rise of global earnings. The same is true of most developed markets these days, the US global sales ratio is about 40% for example, even though trade is roughly 10% of GDP each way.There are other periods when the UK outperformed the US and global market, if I had suggested then that the UK was superior, I'm sure popular opinion would have been similarly mocking.
That wasn't a thought experiment, you did not appear to understand capital dilution so I dumbed it down for you and you still don't get it. Take responsibility for your own shortcomings.1 -
Unilever, RB, Prudential, MnG, DS Smith, GSK, Persimmon. So 7.AnotherJoe said:MaxiRobriguez said:Plenty of stocks in the FTSE100 which trade on low multiples, pay decent dividends that are secure and have global reach so as to avoid local geographical issues. They're not favoured at the moment and they're not sexy, but in the event of the racier US tech stocks suffering a sell-off, then they're the sort of stocks that keep your portfolio ticking along nicely.
Personally I feel inclusion of such stocks is important, so they make up a greater part of my portfolio (c 15-20%) than most, but critically that is not the FTSE index, it's a selection of about 8 stocks which I feel have greater security than the rest of the index.
I began trimming my US allocations late last year and started rotating into Japan/Europe and EM mainly. I reversed that briefly in March to pick up the NASDAQ after it got tonked but most of that has been rotated back again.
I think what I'm trying to say is, there's no one size fits all approach, each market has threats and opportunities. Just invest according to your goals and risk tolerance.
Care to name those favoured 8 MR?")
I've also bought a load of Boohoo shares this year each time they've crashed, but they don't filter into the aforementioned dividend play.
And to reiterate the "opportunities and threats" point - I also hold Saga and BT on a rebound punt which have been horrendous picks. Lesson learned.
Combined above picks are down 11% since turn of the year including the dregs that are Saga and BT, excluding dividends, so the selection has so far outperformed the FTSE100, but lags against the US markets. Not unexpected I guess.0 -
Nice to see someone winning the active management game, good mix of steady consumer staples and recovery play. Boohoo I don't like though, I think what's been made public so far is just the tip of an iceberg of corruption, same at the Hut Group.MaxiRobriguez said:
Unilever, RB, Prudential, MnG, DS Smith, GSK, Persimmon. So 7.AnotherJoe said:MaxiRobriguez said:Plenty of stocks in the FTSE100 which trade on low multiples, pay decent dividends that are secure and have global reach so as to avoid local geographical issues. They're not favoured at the moment and they're not sexy, but in the event of the racier US tech stocks suffering a sell-off, then they're the sort of stocks that keep your portfolio ticking along nicely.
Personally I feel inclusion of such stocks is important, so they make up a greater part of my portfolio (c 15-20%) than most, but critically that is not the FTSE index, it's a selection of about 8 stocks which I feel have greater security than the rest of the index.
I began trimming my US allocations late last year and started rotating into Japan/Europe and EM mainly. I reversed that briefly in March to pick up the NASDAQ after it got tonked but most of that has been rotated back again.
I think what I'm trying to say is, there's no one size fits all approach, each market has threats and opportunities. Just invest according to your goals and risk tolerance.
Care to name those favoured 8 MR?
I've also bought a load of Boohoo shares this year each time they've crashed, but they don't filter into the aforementioned dividend play.
And to reiterate the "opportunities and threats" point - I also hold Saga and BT on a rebound punt which have been horrendous picks. Lesson learned.
Combined above picks are down 11% since turn of the year including the dregs that are Saga and BT, excluding dividends, so the selection has so far outperformed the FTSE100, but lags against the US markets. Not unexpected I guess.
1 -
It's impossible to argue against your contention because of the inclusion of "speculation" as a component. Speculation can't be measured, it's just a bucket into which any excess or shortfall can be thrown.Another_Saver said:
The components of equity returns are dividends, speculation, capital dilution, change in the size of the market relative to GDP, inflation, real earnings growth, and structural changes.bowlhead99 said:
Yes, I assumed the answer to your rhetorical 'where have I heard that' question was "from every one of his previous accounts"NottinghamKnight said:
I'm suggesting far more recently on these boards by someone no longer posting.Thrugelmir said:
Shortly before the Nikkei crashed. What's the famous saying.NottinghamKnight said:Where have I heard all this before.......
“Bull markets are born on pessimism, grown on scepticism, mature on optimism, and die on euphoria.”
The way the story generally goes is that the US only outperformed the UK because the companies which make up the index were rated higher by investors and people will now pay more per pound of earnings for the types of companies that are growing faster, dominating the US index (the Microsoft Azures and Amazons) vs the large low-growth ones that are in the UK FTSE (the BPs and BATs); 'relative speculation' as he mentions, so the return differential isn't sustainable.
Of course, those relative valuations could well be justifiable for reasons connected to the characteristics of the companies that happen to dominate the respective indexes, so there's no reason the values would have an urgent need to flip flop and drive the value of BAT and Microsoft to the same P/E or the S&P and FTSE to the same CAPE, if they are made up by quite different company types. But the difference in returns that came from the PE growing (or not shrinking) in one index over the other is perhaps less sustainable.
It's a bit like saying a UK house used to cost 3x average household income and now costs 10x average household income, at some point there will be a practical limit to how much can be made from the expansion of the multiple (i.e. over the next x years will average houses go to 30 or 100x salaries... probably not). It doesn't call into question whether a Mayfair flat should command a higher valuation than an shed in Grimsby but at some point the rate of change of the multiple (rather than the rate of change of the underlying earnings) may run out of road.
Another_saver contends on various threads that it all must average out in the end because each market can only overall grow to a capped amount that reflects the growth in long term local GDP, though this ignores the fact that the various companies may operate in different global markets so aren't constrained by a particular local GDP growth. If a leading UK or US company doubles its share of Chinese customers (market share of the Chinese market) or its share of that market stays the same but the number of Chinese customers that could be interested in the types of products it's selling doubles (size of the Chinese market for that type of product increases), it may double its profits even though the UK or US GDP only grew by a couple of percent.
The 'long term' over which a hypothesis can be proved about 'the GDP growth is about the same in these two markets so in the long term the stock market return should be about the same in these two markets', is the kind of long term which well exceeds a generation or even a lifetime. There is no point doing a thought experiment that starts "imagine there is only one company in an economy that produces anything or employs anyone, and it's listed on the stock exchange, and there are no companies not listed on the stock exchange and nobody works in the public sector" to conclude that long term stock exchange total return of that country should match GDP growth.Right, but the 'last decade' when standing at the *start* of the last decade and looking backward would not have been 'massively in favour of the S&P500'; indeed the US had a decade of being the worst place to be invested when its returns were measured in a global basket of currencies. So even if som ine of what is posted here from time to time is flawed, you should take care not to dismiss it out of hand purely due to recency bias (more familiarity with, or ease of access to, relatively recent data).
0 -
Seems generous to call an 11% loss a win but hey ho. Trading fees for the year come to 0.2% so not too much difference to the ongoing fee of holding a passive tracker fund.Another_Saver said:
Nice to see someone winning the active management game, good mix of steady consumer staples and recovery play. Boohoo I don't like though, I think what's been made public so far is just the tip of an iceberg of corruption, same at the Hut Group.MaxiRobriguez said:
Unilever, RB, Prudential, MnG, DS Smith, GSK, Persimmon. So 7.AnotherJoe said:MaxiRobriguez said:Plenty of stocks in the FTSE100 which trade on low multiples, pay decent dividends that are secure and have global reach so as to avoid local geographical issues. They're not favoured at the moment and they're not sexy, but in the event of the racier US tech stocks suffering a sell-off, then they're the sort of stocks that keep your portfolio ticking along nicely.
Personally I feel inclusion of such stocks is important, so they make up a greater part of my portfolio (c 15-20%) than most, but critically that is not the FTSE index, it's a selection of about 8 stocks which I feel have greater security than the rest of the index.
I began trimming my US allocations late last year and started rotating into Japan/Europe and EM mainly. I reversed that briefly in March to pick up the NASDAQ after it got tonked but most of that has been rotated back again.
I think what I'm trying to say is, there's no one size fits all approach, each market has threats and opportunities. Just invest according to your goals and risk tolerance.
Care to name those favoured 8 MR?
I've also bought a load of Boohoo shares this year each time they've crashed, but they don't filter into the aforementioned dividend play.
And to reiterate the "opportunities and threats" point - I also hold Saga and BT on a rebound punt which have been horrendous picks. Lesson learned.
Combined above picks are down 11% since turn of the year including the dregs that are Saga and BT, excluding dividends, so the selection has so far outperformed the FTSE100, but lags against the US markets. Not unexpected I guess.
Understand the concern about Boohoo but I find it easy enough to assume that people like cheap clothes and so whatever bad practices get spewed out to the media, your average folk both won't notice and if they do, won't care, so long term the price will be dictated by the growth numbers, which make the stock cheap currently. More ethical investors may be put off though.1 -
MaxiRobriguez said:
Seems generous to call an 11% loss a win but hey ho. Trading fees for the year come to 0.2% so not too much difference to the ongoing fee of holding a passive tracker fund.Another_Saver said:
Nice to see someone winning the active management game, good mix of steady consumer staples and recovery play. Boohoo I don't like though, I think what's been made public so far is just the tip of an iceberg of corruption, same at the Hut Group.MaxiRobriguez said:
Unilever, RB, Prudential, MnG, DS Smith, GSK, Persimmon. So 7.AnotherJoe said:MaxiRobriguez said:Plenty of stocks in the FTSE100 which trade on low multiples, pay decent dividends that are secure and have global reach so as to avoid local geographical issues. They're not favoured at the moment and they're not sexy, but in the event of the racier US tech stocks suffering a sell-off, then they're the sort of stocks that keep your portfolio ticking along nicely.
Personally I feel inclusion of such stocks is important, so they make up a greater part of my portfolio (c 15-20%) than most, but critically that is not the FTSE index, it's a selection of about 8 stocks which I feel have greater security than the rest of the index.
I began trimming my US allocations late last year and started rotating into Japan/Europe and EM mainly. I reversed that briefly in March to pick up the NASDAQ after it got tonked but most of that has been rotated back again.
I think what I'm trying to say is, there's no one size fits all approach, each market has threats and opportunities. Just invest according to your goals and risk tolerance.
Care to name those favoured 8 MR?
I've also bought a load of Boohoo shares this year each time they've crashed, but they don't filter into the aforementioned dividend play.
And to reiterate the "opportunities and threats" point - I also hold Saga and BT on a rebound punt which have been horrendous picks. Lesson learned.
Combined above picks are down 11% since turn of the year including the dregs that are Saga and BT, excluding dividends, so the selection has so far outperformed the FTSE100, but lags against the US markets. Not unexpected I guess.
Understand the concern about Boohoo but I find it easy enough to assume that people like cheap clothes and so whatever bad practices get spewed out to the media, your average folk both won't notice and if they do, won't care, so long term the price will be dictated by the growth numbers, which make the stock cheap currently. More ethical investors may be put off though.I bought Boohoo in the summer during the dip. Had to sell some loss making shares in Lloyds and, since then, have more than made up for the loss.Ethics don't come into the decision making process for my investments at all. Perhaps an indirect impact via potential carbon tax issues in the future but certainly don't want to miss out on returns due to ethics. Others maybe more empathetic.I sold a FTSE100 tracker in the 7000s to lock in a total return of 40% fortunately. I suspect at some point the FTSE100 will start outperforming the Nasdaq or S&P500. Different economic regimes calls for different investing styles/strategies.1 -
coyrls said:
It's impossible to argue against your contention because of the inclusion of "speculation" as a component. Speculation can't be measured, it's just a bucket into which any excess or shortfall can be thrown.Another_Saver said:
The components of equity returns are dividends, speculation, capital dilution, change in the size of the market relative to GDP, inflation, real earnings growth, and structural changes.bowlhead99 said:
Yes, I assumed the answer to your rhetorical 'where have I heard that' question was "from every one of his previous accounts"NottinghamKnight said:
I'm suggesting far more recently on these boards by someone no longer posting.Thrugelmir said:
Shortly before the Nikkei crashed. What's the famous saying.NottinghamKnight said:Where have I heard all this before.......
“Bull markets are born on pessimism, grown on scepticism, mature on optimism, and die on euphoria.”
The way the story generally goes is that the US only outperformed the UK because the companies which make up the index were rated higher by investors and people will now pay more per pound of earnings for the types of companies that are growing faster, dominating the US index (the Microsoft Azures and Amazons) vs the large low-growth ones that are in the UK FTSE (the BPs and BATs); 'relative speculation' as he mentions, so the return differential isn't sustainable.
Of course, those relative valuations could well be justifiable for reasons connected to the characteristics of the companies that happen to dominate the respective indexes, so there's no reason the values would have an urgent need to flip flop and drive the value of BAT and Microsoft to the same P/E or the S&P and FTSE to the same CAPE, if they are made up by quite different company types. But the difference in returns that came from the PE growing (or not shrinking) in one index over the other is perhaps less sustainable.
It's a bit like saying a UK house used to cost 3x average household income and now costs 10x average household income, at some point there will be a practical limit to how much can be made from the expansion of the multiple (i.e. over the next x years will average houses go to 30 or 100x salaries... probably not). It doesn't call into question whether a Mayfair flat should command a higher valuation than an shed in Grimsby but at some point the rate of change of the multiple (rather than the rate of change of the underlying earnings) may run out of road.
Another_saver contends on various threads that it all must average out in the end because each market can only overall grow to a capped amount that reflects the growth in long term local GDP, though this ignores the fact that the various companies may operate in different global markets so aren't constrained by a particular local GDP growth. If a leading UK or US company doubles its share of Chinese customers (market share of the Chinese market) or its share of that market stays the same but the number of Chinese customers that could be interested in the types of products it's selling doubles (size of the Chinese market for that type of product increases), it may double its profits even though the UK or US GDP only grew by a couple of percent.
The 'long term' over which a hypothesis can be proved about 'the GDP growth is about the same in these two markets so in the long term the stock market return should be about the same in these two markets', is the kind of long term which well exceeds a generation or even a lifetime. There is no point doing a thought experiment that starts "imagine there is only one company in an economy that produces anything or employs anyone, and it's listed on the stock exchange, and there are no companies not listed on the stock exchange and nobody works in the public sector" to conclude that long term stock exchange total return of that country should match GDP growth.Right, but the 'last decade' when standing at the *start* of the last decade and looking backward would not have been 'massively in favour of the S&P500'; indeed the US had a decade of being the worst place to be invested when its returns were measured in a global basket of currencies. So even if som ine of what is posted here from time to time is flawed, you should take care not to dismiss it out of hand purely due to recency bias (more familiarity with, or ease of access to, relatively recent data).Speculation or rerating is measured as a change in valuation. I have never said that last part in bold.If the PE doubles from 10 to 20 over a decade, that adds roughly 7% a year to the market return, if it halves from 30 to 15 over 20 years, that reduces the market return by 3.4% a year.For a concrete example, I cannot find FTSE PE data before 1993, but the dividend yield of the Barclays UK equity index at 31/12/1985 was 4.3%, similar to the current yield, indicating no material net rerating of the FTSE 100 to date (or at least, probably on the order of at most the low tens of basis points either way).The total return from inception to 30/9/20 (latest market cap data) is 8.06%, the capital return was 4.02%, implying an average dividend yield of 3.88%. Capital dilution was -2.32%, offset by the 100 index expanding relative to GDP by +2.14% hence index growth almost kept up with nominal GDP growth of 4.41% (this is calculated using the market cap at inception of £160bn vs current market cap from FTSERussell.com factsheets). Inflation as measured by the difference between nominal and real GDP was 2.93%, real GDP growth was 1.44%.For the US, the total return was 10.8% over the same period, 8.35% was capital growth implying an average 2.22% dividend yield. Rerating added 2.53% to the return (PE from 14.28 to 34.01), corporate profits expanded from 4.76% - 7.98% of GDP adding 1.51% ontop of what you might call "organic" earnings growth (this is a different calculations method to the above as I do not have historical S&P market cap data, theoretically both methods should have the same results, this figure can include private corporations, but generally I would expect this to reliably apply to public markets as well). I can't find market cap data so was unable to calculate capital dilution more precisely. Nominal GDP growth was 4.59% of which 2.11% was inflation and 2.43% was real growth.There does not appear to have been material rerating of the FTSE 100 over this period, so you can reasonably argue that the "actual return" was identical for both indices, 8.06% (1.108/1.0253=1.0806) - unless you believe that the US for some reason can continue to experience upwards rerating.Caveats: both of these indices have a bottom that companies can drop out of to be replaced by new entrants, structural changes, globalisation, M&A activity, currency changes, different global sales ratios etc.1 -
Linton said:
Trustnet/tools/charting and choose a suitable ETF which will also get you the values wuith dividends reinvested which is rather more important than the simple index. However ETFs dont get you much before 2010. You are limited in any case because the FTSE100 index was only started in the mid 1980's and the S&P500 around 1980.ProDave said:Can anyone find a graph comparing the FTSE and S&P over time, taking into account the $ / £ exchange rate? i.e. how it would actually have looked to a UK investor who has exchange rate to consider when buying and selling?Trustnet for the FTSE 100 but again the total return index only goes back to 31/12/85 and the price index back to 3/1/84. Barclays Equity Gilts Study (you can find free copies if you google it) for anything earlier, xe.com for currencies. You could use the IA North America sector on trustnet as a rough proxy for the US market, it goes back to 1/1/1990 and is measured in £.The S&P 500 goes back to 1926, Robert Shiller in Irrational Exuberance calculated it back to 1871 and all this data is captured on https://www.multpl.com.Also make sure you're comparing total return indices not just the price.
1 -
Another_Saver said:
For convenience let's use year end 2009 to year-end 2019. This is far too short a time period to infer anything from.Steve182 said:
Last decade the difference has been massively in favour of S & P 500TBC15 said:
So what's the relative performance over say 10yrs?Another_Saver said:
Rather that than the S&P 500 full of dot com valuation consumer electronics and media companies, and healthcare companies that won't be around when the US inevitably switches to public healthcare.TBC15 said:The FTSE 100 is a Jurassic index, to be avoided at all costs.
This is to 2018. You will find something more recent if you persevere on Google I'm sure. The trend has continued in the same direction since then, but that's no indication of what will happen next...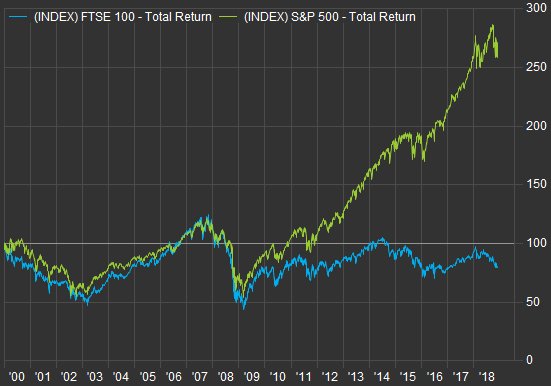 The S&P returned 13.3%, the FTSE 100 7.39%, hardly a bad run, just less good. All figures are annualised.
The gap is 5.50%
The FTSE's PE fell from 17.78 to 16.45, -.78% pa
The S&P's PE rose from 20.7 to 24.88 +1.86% pa
So 2.66% of the gap is explained by relative speculation or rerating, leaving 2.77% explained by additional earnings growth in the US. Both countries inflation rates and corporate profits/GDP ratios were comparable and during this period the US experienced a significant corporate tax cut. The 2000s had also been a worse decade for US earnings than the UK, so a reversion to the mean was to be expected.
I don't see a trend, I see volatility, opportunity and value.
Edit: this isn't just the UK, the US has outperformed just about everything except bitcoin and Tesla in the last decade and year to date.This is a really good post and wish there was more of this sort of analysis on here. The US markets have benefited from monopolistic powers in tech (further exacerbated by their immense global reach) with an economic backdrop of disinflation (which has so far kept long term interest rates very low thereby boosting valuations).When we do get inflation returning, if it is in the context of reflationary economic conditions, a FTSE100 tracker should start to outperform the US markets.2 -
Another_Saver said:
Everyone has always said that since the Acts of Union. Declinist nostalgic moaning isn't new, it's our oldest tradition. And the things you bemoan were only possible because of the empire (also known as stealing other peoples' countries for your own economic advantage), it's a structural change not an economic one.Steve182 said:
I disagree,Another_Saver said:
For convenience let's use year end 2009 to year-end 2019. This is far too short a time period to infer anything from.Steve182 said:
Last decade the difference has been massively in favour of S & P 500TBC15 said:
So what's the relative performance over say 10yrs?Another_Saver said:
Rather that than the S&P 500 full of dot com valuation consumer electronics and media companies, and healthcare companies that won't be around when the US inevitably switches to public healthcare.TBC15 said:The FTSE 100 is a Jurassic index, to be avoided at all costs.
This is to 2018. You will find something more recent if you persevere on Google I'm sure. The trend has continued in the same direction since then, but that's no indication of what will happen next...The S&P returned 13.3%, the FTSE 100 7.39%, hardly a bad run, just less good. All figures are annualised.
The gap is 5.50%
The FTSE's PE fell from 17.78 to 16.45, -.78% pa
The S&P's PE rose from 20.7 to 24.88 +1.86% pa
So 2.66% of the gap is explained by relative speculation or rerating, leaving 2.77% explained by additional earnings growth in the US. Both countries inflation rates and corporate profits/GDP ratios were comparable and during this period the US experienced a significant corporate tax cut. The 2000s had also been a worse decade for US earnings than the UK, so a reversion to the mean was to be expected.
I don't see a trend, I see volatility, opportunity and value.
I just think we're not doing so well here in the UK.
Over the pond they've created companies like Amazon, Apple, Facebook, Microsoft etc etc etc etc
In China Jack Ma had Alibaba and now has Ant, Richard Liu has JD.
Apple alone is worth the same as the whole FTSE100
OK we have AZN, GSK but nothing much of interest to invest in, just lots of dinosaurs in FTSE100
In the 250 and allshare it's a bit more interesting but we've created nothing scalable.
A real shame, but that's just how it is.
We had the biggest navy in the world once, and the pound was worth >$4.
Is this all part of a cycle that's going to reverse in the coming years? I think not. The main investment opportunities are now elsewhere, and that may not necessarily be in the US.
People were excited about rail right through the 1800s, then it was cars, aviation, radio, phones, the information age, anything with a .com in the name, and now a whole bunch of things all at once - tech, healthcare, consumer staples, cannabis, bitcoin, electric vehicles, renewables..."Technological change does notincrease profits unless firms have lasting monopolies, a condition that rarely occurs...
As Warren Buffet (1999) and Jeremy Siegel (1999, 2000) have pointed out, in a competitive economy technological change largely benefits consumers through a higher standard of living, rather than benefiting the owners of capital." (doi:10.1016/j.pacfin.2005.07.001)UK GDP and corporate earnings have been doing just fine compared with their US counterparts since the Millennium. America's main advantage at the moment is that not only is their own boomer generation flooding their economy with capital, ontop of incredible amounts of QE and fiscal stimulus, but they're also being flooded with cheap capital from the rest of the world. Temporarily that can create an illusion of higher growth, and I grant this situation is without a historical precedent I'm aware of, but it can't last. The UK's main problem pre-covid was why aren't we getting any real productivity growth or real median income growth since 2007? That is the main cause of real earnings growth in the long term.Very good points here. A lack of investment by corporations can result in low productivity growth. If you lower the bar for investment returns by lowering the risk free rate, you dis-incentivise productive investment. Likewise globalisation has led to a surplus of cheap labour which also dis-incentivise capital investments. Logically a return of inflation due to higher labour costs and resulting higher interest rates should force companies to adapt to the new regime and spend money to invest in productivity enhancing capital investments (or try at least).2


Confirm your email address to Create Threads and Reply

Categories
- All Categories
- 354.1K Banking & Borrowing
- 254.3K Reduce Debt & Boost Income
- 455.3K Spending & Discounts
- 247.1K Work, Benefits & Business
- 603.7K Mortgages, Homes & Bills
- 178.3K Life & Family
- 261.2K Travel & Transport
- 1.5M Hobbies & Leisure
- 16.1K Discuss & Feedback
- 37.7K Read-Only Boards