We’d like to remind Forumites to please avoid political debate on the Forum.
This is to keep it a safe and useful space for MoneySaving discussions. Threads that are – or become – political in nature may be removed in line with the Forum’s rules. Thank you for your understanding.
Green, ethical, energy issues in the news
Comments
-
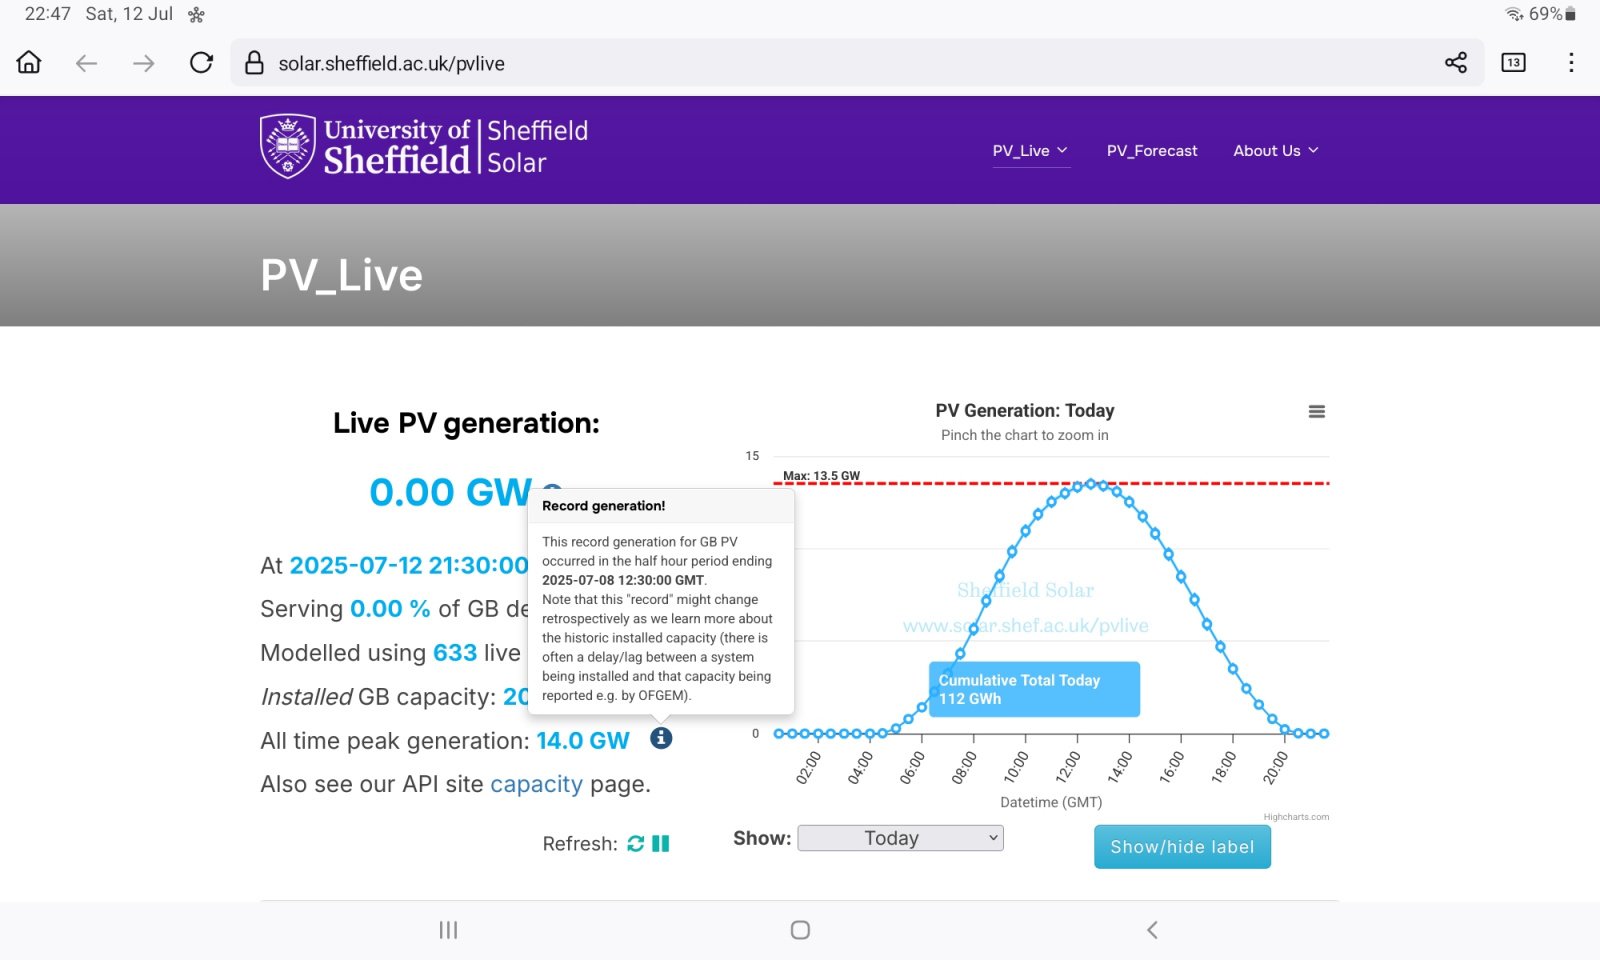
Screwdriva said:Highest observed PV generation in the UK to date!Excellent. I've often wondered how they record solar generation (does it include domestic rooftop?), and how they account for self consumption that never sees the grid.For context, at the bottom of that page Kate cites 22.5GW as the highest average wind production in a 30min period (recorded Dec 2024), so peak solar is around half of peak wind in the UK, and clearly they compliment each other nicely.
I am a Forum Ambassador and I support the Forum Team on the Benefits & tax credits, Heat pumps and Green & Ethical MoneySaving forums. If you need any help on those boards, do let me know. Please note that Ambassadors are not moderators. Any post you spot in breach of the Forum Rules should be reported via the report button, or by emailing forumteam@moneysavingexpert.com. All views are my own & not the official line of Money Saving Expert.4 -
12.76 GW - enough to send ten DeLoreans through time simultaneously, with a little bit spare 😀Screwdriva said:Highest observed PV generation in the UK to date!N. Hampshire, he/him. Octopus Intelligent Go elec & Tracker gas / Vodafone BB / iD mobile. Kirk Hill Co-op member.Ofgem cap table, Ofgem cap explainer. Economy 7 cap explainer. Gas vs E7 vs peak elec heating costs, Best kettle!
2.72kWp PV facing SSW installed Jan 2012. 11 x 247w panels, 3.6kw inverter. 35 MWh generated, long-term average 2.6 Os.6 -
I thought Sheffield uni were the arbiters of solar generation records?
 4.7kwp PV split equally N and S 20° 2016.Givenergy AIO (2024)Seat Mii electric (2021). MG4 Trophy (2024).1.2kw Ripple Kirk Hill. 0.6kw Derril Water.Vaillant aroTHERM plus 5kW ASHP (2025)Gas supply capped (2025)2
 -
thevilla said:I thought Sheffield uni were the arbiters of solar generation records?To be fair to Screwdriva he did say "highest observed" so he might not have been looking at the live stats on the 8th.Link for those that are interested:N. Hampshire, he/him. Octopus Intelligent Go elec & Tracker gas / Vodafone BB / iD mobile. Kirk Hill Co-op member.Ofgem cap table, Ofgem cap explainer. Economy 7 cap explainer. Gas vs E7 vs peak elec heating costs, Best kettle!
2.72kWp PV facing SSW installed Jan 2012. 11 x 247w panels, 3.6kw inverter. 35 MWh generated, long-term average 2.6 Os.3 -
QrizB said:thevilla said:I thought Sheffield uni were the arbiters of solar generation records?To be fair to Screwdriva he did say "highest observed" so he might not have been looking at the live stats on the 8th.Link for those that are interested:Thanks All, thought I'd spotted a 13GW a few days ago but didn't log or register it assuming to qualify it would require verification by some recognised body and published eventually.With new farms coming online almost weekly now we should see it broken with some frequency over the coming years..Let's hope Storage rolls out at the necessary rate to help mop up any excess generation!East coast, lat 51.97. 8.26kw SSE, 23° pitch + 0.59kw WSW vertical. Nissan Leaf plus Zappi charger and 2 x ASHP's. Givenergy 8.2 & 9.5 kWh batts, 2 x 3 kW ac inverters. Indra V2H . CoCharger Host, Interest in Ripple Energy & Abundance.3
-
NedS said:Screwdriva said:Highest observed PV generation in the UK to date!Excellent. I've often wondered how they record solar generation (does it include domestic rooftop?), and how they account for self consumption that never sees the grid.I had it in mind that Sheffield do estimates based on installed PV and PVGIS, but somebody else may have more accurate information.As it is I've done the dishwasher load, a load of washing, the hot water tank is full and am currently charging the car on the granny along with the electric bike and cycle light!I might get a good book and go and sit in the car: the air conditioning is very good!
4 -
At first they had a lot of domestic output uploaded to their site and had forums like on here .They were one of the best places to get info on domestic Pv.2
-
I think you are right. Sheffield Uni were certainly the original source for Gridwatch's estimates of UK PV gen.silverwhistle said:NedS said:Screwdriva said:Highest observed PV generation in the UK to date!Excellent. I've often wondered how they record solar generation (does it include domestic rooftop?), and how they account for self consumption that never sees the grid.I had it in mind that Sheffield do estimates based on installed PV and PVGIS, but somebody else may have more accurate information.As it is I've done the dishwasher load, a load of washing, the hot water tank is full and am currently charging the car on the granny along with the electric bike and cycle light!I might get a good book and go and sit in the car: the air conditioning is very good!
iamkate has this explanation -Solar panels are connected to the local distribution network rather than the national transmission network, so their reported power generation is an estimate from National Grid ESO, based on weather conditions and observed transmission network demand.I assume then that the estimated PV gen, is then added onto the demand figure too, to account for the 'negative' demand that demand side PV will actually shows as?
Hope that makes sense? So if there is an estimate of 5GW of demand side PV generation (not seen travelling down the transmission and distribution networks, but instead reducing demand by 5GW at the customer end (and other nearby customers consuming any local export)), then the total grid demand will be estimated 5GW higher to reflect this?
Or I'm making it all up, as my head is starting to hurt.
Mart. Cardiff. 8.72 kWp PV systems (2.12 SSW 4.6 ESE & 2.0 WNW). 28kWh battery storage. Two A2A units for cleaner heating. Two BEV's for cleaner driving.
For general PV advice please see the PV FAQ thread on the Green & Ethical Board.1 -
Yes, I think NESO estimate the generation from solar farms, then Sheffield Uni add on a bit for all the small-scale generators.N. Hampshire, he/him. Octopus Intelligent Go elec & Tracker gas / Vodafone BB / iD mobile. Kirk Hill Co-op member.Ofgem cap table, Ofgem cap explainer. Economy 7 cap explainer. Gas vs E7 vs peak elec heating costs, Best kettle!
2.72kWp PV facing SSW installed Jan 2012. 11 x 247w panels, 3.6kw inverter. 35 MWh generated, long-term average 2.6 Os.0 -
Looking at https://www.neso.energy/ data portal it's all a bit complicated init? Certainly seems to have superceded the Sheffield site
 4.7kwp PV split equally N and S 20° 2016.Givenergy AIO (2024)Seat Mii electric (2021). MG4 Trophy (2024).1.2kw Ripple Kirk Hill. 0.6kw Derril Water.Vaillant aroTHERM plus 5kW ASHP (2025)Gas supply capped (2025)1


Confirm your email address to Create Threads and Reply

Categories
- All Categories
- 354.5K Banking & Borrowing
- 254.4K Reduce Debt & Boost Income
- 455.5K Spending & Discounts
- 247.4K Work, Benefits & Business
- 604.3K Mortgages, Homes & Bills
- 178.5K Life & Family
- 261.8K Travel & Transport
- 1.5M Hobbies & Leisure
- 16.1K Discuss & Feedback
- 37.7K Read-Only Boards