We’d like to remind Forumites to please avoid political debate on the Forum.
This is to keep it a safe and useful space for MoneySaving discussions. Threads that are – or become – political in nature may be removed in line with the Forum’s rules. Thank you for your understanding.
Debate House Prices
In order to help keep the Forum a useful, safe and friendly place for our users, discussions around non MoneySaving matters are no longer permitted. This includes wider debates about general house prices, the economy and politics. As a result, we have taken the decision to keep this board permanently closed, but it remains viewable for users who may find some useful information in it. Thank you for your understanding.
📨 Have you signed up to the Forum's new Email Digest yet? Get a selection of trending threads sent straight to your inbox daily, weekly or monthly!
The Forum now has a brand new text editor, adding a bunch of handy features to use when creating posts. Read more in our how-to guide
Land registry 0.2% down MOM, 1.5% UP YOY.
Comments
-
Graham_Devon wrote: »What's interesting looking at the graph above is between 1990 and 91 it seemed house price falls also steadied and prices followed the trend line for a short period, before falling off again.
20 years later....same appears to be playing out again.
Longer time on the trend line, but also a longer time above it previously. Maybe that means a longer time below it this time round.
Dear oh dear oh dear.
That's right, every correction is the same.
Pull up the grief chart why don't you.
Wait, can you show us how the correction in the 90's matched the correction in the 80's?
How long and far below the 80's trend line did the correction follow?
Why not try to think about your posts a little before you hit the submit, that way you may not come across as being so desperate.Graham_Devon wrote: »Longer time on the trend line, but also a longer time above it previously. Maybe that means a longer time below it this time round.
P.S., looking at the graph, prices were above the trend line for about the same time in the previous cycle (83 - 91) against (00 - 08):wall:
What we've got here is....... failure to communicate.
Some men you just can't reach.
:wall:0 -
The trouble with trend lines is they only reflect what we know so far. If prices were to start to rise again, then the trend line would be seen to be in a higher position than it is now, or if they continue to fall then the trend line will be lower.0
-
IveSeenTheLight wrote: »Are you seriously trying to say that 4 months are representative of yearly figures?
The OP was saying "if" they are representative and what that would refer to in annual decreases with inflation taken into account.
If you seriously think that selectively taking only the last 4 months of drops and negating the 8 months prior to that, then sorry, but it's not worth hitting my head against a brick wall to discuss this further with you.
It's usually a good idea to read a post that you've quoted") Set your goals high, and don't stop till you get there.
Set your goals high, and don't stop till you get there.
Bo Jackson0 -
IveSeenTheLight wrote: »Why not try to think about your posts a little before you hit the submit, that way you may not come across as being so desperate.
Ooof.
That told me.
Someone didn't like what I had to say!0 -
Graham_Devon wrote: »Ooof.
That told me.
Someone didn't like what I had to say!
Not a problem, get it factually correct and there's no problem.
See you've chosen not to answer the questions posed again though, quelle surprisecan you show us how the correction in the 90's matched the correction in the 80's?
How long and far below the 80's trend line did the correction follow?:wall:
What we've got here is....... failure to communicate.
Some men you just can't reach.
:wall:0 -
Mallotum_X wrote: »The trouble with trend lines is they only reflect what we know so far. If prices were to start to rise again, then the trend line would be seen to be in a higher position than it is now, or if they continue to fall then the trend line will be lower.
The trend line reflects the data over 30 years, so would need a substantial data change to affect the trend, which would then only be by a fraction of a percent.
I think IIRC the trend line was 2.7% in 2005
That said, some people in here should argue that the trend line is now being pulled / skewed downwards as the price is currently below the trend:wall:
What we've got here is....... failure to communicate.
Some men you just can't reach.
:wall:0 -
IveSeenTheLight wrote: »
That said, some people in here should argue that the trend line is now being pulled / skewed downwards as the price is currently below the trend
Wouldn't want to have you all upset again, so I refrain.0 -
Graham_Devon wrote: »Wouldn't want to have you all upset again, so I refrain.
You mean yet again you are proove wrong in your statements and now want to run away rather than acknowledge.
no problem Grahan, it's par for the course.
don't get upset that your wrong again, you must be used to it :wall:
What we've got here is....... failure to communicate.
Some men you just can't reach.
:wall:0 -
IveSeenTheLight wrote: »You mean yet again you are proove wrong in your statements and now want to run away rather than acknowledge.
no problem Grahan, it's par for the course.
don't get upset that your wrong again, you must be used to it
What have I been proven wrong on?
If it's the longer thing...don't get excited. I simply meant larger. Two words starting with the same letter, used to describe something bigger. Slip of the concentration and the wrong word was used.
I also made a spelling mistake.0 -
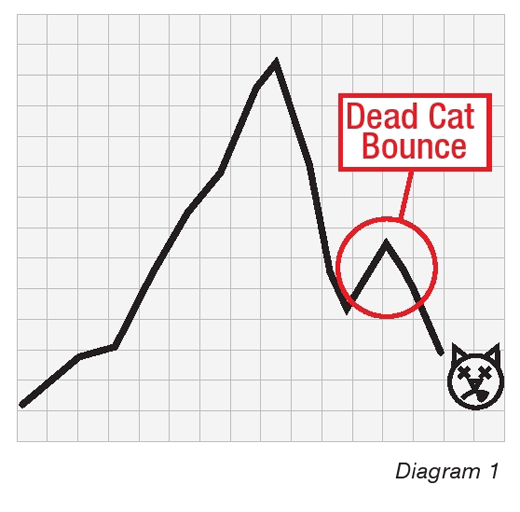
You bought in Aug 2010? I think you 'top-ticked' the 'dead cat bounce' there, to the month.

Your probably right looking in charts, But do the charts bear any relationship to the real world? You have to look at each transaction in isolation. I brought from someone looking for a quick no chain sale. Good move IMO, maybe you should look at the market your interested in or effects you, rather than quoting graphs/timings.
Most properties I know have been on the market, were listed too high in 2009 and since then have had 5k knocked off... even with 5k knocked off I wouldnt entertain them.
When I brought mine, there were still people ringing the agent about the property the day I picked up the keys, hoping for it to fall through, and wanting to have first (second go at it).Plan
1) Get most competitive Lifetime Mortgage (Done)
2) Make healthy savings, spend wisely (Doing)
3) Ensure healthy pension fund - (Doing)
4) Ensure house is nice, suitable, safe, and located - (Done)
5) Keep everyone happy, healthy and entertained (Done, Doing, Going to do)0


This discussion has been closed.
Confirm your email address to Create Threads and Reply

Categories
- All Categories
- 354.6K Banking & Borrowing
- 254.4K Reduce Debt & Boost Income
- 455.5K Spending & Discounts
- 247.4K Work, Benefits & Business
- 604.3K Mortgages, Homes & Bills
- 178.5K Life & Family
- 261.8K Travel & Transport
- 1.5M Hobbies & Leisure
- 16.1K Discuss & Feedback
- 37.7K Read-Only Boards