We’d like to remind Forumites to please avoid political debate on the Forum.
This is to keep it a safe and useful space for MoneySaving discussions. Threads that are – or become – political in nature may be removed in line with the Forum’s rules. Thank you for your understanding.
Debate House Prices
In order to help keep the Forum a useful, safe and friendly place for our users, discussions around non MoneySaving matters are no longer permitted. This includes wider debates about general house prices, the economy and politics. As a result, we have taken the decision to keep this board permanently closed, but it remains viewable for users who may find some useful information in it. Thank you for your understanding.
📨 Have you signed up to the Forum's new Email Digest yet? Get a selection of trending threads sent straight to your inbox daily, weekly or monthly!
The Forum now has a brand new text editor, adding a bunch of handy features to use when creating posts. Read more in our how-to guide
Stay-at-home parents to lose out in child benefit reform
Comments
-
-
Rochdale_Pioneers wrote: »Ok so that was the expenditure side of the balance sheet. And the income side?
Yeah, because Gordon did so well over the past 12 months. Want to remind me how many zeros there are in 165 billion?
And of course, increasing taxation past 40% of GDP is well renowned for private sector recoveries isnt it?0 -
LilacPixie wrote: ȣ20 ish a week 1st child and 13 ish a week for each other child.
£1000 a year then.0 -
you get better post by post - don't let clinical depression hit you, you'd have to rely on the welfare state... that would be beneath you wouldn't it...Yes I did. Economic woes caused by ineffective and wasteful economic policy during the boom years - nothing saved for a rainy day. Conservative 1992-1997 plentiful legacy wasted entirely.
One man responsible, the "Iron" Chancellor.
Socialist - you just have to look at state spending in relation to GDP to relate to that.
this is my favourite part of your post - shows that you'll do anything to protect the Tories. it's quite cute.Or are you too thick to compute that?
btw - how come you don't post the income side in your graph?0 -
Yeah, because Gordon did so well over the past 12 months. Want to remind me how many zeros there are in 165 billion?
And of course, increasing taxation past 40% of GDP is well renowned for private sector recoveries isnt it?
And for the period leading up to 2005 like on your chart?0 -
you get better post by post - don't let clinical depression hit you, you'd have to rely on the welfare state... that would be beneath you wouldn't it...
this is my favourite part of your post - shows that you'll do anything to protect the Tories. it's quite cute.
btw - how come you don't post the income side in your graph?
Because if I were to look at the tax take since 2007, it would probably have clinical depression.
I thought the coalition had ringfenced the NHS budget (at least the productive segments, I would be sh!tting bricks if I were in a middle management NHS non job right now).
Found one, that shows the fantastic Deficit Gordon ran almost every single year he was chancellor.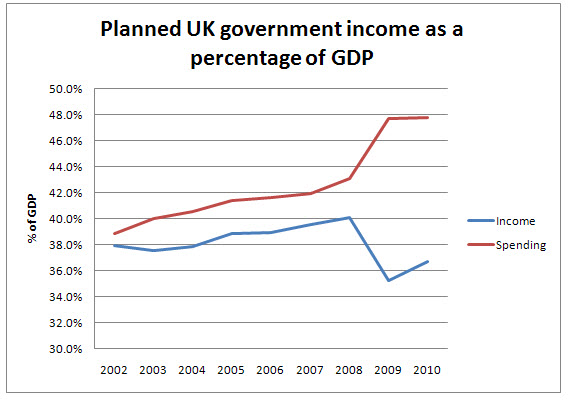
What a f*ckwit he was. Time for the poor people to feel the pain.0 -
-
has the Poor Man's Tory Boy posted the income part of the graph yet...Rochdale_Pioneers wrote: »Ok so that was the expenditure side of the balance sheet. And the income side?0 -
Rochdale_Pioneers wrote: »And for the period leading up to 2005 like on your chart?
Yeah, because it was really difficult raising tax on securitized mortgages that cost this nation hundreds of billions in bailouts, or tax from vat on the hundreds of billions of unsecured lending?
Not to forget income tax on non jobs that were generated and paid for courtesy of the deficit....
Gordon, What a c*nt.0 -
oh dear - it's one of those types that doesn't use his real User Id on the forum because he's a bit cowardly like that...Aberdeenangarse wrote: »Why don't you post your income on the side of the graph? That should give us all a laugh :j
man up - what was your previous user id, stop hiding.0


This discussion has been closed.
Confirm your email address to Create Threads and Reply

Categories
- All Categories
- 354.6K Banking & Borrowing
- 254.5K Reduce Debt & Boost Income
- 455.5K Spending & Discounts
- 247.5K Work, Benefits & Business
- 604.4K Mortgages, Homes & Bills
- 178.6K Life & Family
- 261.9K Travel & Transport
- 1.5M Hobbies & Leisure
- 16.1K Discuss & Feedback
- 37.7K Read-Only Boards