We’d like to remind Forumites to please avoid political debate on the Forum.
This is to keep it a safe and useful space for MoneySaving discussions. Threads that are – or become – political in nature may be removed in line with the Forum’s rules. Thank you for your understanding.
Debate House Prices
In order to help keep the Forum a useful, safe and friendly place for our users, discussions around non MoneySaving matters are no longer permitted. This includes wider debates about general house prices, the economy and politics. As a result, we have taken the decision to keep this board permanently closed, but it remains viewable for users who may find some useful information in it. Thank you for your understanding.
📨 Have you signed up to the Forum's new Email Digest yet? Get a selection of trending threads sent straight to your inbox daily, weekly or monthly!
The Forum now has a brand new text editor, adding a bunch of handy features to use when creating posts. Read more in our how-to guide
who came in to power here?
Comments
-
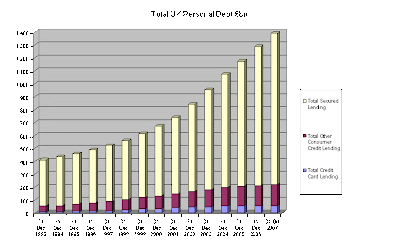
Graham_Devon wrote: »Have this one then, which pretty much shows the same thing:
Sure this one will be argued to death too!
what an impressive chart created in Microsoft Excel from a random blog on the internet - i'm sure that creating charts in MS Excel with random data is something that you can back up what it means Graham?0 -
That just shows total lending? I don't think anyone ever really disputed that chart.This is a system account and does not represent a real person. To contact the Forum Team email forumteam@moneysavingexpert.com0
-
You obviously clicked on the wrong forum heading, it's an easy mistake to take. Better luck next time. p.s. the Debt free wannabe forum is full of wonderful touchy feely types
Sorry, just trying to get involved in the mature, reasoned debate on this thread.Krusty & Phil Madoff, 1990 - 2007:
"Buy now because house prices only ever go UP, UP, UP."0 -
That just shows total lending? I don't think anyone ever really disputed that chart.
My bad, didn't realise that was a chart.
This one then, which I didnt post as it was big. Is it a graph cus it's big? Or just an artpiece? I thought people were disputing it, hence saying stuff like your mother is so fat she had to have reverse audible beeping attached.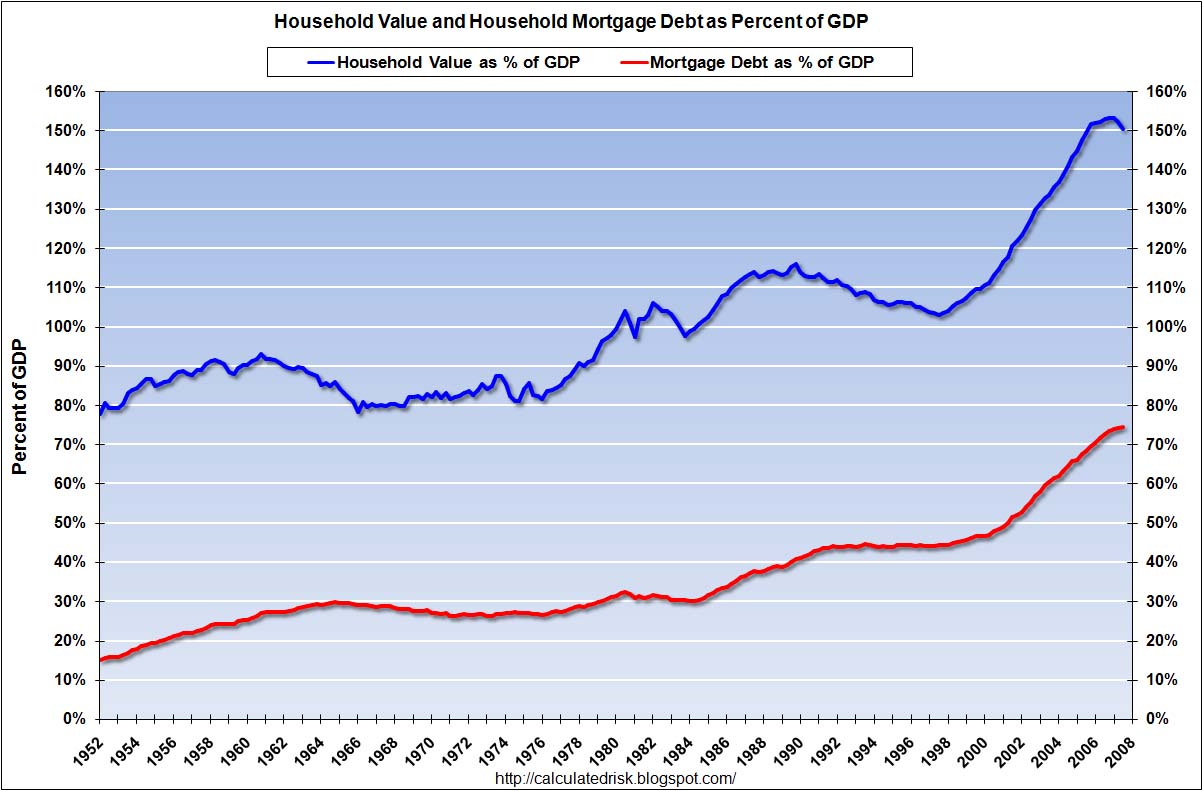 0
0 -
another random chart from a random blog based out of California for the US
what great information you seem to copy from other sites Devon?
http://cr4re.com/Our mail address:
CR4RE, LLC
2967 Michelson Dr., Suite G212
Irvine, CA 926120 -
Or maybe I could just post this.
Words say it all...
1 in 33 people in work
estimated to become unemployed in 2009
£58,360
average household debt
£181m
amount of interest paid in the UK daily
every 10 minutes
a property is repossessed
3,310 people
made redundant every day
1 person every 4.35 minutes
declared bankrupt or insolvent0 -
Graham_Devon wrote: »Or maybe I could just post this.
Words say it all...
1 in 33 people in work
estimated to become unemployed in 2009
£58,360
average household debt
£181m
amount of interest paid in the UK daily
every 10 minutes
a property is repossessed
3,310 people
made redundant every day
1 person every 4.35 minutes
declared bankrupt or insolvent
the thread is about a graph that Geoff doesn't understand but posted to try to make a point, very similar to what you and have done above.
you then post a similar graph that someone put together themselves in Excel without any source data.
what's your point with the above? it's not breaking news, you should really stop revelling in peoples misfortune it's not big and it's not clever.0


This discussion has been closed.
Confirm your email address to Create Threads and Reply

Categories
- All Categories
- 354.4K Banking & Borrowing
- 254.4K Reduce Debt & Boost Income
- 455.4K Spending & Discounts
- 247.3K Work, Benefits & Business
- 604K Mortgages, Homes & Bills
- 178.4K Life & Family
- 261.5K Travel & Transport
- 1.5M Hobbies & Leisure
- 16K Discuss & Feedback
- 37.7K Read-Only Boards