We’d like to remind Forumites to please avoid political debate on the Forum.
This is to keep it a safe and useful space for MoneySaving discussions. Threads that are – or become – political in nature may be removed in line with the Forum’s rules. Thank you for your understanding.
Will AI put bond fund managers out of work?
Comments
-
The remaining opportunities will tend to be where the inputs are uncertain, markets become illiquid, management behaviour matters, or the model is wrong.
Yep to all!
To me, AI has two meanings. The ChatGPT version which came to people's attention in late 2022. And the other one (machine learning) that has been around for a very long time. The ChatGPT version will help fund managers make "better" presentations and allow them to read the prospectuses more easily. The newer agentic version will help them create better models and gather data from a wider range of places. The "old-fashioned" machine learning will make and test better models.
But the common-or-garden bond fund manager will be an also-ran when it comes to better pricing models. They will never do leading edge stuff. They won't have the maths skills, the access to the data or the technology to allow them to have the best models.
For that, looks at the likes of Jane Street Capital. Jane Street, for example, came from pretty much nowhere to make $31bn of EBITDA on $40bn of revenue because of (among other things) the models they create. I watched a presentation to ML PhD students a few year's back from a UK quantitative research firm. They pay enormous amounts to get the brightest and have the technology and data to create and use the best models. That is something that a bond fund manager just does not have access too.
3 -
"For that, looks at the likes of Jane Street Capital. Jane Street, for example, came from pretty much nowhere to make $31bn of EBITDA on $40bn of revenue because of (among other things) the models they create. I watched a presentation to ML PhD students a few year's back from a UK quantitative research firm. They pay enormous amounts to get the brightest and have the technology and data to create and use the best models. That is something that a bond fund manager just does not have access too."
If most of the market remains priced out of these models (either financially, intellectually, or both), then the status quo will remain. But presumably a small number are paying a lot of money for these services, and hopefully using them to make even more money. Presumably much of this centres around high frequency trading, cross-asset arbitrage, and the like, which is not relevant to medium to long term fundamental mispricings.
0 -
With bonds, the question is not simply whether a manager has the cleverest AI pricing model.
A bond fund is a mixture of many decisions: government versus corporate debt; short versus long maturity; fixed versus index-linked; sterling versus foreign currency; and how much credit risk to take. Each choice changes both the income you receive and the chances of capital losses when interest rates, inflation or the economy move.
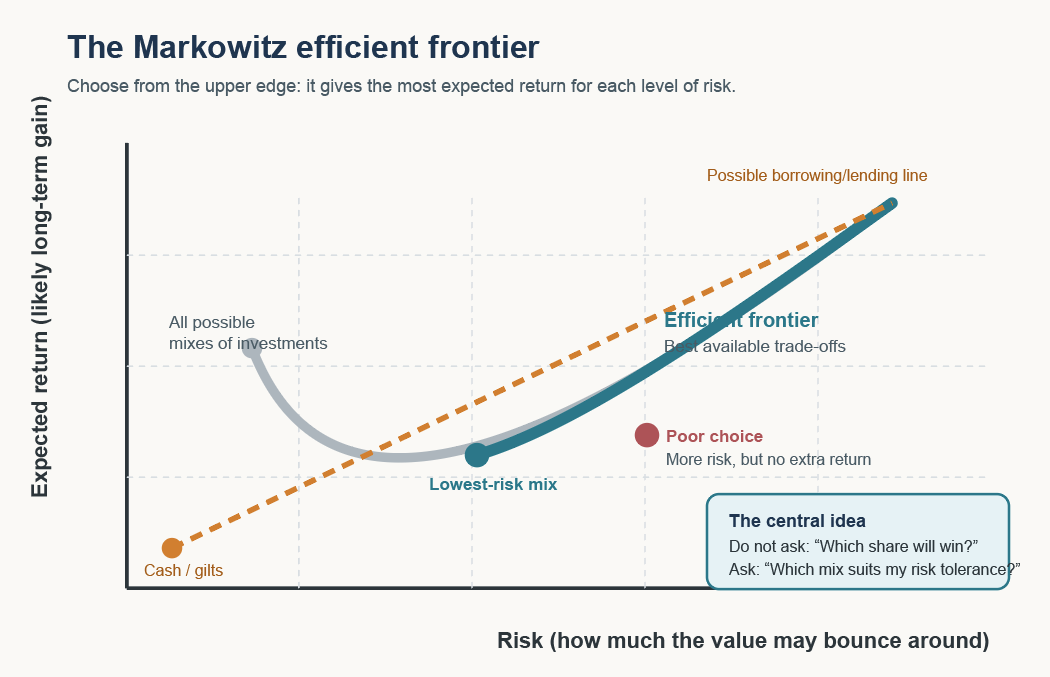
That is where the Markowitz “efficient frontier” idea is useful. It asks whether a fund is giving investors the best expected return for the risk it is taking. A portfolio of gilts, investment-grade corporate bonds and perhaps a modest allocation to riskier debt can be more sensible than simply chasing the highest yield.
AI may help a manager read thousands of prospectuses, process data and spot anomalies. But it cannot repeal the basic trade-off: higher yield usually means someone, somewhere, is taking more interest-rate, inflation, liquidity or default risk. The important question for an ordinary investor is whether the fund’s risks are clear, diversified and appropriate, not whether it employs the flashiest technology.
 0
-
What you tend to see in active investment grade bond funds is that fund managers tilt heavily towards BBB and/or emerging market debt. That can lead to significant outperformance of a market-cap weighted index and doesn't require a fancy AI model, just the right economic conditions. There is also a tendency to favour shorter duration, which reduces interest rate sensitivity, which they don't need as they can harvest the credit risk premium, albeit with rather narrow spreads at the moment.
One of the challenges facing bond fund investors today is that the position of a fund on the risk axis is very hard to determine. I have seen forumites commenting that a particular bond fund has a very smooth price history, but this was largely because it was loaded up with illiquid assets.
What a bond fund manager making these tilts could really use is a model that predicts spreads widening, because that's where the downside risk is, or a market that no longer overreacts because our AI overlords convince everyone it will all be fine.
1 -
I have seen forumites commenting that a particular bond fund has a very smooth price history, but this was largely because it was loaded up with illiquid assets.
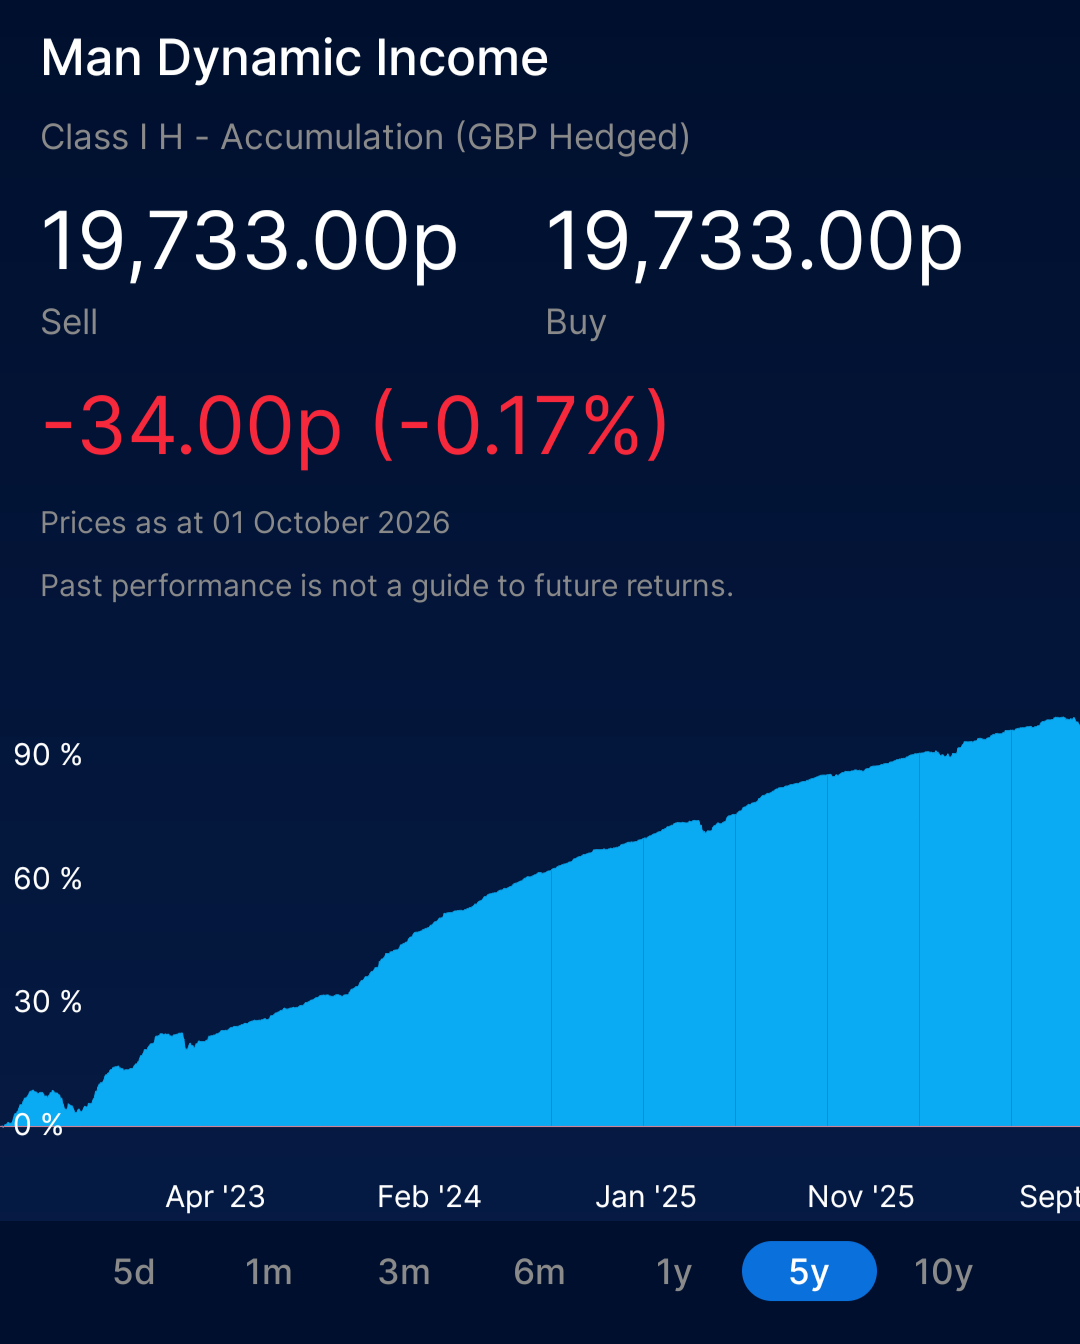
Do I hear my name? It's true that risk is not the same as volatility, which is why Trustnet's FE risk ratings - based on volatility - is a misnomer. Man Dynamic Income's FE of 17 doesn't reflect the risk of its underlying assets, but then again the manager has yet to put a foot wrong...
 0
-
It wasn't you, but it was that fund. Someone else made a rather objectionable comment about it being a no brainer, because you get a smooth ride and it only goes up.
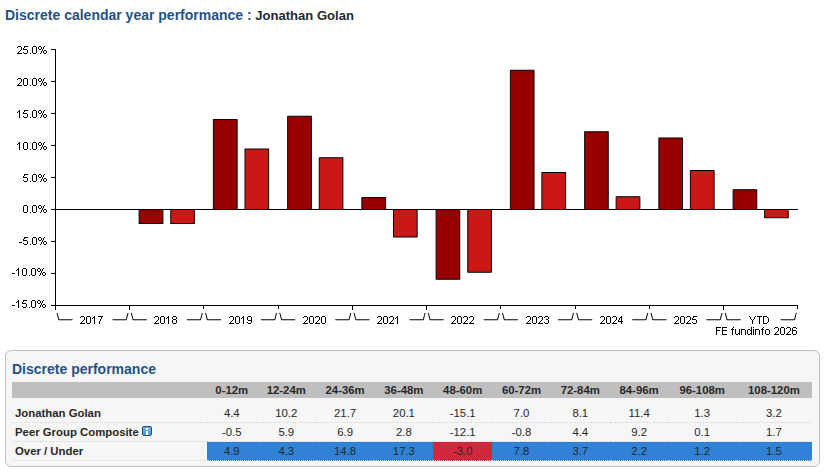
That fund had the benefit of launching during the 2022 bond rout, but Golan's broader track record gives a hint of how it might perform in a stress scenario, albeit he's only been tested once:
 0
-
The 48-60 month underperformance doesn't seem to align with his main fund at the time.
 0
-
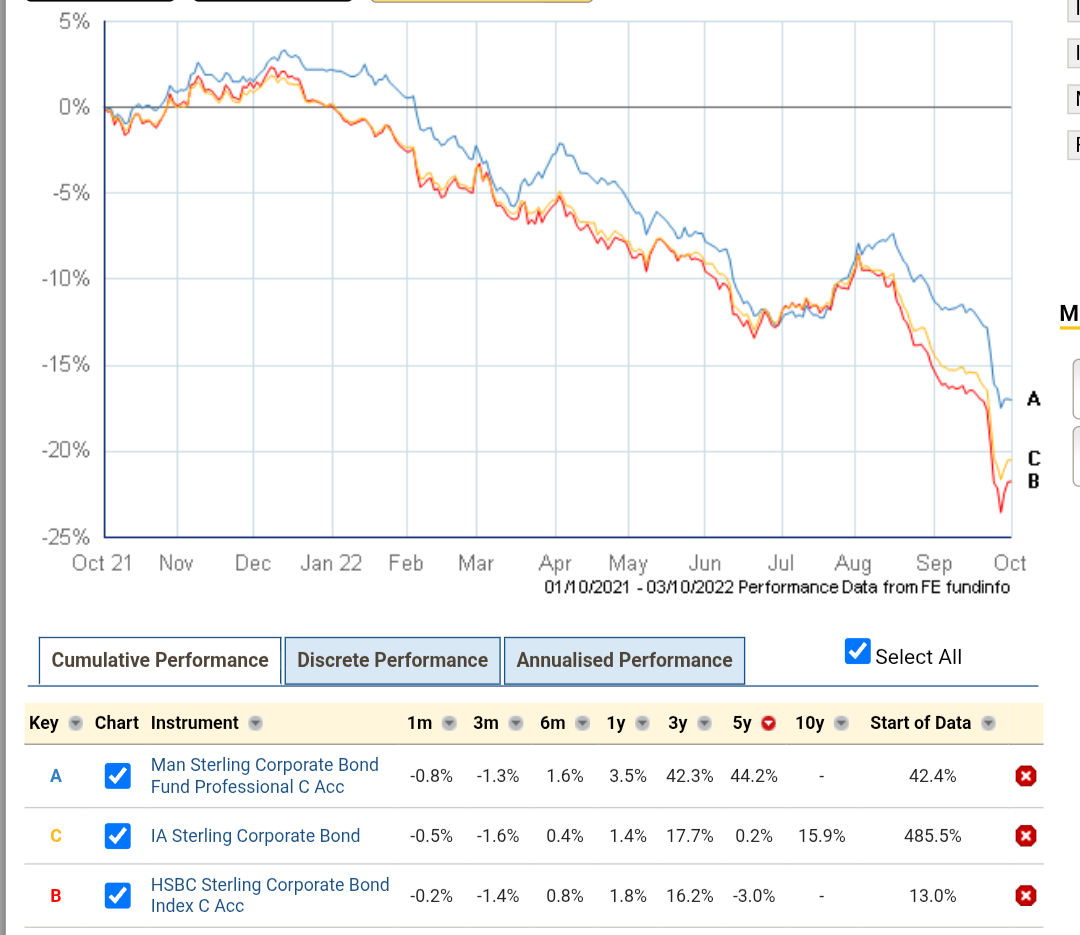
There are three funds to consider, each in different sub-sectors:

Here is what Trustnet has to say about peer group composite:
"For every fund managed by a fund manager, we take its sector average, and combine them over the periods that each of the funds has been managed. The calculation is achieved by constructing an artificial portfolio, as if you had bought and sold all of the sector averages relating to the manager`s funds during the period he/she has managed them. The weighting of each sector relating to each fund is equal, but is halved if the related fund is co-managed. Any periods where we have no record of fund manager performance is treated as a flat period."I didn't know you could do this, but you can actually add a fund manager to a Trustnet multi-chart:
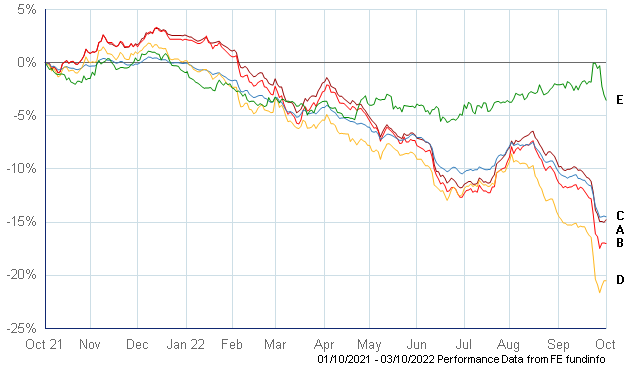
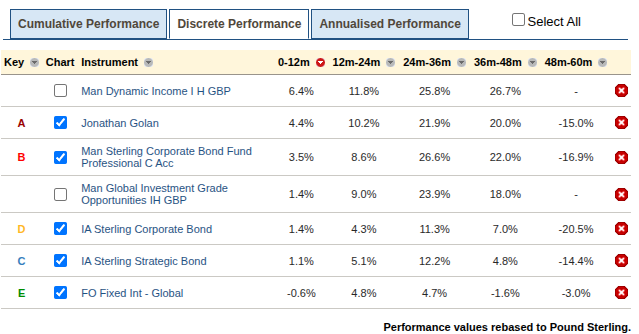
A few things become apparent from this chart.
- His safer Sterling Corporate Bond fund outperformed the sector average
- His overall performance was lifted somewhat by his other two funds (he only lost about 16% overall, whereas his SCB fund lost a few percent more). Though these funds only existed for part of the 48-60m period and benefited from not having legacy holdings that were not well suited to the prevailing conditions.
- The sector average for those other two funds was better, much better in the case of offshore global fixed interest
- If Trustnet performed the peer group composite analysis competently, he underperformed his peers with respect to the other two funds.
My earlier post was intended to illustrate that nobody should be expecting his funds to go up when the wider market tanks. I would factor in a loss-potential of about 20% for the Sterling Corporate Bond fund, and maybe 50% for Dynamic Income, with IG Opportunities somewhere between the two.
0 -
A few comments/questions:
- what is FO fixed interest global which held up so well in a year when interest rates shot up, and is it relevant for our comparisons?
- look at 36-48m. How is Golan's average 20% when his three funds returned 18%, 22% and 26.7%?
- I do not understand "he underperformed his peers with respect to the other two funds". All his funds, every year, outperformed their sector: Dyn Inc vs. strategic bond, and the other two vs. corporate bond.
I agree with loss potential of 20% for Sterling Corporate Bond, but I think 50% is way overstated for Dynamic Income; I do not see Golan as a manager who searches the gutter for yield.
0 -
Dynamic Income carries a number of additional risk factors. It uses derivatives and takes short positions. It can hold up to 40% of the fund in emerging market debt and has in practice gone close to that limit. It is roughly 70% sub-investment grade as of its most recent factsheet.
Looking at the Exposure by Asset Class in the factsheet, it is a pure credit-risk bet, with an effective duration of less than 2 years and a -2.23% short position specifically in "Duration Risk Management", which effectively strips away the interest rate exposure via swaps to isolate credit spread as the return driver. This is combined with both long and short positions in "Single Named Corporate - Derivatives", which looks like a carry-harvesting strategy.
The funds own risk glossary is clear about what that implies: "the extensive use of FDI may significantly multiply the gains or losses" and "the Fund's use of FDI may result in increased leverage which may lead to significant losses". It would be unwise to treat that as meaningless boilerplate. In this case it appears to be the actual mechanism the fund is using to generate the historic outsized returns.
Without knowing any of that, the historic returns also signal very high risk. Generating returns of 20-25% in some years from a bond fund suggests leverage, concentration, or some other form of high compensation for a tail risk that is yet to be seen.
Put all that together and a 50% peak to trough loss in the wake of a systemic credit event is a believable outcome IMHO. This is the main reason I sold my previous toe-dip into this fund after I had researched it a little more thoroughly.
In answer to your other questions:
"what is FO fixed interest global which held up so well in a year when interest rates shot up, and is it relevant for our comparisons?"
Trustnet divides funds into "IA Unit Trusts and OEICs", and "Offshore funds" (amongst others). It calculates separate sector averages for onshore and offshore funds. This is one of several things that annoys me about sector averages on Trustnet. "FO fixed interest global" incorporates all the non-UK domiciled funds investing in the global fixed interest sector and these funds are not included in the IA sector.
Your instinct to look at a relevant index fund in the original chart you posted was the right one. Unfortunately, the Trustnet manager performance stuff is all based on sector averages, which has forced the subsequent discussion away from reasonable benchmarks.
"look at 36-48m. How is Golan's average 20% when his three funds returned 18%, 22% and 26.7%?"
It looks like he picked up Man Euro Corporate Bond during that period. Maybe that is weighing on his overall performance in that year. I also recall you speculating that the IG fund was an offering to large institutional investors, so if the average is weighted and that fund grew large quick, that could have a bearing.
"I do not understand "he underperformed his peers with respect to the other two funds". All his funds, every year, outperformed their sector: Dyn Inc vs. strategic bond, and the other two vs. corporate bond."
It looks to me like it is the IG fund vs other offshore funds that is the main source for this. There is about a 15% underperformance there. I agree with you the other two both outperformed the sector Trustnet selected for them. Dyn Inc took a bit of an early tumble, but had built up a head of steam in the first few months that kept it above the strategic bond fund average.
So if we are dissatisfied with the benchmarks used in Trustnet's analysis, we would need to come up with good alternatives. The best I could do for the IG fund is iShares USD Short Duration Corporate Bond ETF. Which is global, but only USD denominated bonds are included. This performed very well indeed in Oct 21-Oct 22 and would have magnified the IG fund's underperformance to 30% less than the ETF.
For the other funds, SCB could be compared to L&G GBP Corporate Bond 0-5 Year Screened ETF, and the Man fund underperforms by 6%; DI could be compared to iShares USD Short Duration High Yield Corp Bond ETF and it underperforms by a little under 5%.
So the story of all three is one of short duration (or duration hedged) outperforming longer duration, but when compared to short duration ETFs, each performed worse during the bond rout of 2022. But each consistently outperforms in the subsequent good years. Which is what you'd expect from a credit-risk focused approach.
0










Confirm your email address to Create Threads and Reply

Categories
- All Categories
- 355.8K Banking & Borrowing
- 254.9K Reduce Debt & Boost Income
- 456.1K Spending & Discounts
- 248.3K Work, Benefits & Business
- 605.9K Mortgages, Homes & Bills
- 179K Life & Family
- 263.7K Travel & Transport
- 1.5M Hobbies & Leisure
- 16.2K Discuss & Feedback
- 37.7K Read-Only Boards