We’d like to remind Forumites to please avoid political debate on the Forum.
This is to keep it a safe and useful space for MoneySaving discussions. Threads that are – or become – political in nature may be removed in line with the Forum’s rules. Thank you for your understanding.
Intelligent Octopus Go Bills




I've been on this tariff for a couple of years and always found it useful that the PDF bill showed my daily usage broken down into half hour periods. There was also the little graphic showing usage during the peak and off-peak price periods. Simple clear and easy to read. so Octopus decided that that wasnt good enough.
Now Octopus only shows usage after downloading the info as a .csv file. I realise that all the same info is there but it's just not as obvious when shown as columns of numbers.
Is there a way around this, can I get the info in the old format? I have converted the csv file to pdf but it just shows the daily overall cost.
Thanks
Comments
-
That's curious!
My most recent IOG bill still had the 30 pages of half-hourly usage, and the charts.
Might be a question for Octopus's "award winning" customer service to answer?
Edit: are you definitely still on IOG? If you've reached the end of a 12-month period, you'll have been asked if you want to continue and if you didn't reply you might've been moved onto Flexible Octopus?
N. Hampshire, he/him. Octopus Intelligent Go elec / Fuse gas / Vodafone BB / iD mobile. Kirk Hill Co-op member.Economy 7 cap explainer. Gas vs E7 vs peak elec heating costs, Ecoflow Stream, Best kettle :-)
2.72kWp PV facing SSW installed Jan 2012. 11 x 247w panels, 3.6kw inverter. 37 MWh generated, long-term average 2.6 Os.1 -
Most report that once they switch to the '6 hour capped' version of IOG, the daily charts vanish from the bill.
You'll see them up to the point where you changed to the new version of the tariff, but not after that point.
1 -
^ That's an interesting wrinkle in the system, then! My most recent IOG bill was late August, and the 6-hr cap only reached me at the start of September, so that might be why I've not noticed it yet.
N. Hampshire, he/him. Octopus Intelligent Go elec / Fuse gas / Vodafone BB / iD mobile. Kirk Hill Co-op member.Economy 7 cap explainer. Gas vs E7 vs peak elec heating costs, Ecoflow Stream, Best kettle :-)
2.72kWp PV facing SSW installed Jan 2012. 11 x 247w panels, 3.6kw inverter. 37 MWh generated, long-term average 2.6 Os.1 -
The closest you can get is to look at the graphs on the Octopus website, they will show you a day by day split of your home and EV use but they are currently about 2 days behind.
There is no ability to aggregate by week or month, but you can see a near equivalent of the charts you are missing from the bill.
1 -
Sadly, Octopus have seriously messed up their 6 hour cap. So many people having problems with overnight charging now.
Last night I set the app to add 50% and have the car ready by 7am. 7am comes and the car has added 7%. Couple this with the pretty much uncompetitive tariffs compared to other suppliers it looks as though they are just the new iteration of British Gas.
1 -
… and many are having no problems at all with charging, a lot seems to depend on the integration…
Most reports I've seen show no negative issues with the Zappi integration for example.
Dramatic short charging is often the result of using a car integration where the car has gone into a deep sleep and failed to wake…
1 -
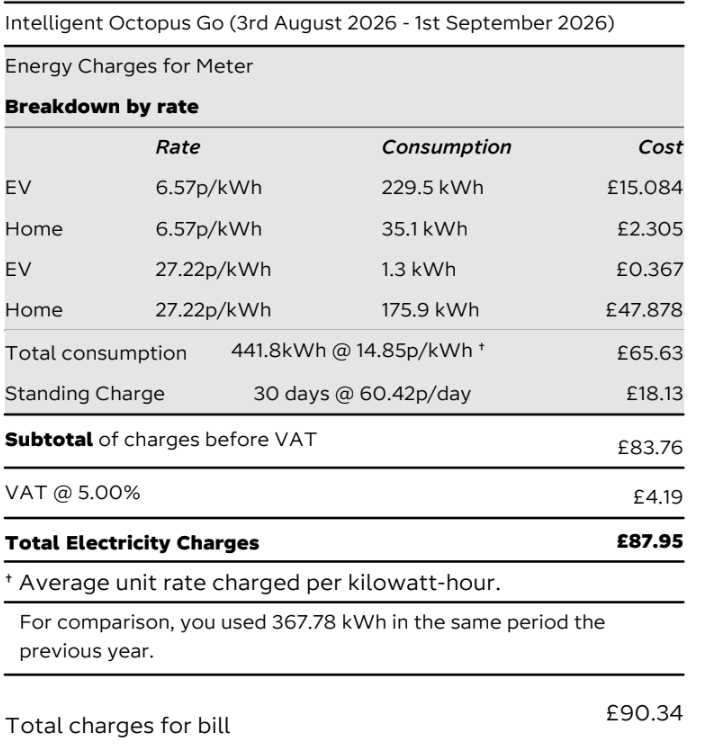
Aug bill was down to one page with times & cost.
But mine made sense, as the only day shown was the one where I had exceeded 6 hour limit. 🤦♀️
Bill is split to EV & Home, unlike before that was peak & off peak.
No issue with over night charging. Ohme, no longer gives option to add % charge. You set the % required at end of charge & % of battery on starting.
 Life in the slow lane1
 -
Yes definitely still on IOG... The change seems to have been triggered as mentioned by MWT above by the 6 hour charge cap.
I think Octopus have made things unnecessarily complicated and opaque by their recent changes. The "happy hours" and split between home use and EV use just make the bill hard to view without the graphs. Not that I've actually charged the car much due to the sunny summer and battery storage. Ah well.…
0 -
Recently on Intelligent Go.
The charge cap feature was enabled after a few weeks and totally mullered my tracking of power use to the date it was enacted.
A chat with the help line informs me the previous to the charge cap details are trying to get fixed and they are still working at it for post charge cap to improve things. Not had issues with no charge (yet….).
Last bill did contain everything up to the large cap, very detailed, nothing after that just what was EV charge and Peak rate charge total, no details.
2 -
On the website you can still see the data you are missing for the days on the capped version of the tariff, it is just split between Home and EV…


All 48 of the HH segments are shown below the graph, you just can't see both home and EV on the same graph.
2





Confirm your email address to Create Threads and Reply

Categories
- All Categories
- 355.7K Banking & Borrowing
- 254.9K Reduce Debt & Boost Income
- 456.1K Spending & Discounts
- 248.3K Work, Benefits & Business
- 605.8K Mortgages, Homes & Bills
- 179K Life & Family
- 263.6K Travel & Transport
- 1.5M Hobbies & Leisure
- 16.2K Discuss & Feedback
- 37.7K Read-Only Boards