We’d like to remind Forumites to please avoid political debate on the Forum.
This is to keep it a safe and useful space for MoneySaving discussions. Threads that are – or become – political in nature may be removed in line with the Forum’s rules. Thank you for your understanding.
Vanguard FTSE Global All Cap in ISA switch to ETF version?
Comments
-
It does not unfortunately, I had already checked that:
I looked at the institutional site too, but you seem to need a login to access that. I expect that accurate daily NAV values will show up eventually. I expect that it is search issue.
0 -
Click "Prices and distribution", and then scroll down to "Historical Prices"
1 -
Thank you very much. Those numbers are good enough, and they are easy to find when you know where they are. We also need the GBP/USD exchange rate at 4:00 pm ET, but Goggle seems to find that without any trouble. The London South East values for the bid and offer prices should be good enough.
0 -
I have done some initial calculations using the Vanguard Professional numbers and the GBP/USD exchange rates from Google AI (I have not checked them). Firstly, for the new Vanguard FTSE Global All Cap ETF VALL:
Price is the mid-price at the London close. Premium is the additional percentage on the mid-market price that you would have had to pay to buy NAV at New York close. The average for the 7 days was 0.32%.
Date
Price
NAV USD
GBP/USD
NAV GBP
Premium
28 Aug 2026
£3.7295
5.0266
1.3538
3.71296
0.44%
27 Aug 2026
£3.7035
5.0356
1.3597
3.70346
0.00%
26 Aug 2026
£3.6955
5.0159
1.3596
3.68925
0.17%
25 Aug 2026
£3.6900
5.0131
1.3650
3.67260
0.47%
24 Aug 2026
£3.6700
4.9936
1.3654
3.65724
0.35%
21 Aug 2026
£3.6913
5.0146
1.3640
3.67639
0.40%
20 Aug 2026
£3.6748
4.9862
1.3625
3.65960
0.41%
Here are the same numbers for Vanguard Developed World ETF VEVE:
Date
Price
NAV USD
GBP/USD
NAV GBP
Premium
28 Aug 2026
£108.3200
146.1864
1.3538
107.982
0.31%
27 Aug 2026
£107.6900
146.4265
1.3597
107.690
0.00%
26 Aug 2026
£107.2000
145.7549
1.3596
107.204
0.00%
25 Aug 2026
£106.9400
145.8136
1.3650
106.823
0.11%
24 Aug 2026
£106.5000
145.2925
1.3654
106.410
0.08%
21 Aug 2026
£107.0000
145.7686
1.3640
106.868
0.12%
20 Aug 2026
£106.6800
145.035
1.3625
106.448
0.22%
The average premium for the 7 days was 0.12%. You would have to pay half the spread in both cases too, of course, but the premium works in your favour if you are selling (unless it is negative).
1 -
Here is another one. Vanguard Global Aggregate Bond ETF VAGS:
Date
Price
NAV (GBP)
Premium
28 Aug 2026
£25.8075
£25.7523
0.21%
27 Aug 2026
£25.8550
£25.8113
0.17%
26 Aug 2026
£25.8450
£25.8301
0.06%
25 Aug 2026
£25.8625
£25.8531
0.04%
24 Aug 2026
£25.8000
£25.7660
0.13%
21 Aug 2026
£25.7350
£25.7342
0.00%
20 Aug 2026
£25.7800
£25.7658
0.06%
The NAV is priced in GBP for this one. The average premium was 0.10%. Switching some of my VEVE for VAGS looks relatively painless.
0 -
I have looked at what would have happened if you had sold £100K of VEVE (or VHVG) and bought VWRL (or VWRP). I have assumed that the trades were done at the closing mid-market prices at the London close (you would need to account for the spreads separately). I calculated the gain (or loss) in dollars at the New York market close (to avoid having to convert currencies). I used 1,798 data points, going back the launch of VWRP in 2019. Here is a histogram for the gain / loss:
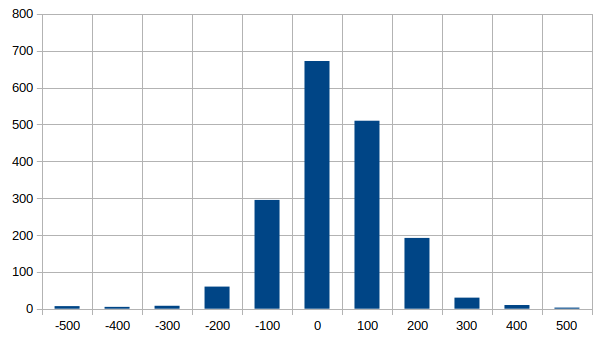
You were likely to gain or lose $100 on the trade. I also plotted a scatter graph for the gain or loss. There was no obvious variation over time, but both of the underlying funds were well established over this period. The mean gain was -$18.67. The standard deviation was $126.12. That corresponds to £93.55 at the current exchange rate, or about 0.1%. The average gain / loss was effectively zero, so a percentage player is not going to worry here.
2 -
To summarise my own feelings on costs after reading this thread for someone who wants the exposure that FTSE Global All-Cap provide:
From a cost perspective, there's no compelling reason to switch an existing OEIC holding into the ETF unless doing so unlocks materially lower platform fees. The time out of the market and other factors could easily outweigh the relatively small (0.16% annual) fee saving.
For new subscriptions, you should consider the platform and transaction fees before deciding on the OEIC or ETF. Everything else being equal, choose the ETF.
Is that reasonable?
0 -
Switching from the FTSE Global All-Cap OEIC to the ETF version is the most favourable case. I would save much less by switching from VEVE. You also do not have the issue of whether adding 9% small caps will be a significant benefit. If your brokerage costs are negligible, you should be in profit within a very few years.
1 -
We are starting to get some data. I have assumed a £100K notional investment in both VEVE and VALL at the mid-market London closing price. I worked out the number of shares the £100K would have bought on each day for both cases. From that, I calculated the corresponding NAVs at the New York close. I subtracted these to get the gain (usually a loss so far) for the trade. I also worked out the average gain / loss over four trading day periods.
VEVE £100K
VALL £100K
VEVE to VALL
Shares
NAV (USD)
Shares
NAV (USD)
Day
Gain (USD)
4 Day Average
925.50
135,001
26,914.28
135,083
13
81.74
924.47
135,700
26,856.45
135,547
12
-152.44
923.28
135,086
26,825.47
134,956
11
-130.14
922.25
135,235
26,856.45
135,174
10
-61.00
-65.46
929.54
134,727
27,027.03
134,641
9
-86.45
933.45
135,167
27,120.11
135,096
8
-71.13
923.19
134,958
26,813.25
134,779
7
-178.44
923.19
134,958
26,813.25
134,779
6
-178.44
-128.62
928.59
135,970
27,001.49
135,969
5
-1.70
932.84
135,965
27,059.94
135,730
4
-235.45
935.10
136,351
27,100.27
135,856
3
-494.48
938.97
136,425
27,247.96
136,065
2
-359.49
-272.78
934.58
136,232
27,090.73
135,849
1
-383.18
The loss for each group of 4 trading days has declined steadily. It is too early to draw firm conclusions, but the results look promising.
3 -
VEVE has been around 12 years and £3.5B in size, VALL has been just a month and already passed £1B
0











Confirm your email address to Create Threads and Reply

Categories
- All Categories
- 355.7K Banking & Borrowing
- 254.9K Reduce Debt & Boost Income
- 456.1K Spending & Discounts
- 248.3K Work, Benefits & Business
- 605.9K Mortgages, Homes & Bills
- 179K Life & Family
- 263.7K Travel & Transport
- 1.5M Hobbies & Leisure
- 16.2K Discuss & Feedback
- 37.7K Read-Only Boards