We’d like to remind Forumites to please avoid political debate on the Forum.
This is to keep it a safe and useful space for MoneySaving discussions. Threads that are – or become – political in nature may be removed in line with the Forum’s rules. Thank you for your understanding.
Increased power consumption following Solar PV installation





We had a 7.2kW solar PV system installed last Tuesday, with a Fox-ESS KH7 inverter and EP12 battery. From the date of the installation our average house power load (kWh) has roughly doubled at all times of the day.
For example, at 05am on the day before the installation our load was 336W. This was typical of the previous 30 day period. This data was downloaded from the Octopus energy customer portal. At 5am on all subsequent days (i.e. after the solar was installed) our load was consistently around 646W.
Other than the usual fridge/freezer we were not using any major appliances at that time
Is there any reason that the inverter itself may be drawing an excessive power load?
Comments
-
That's curious.
Can you share a screenshot of your full day of half-hourly usage from eg. the 25th of May (during the hot spell) and one day last week?
N. Hampshire, he/him. Octopus Intelligent Go elec / Fuse gas / Vodafone BB / iD mobile. Kirk Hill Co-op member.Economy 7 cap explainer. Gas vs E7 vs peak elec heating costs, Ecoflow Stream, Best kettle :-)
2.72kWp PV facing SSW installed Jan 2012. 11 x 247w panels, 3.6kw inverter. 37 MWh generated, long-term average 2.6 Os.0 -
I believe hybrid inverters do draw some "standby" load, some more than others. Does sound rather a lot, if that is the case, though.
0 -
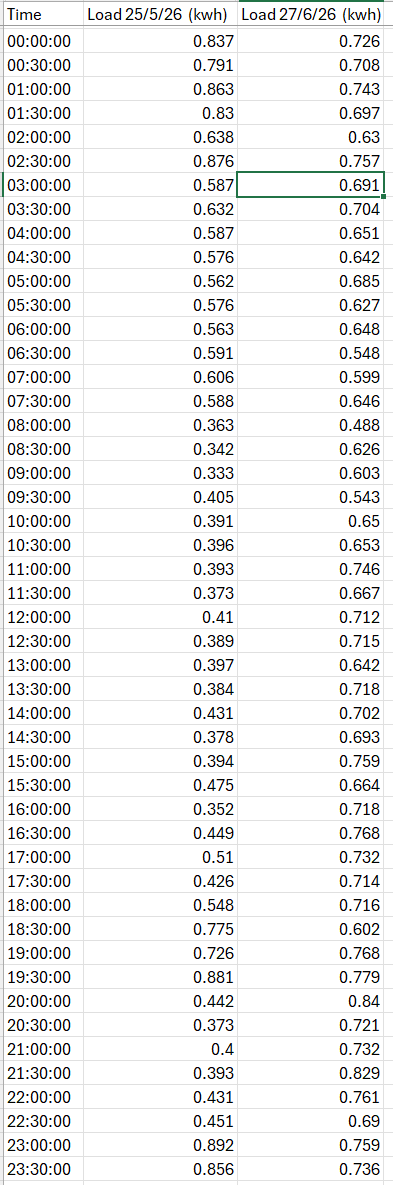
Good idea - thanks for pinpointing the date of the heatwave last month. Here is the comparison for May 25th vs yesterday (June 27th).
I don't recall what our appliance usage was on May 25th, but I think we probably ran the portable air conditioner overnight. We have been away for the last 2 days so there was zero appliance usage yesterday (apart from fridge/freezer and various items in standby for example).
At first glance the figures seem very similar for the first part of the day, but that could easily be explained by the use of the air conditioner on May 25th. For much of the rest of the day on May 25th the load dropped to "normal" observed levels of 300-400W, whereas yesterday the load did not get any lower than 543W (at 9:30am), and was substantially higher than that for most of the day. And this was with the house empty.
 0
0 -
Very strange.
For a household with as much solar PV as you have, I'd expect the electricity use to drop to zero for most of the day.
Here's a typical day (when we didn't charge.our EV) for my household (you've got almost 3x as much solar as we do), presented graphically in the Octopus app:
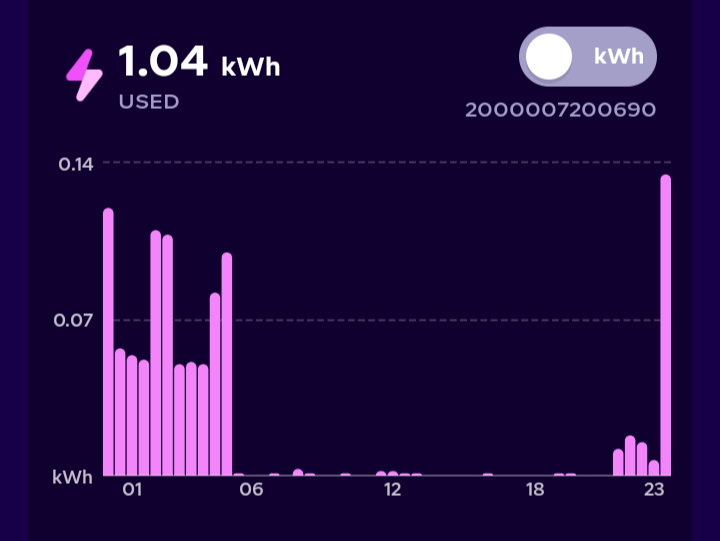
You can see we've got some power usage overnight but during the daytime it's practically zero. The tiny pink bars are just a result of our sola-and-battery being not quite perfect at tracking our demand.
In your case, with solar and battery I'd expect your use to be essentially zero all day.
Are you sure the solar PV has been commissioned? What does the display on the inverter say? Is the reading on the generation meter (the one the solar installers fitted) increasing day on day? Do you know how to read the export register on your smart meter, and is that also increasing day on day?
Sorry for asking many questions but there's definitely something wrong here!
N. Hampshire, he/him. Octopus Intelligent Go elec / Fuse gas / Vodafone BB / iD mobile. Kirk Hill Co-op member.Economy 7 cap explainer. Gas vs E7 vs peak elec heating costs, Ecoflow Stream, Best kettle :-)
2.72kWp PV facing SSW installed Jan 2012. 11 x 247w panels, 3.6kw inverter. 37 MWh generated, long-term average 2.6 Os.2 -
That data looks all wrong; not at all what it is supposed to be. Is your battery actually doing anything? It should be charging whilst the sun shines, to 100% I would have thought. Then discharging as the sun goes down so the import, what Octopus sees as the load, should be near zero until the battery has discharged down to its allowed minimum (which is 10% in my case).
Reed0 -
I should clarify that my figures are for the house load (i.e. total power being consumed from solar, battery, or the grid), not just the power being imported from the grid. Power being imported from the grid is zero for most of the day at the moment.
1 -
Ok, when you said in your opening post:
This data was downloaded from the Octopus energy customer portal.
... I assumed it was the usual Octopus import data that every smart meter customer has access to.
You're saying it isn't that?
Octopus as a general rule don't have access to info regarding your house load in the way you're describing it. They certainly don't have that data for my property, despite me being their customer for years.
What role do Octopus play here? Where is this data from exactly, and how is it generated/collected?
You've got data from before your solar PV system was installed, so it's not synthetic data from your inverter. Have Octopus installed additional equipment in your house for some reason?
N. Hampshire, he/him. Octopus Intelligent Go elec / Fuse gas / Vodafone BB / iD mobile. Kirk Hill Co-op member.Economy 7 cap explainer. Gas vs E7 vs peak elec heating costs, Ecoflow Stream, Best kettle :-)
2.72kWp PV facing SSW installed Jan 2012. 11 x 247w panels, 3.6kw inverter. 37 MWh generated, long-term average 2.6 Os.0 -
Use the isolator to turn off the solar for one day and see what happens. Repeat for the battery.
Also probably a good idea to post a circuit diagram of the major components, indicating the measuring point, if you can.
0 -
Data for May 25th is downloaded from Octopus, and is all imported from the grid as this was before the solar was installed.
Data for yesterday (June 27th) is derived from the inverter, as neither Octopus nor my smart meter report on current house load - only on energy imported from the grid. I use Home Assistant/Predbat, connected to the inverter via an RS485 adapter, to obtain and store this data. I also cross check this data periodically with the "Home" figure in the Foxcloud app.
0 -
So you're using different meters for the different days? I'd expect them to read slightly different if that's the case. And one is a revenue-grade meter (i.e. should be fairly accurate) while the other is not (i.e. likely not to be so accurate)?
1




Confirm your email address to Create Threads and Reply

Categories
- All Categories
- 355.7K Banking & Borrowing
- 254.9K Reduce Debt & Boost Income
- 456.1K Spending & Discounts
- 248.3K Work, Benefits & Business
- 605.8K Mortgages, Homes & Bills
- 179K Life & Family
- 263.6K Travel & Transport
- 1.5M Hobbies & Leisure
- 16.2K Discuss & Feedback
- 37.7K Read-Only Boards