Ready, steady… save!
You don’t need a chart to join in. Here are 2 ways to record your savings:
1. Cross it off
Pop a chart into your first post. Saved an amount? Cross it out! Read more »
£0.01 £0.02 £0.03
2. Write it down
Skip the chart and add updates to your first post. Read more »
“Another +£3 saved today. Go me!”
Use +£ before each new saving so it counts towards your total.
📨 Have you signed up to the Forum's new Email Digest yet? Get a selection of trending threads sent straight to your inbox daily, weekly or monthly!
Shawbrook 7 years fixed rate, would you go for that?
Comments
-
Thats a bit of a pain as I was going to add the other 19k to my 3 year fix I opened last year at 4.22. guess I will put 20k in that and open a 7yr for my wife.
0 -
This product is not inherently bad, but it is niche. Its strength is certainty; its weakness is rigidity. The critical question is not “is 4.2% good”, but “do I need guaranteed nominal returns for exactly 7 years”. If the answer is no, shorter fixes or a mixed strategy are usually more robust. A more balanced approach many people take is laddering:
- Split across 1-, 2-, 3-, 5-year fixes
- Keep some in easy access
- Keep some in equities
That reduces the risk of being locked in at the wrong point in the rate cycle.
3 -
-
In common with most equity funds, ATT has done well over the last 10 years or so, but it did not do well in some periods since it was formed in 1995. The period from 2000 to 2007 (i.e., after the last tech bubble burst) I mentioned in my previous post was one such period - during those years ATT had a total return of -55%. Of course, anyone who bought ATT in 2000 and held on through the bad times would have seen their investment break even (in nominal terms) towards the end of 2013 and then seen the fantastic returns from then to date.
Whether over the next 7 years it (or other equity funds) will behave more like the last 7 years, the 7 years from 2000-2007 or somewhere between those two extremes is unknown and unknowable. In the long-term, equities have always increased in value but, in real terms, the long-term has been upwards of 20 years or so.
0 -
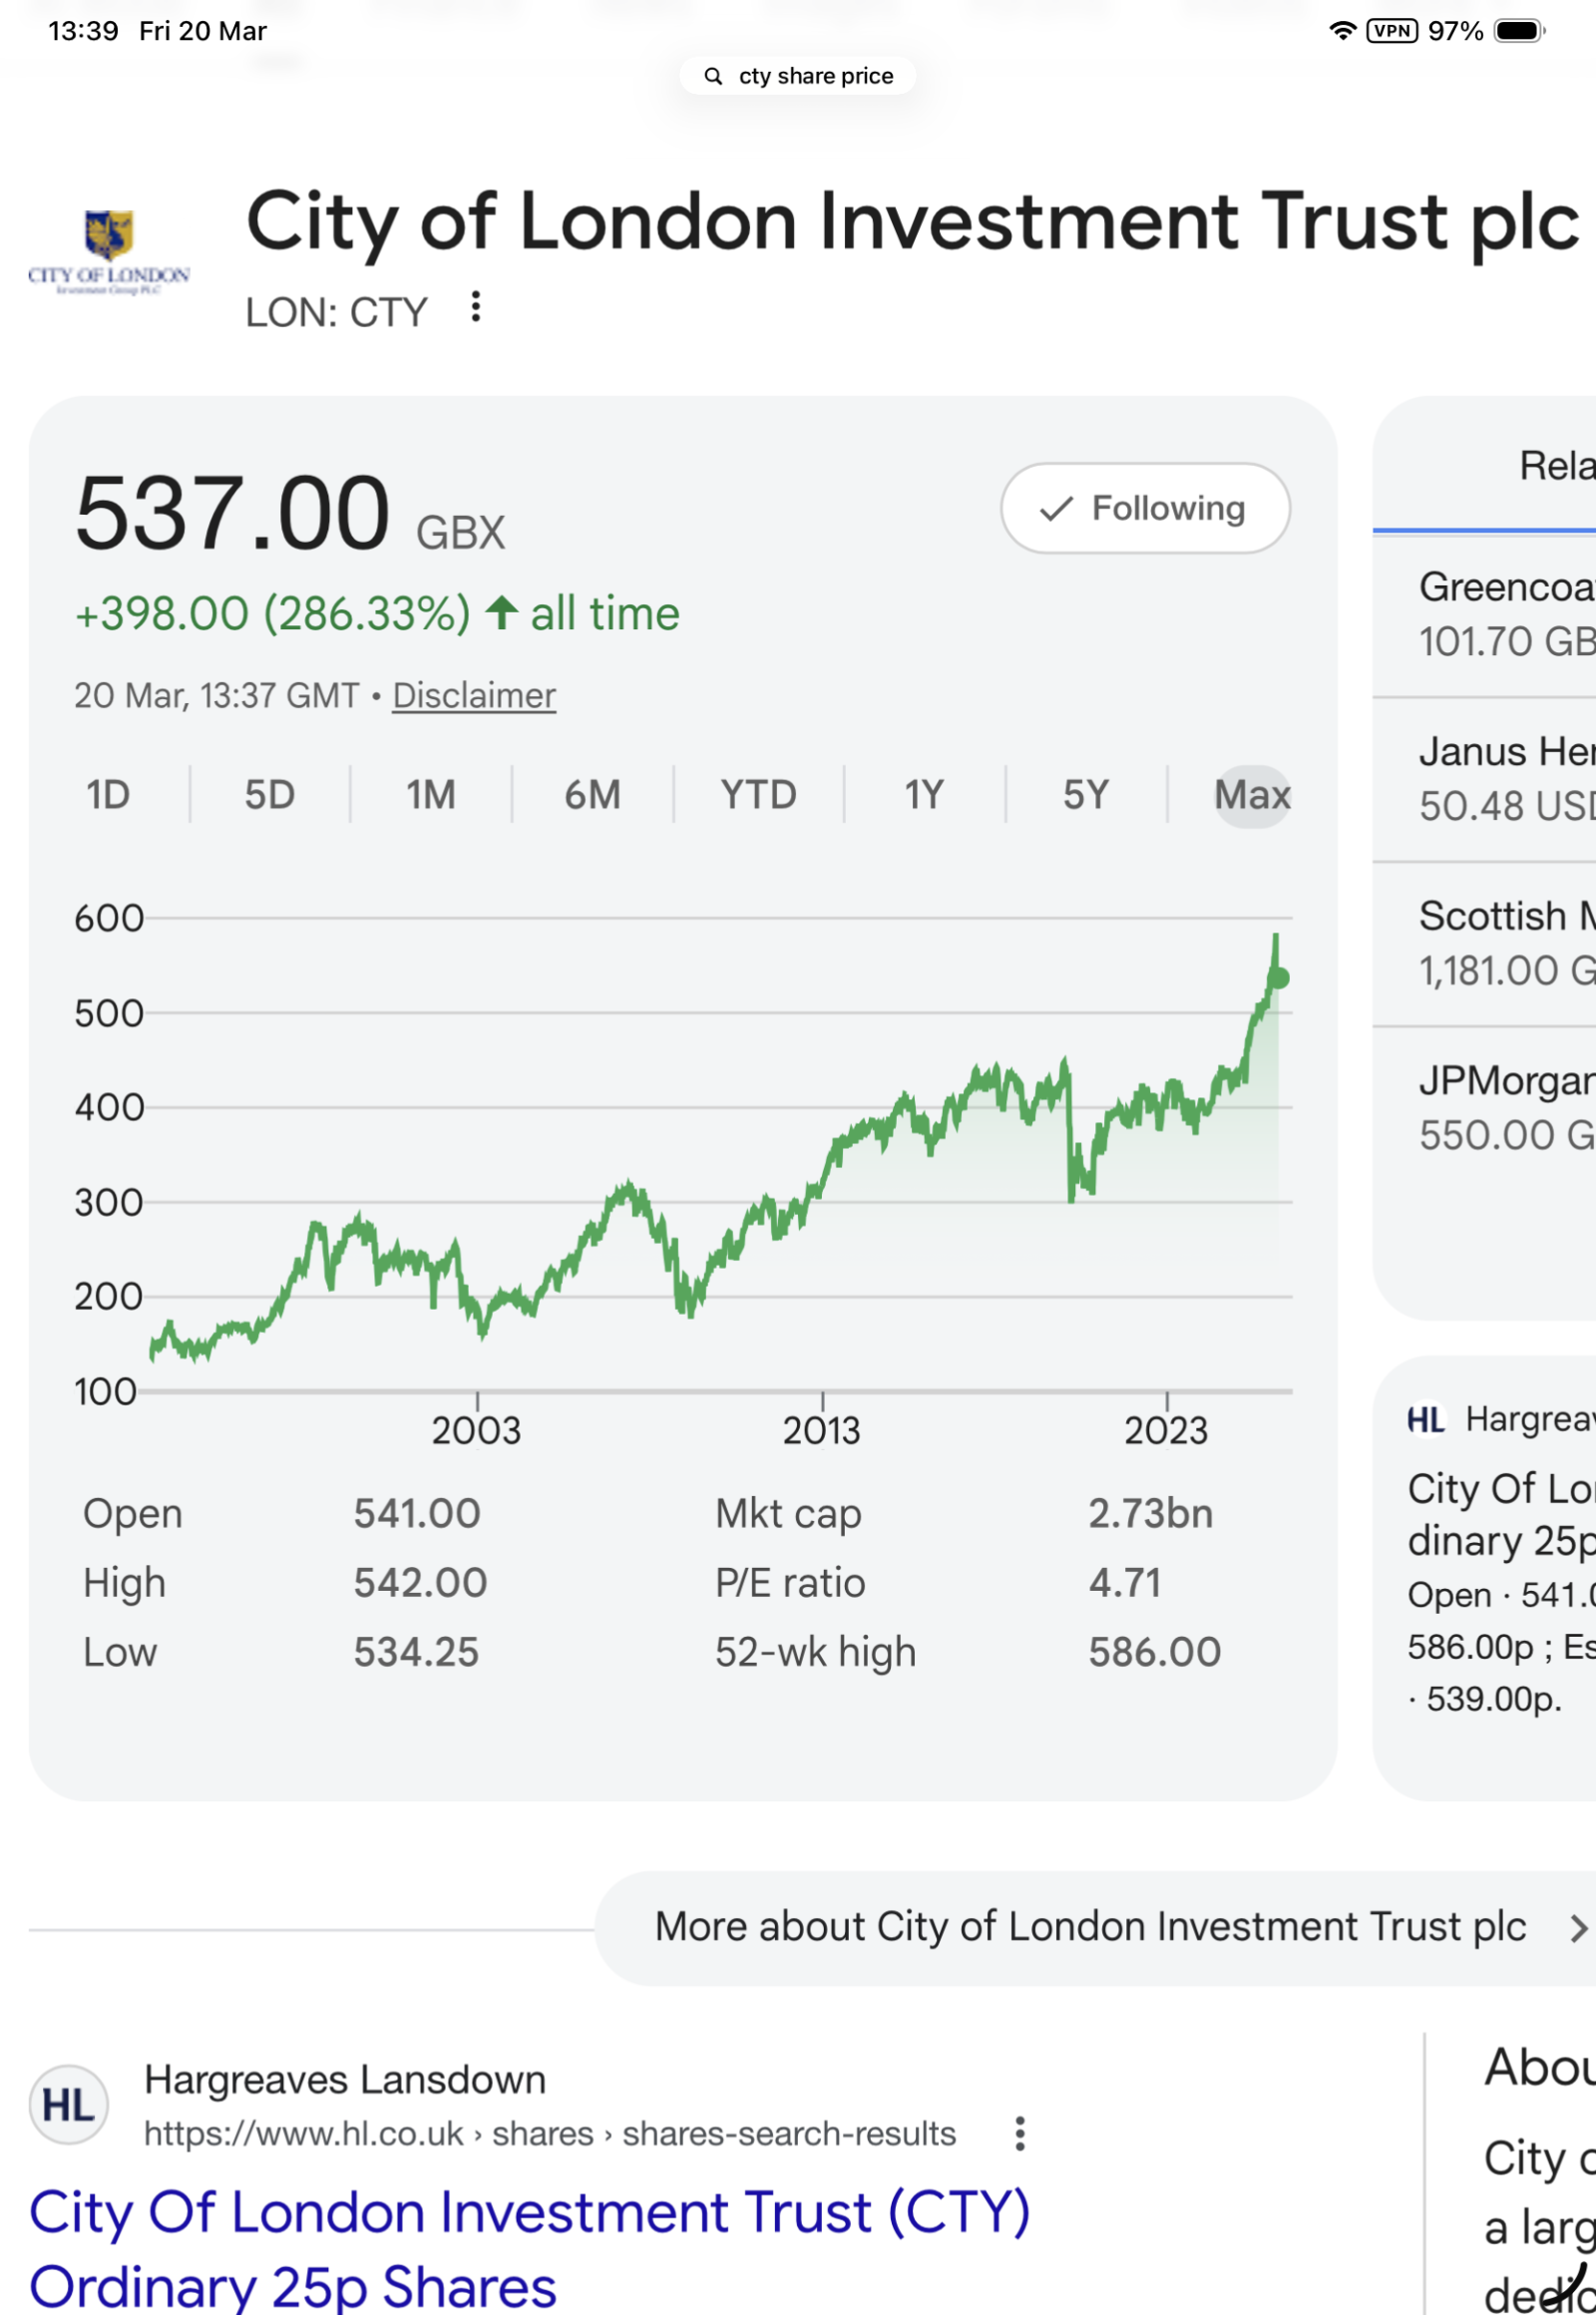
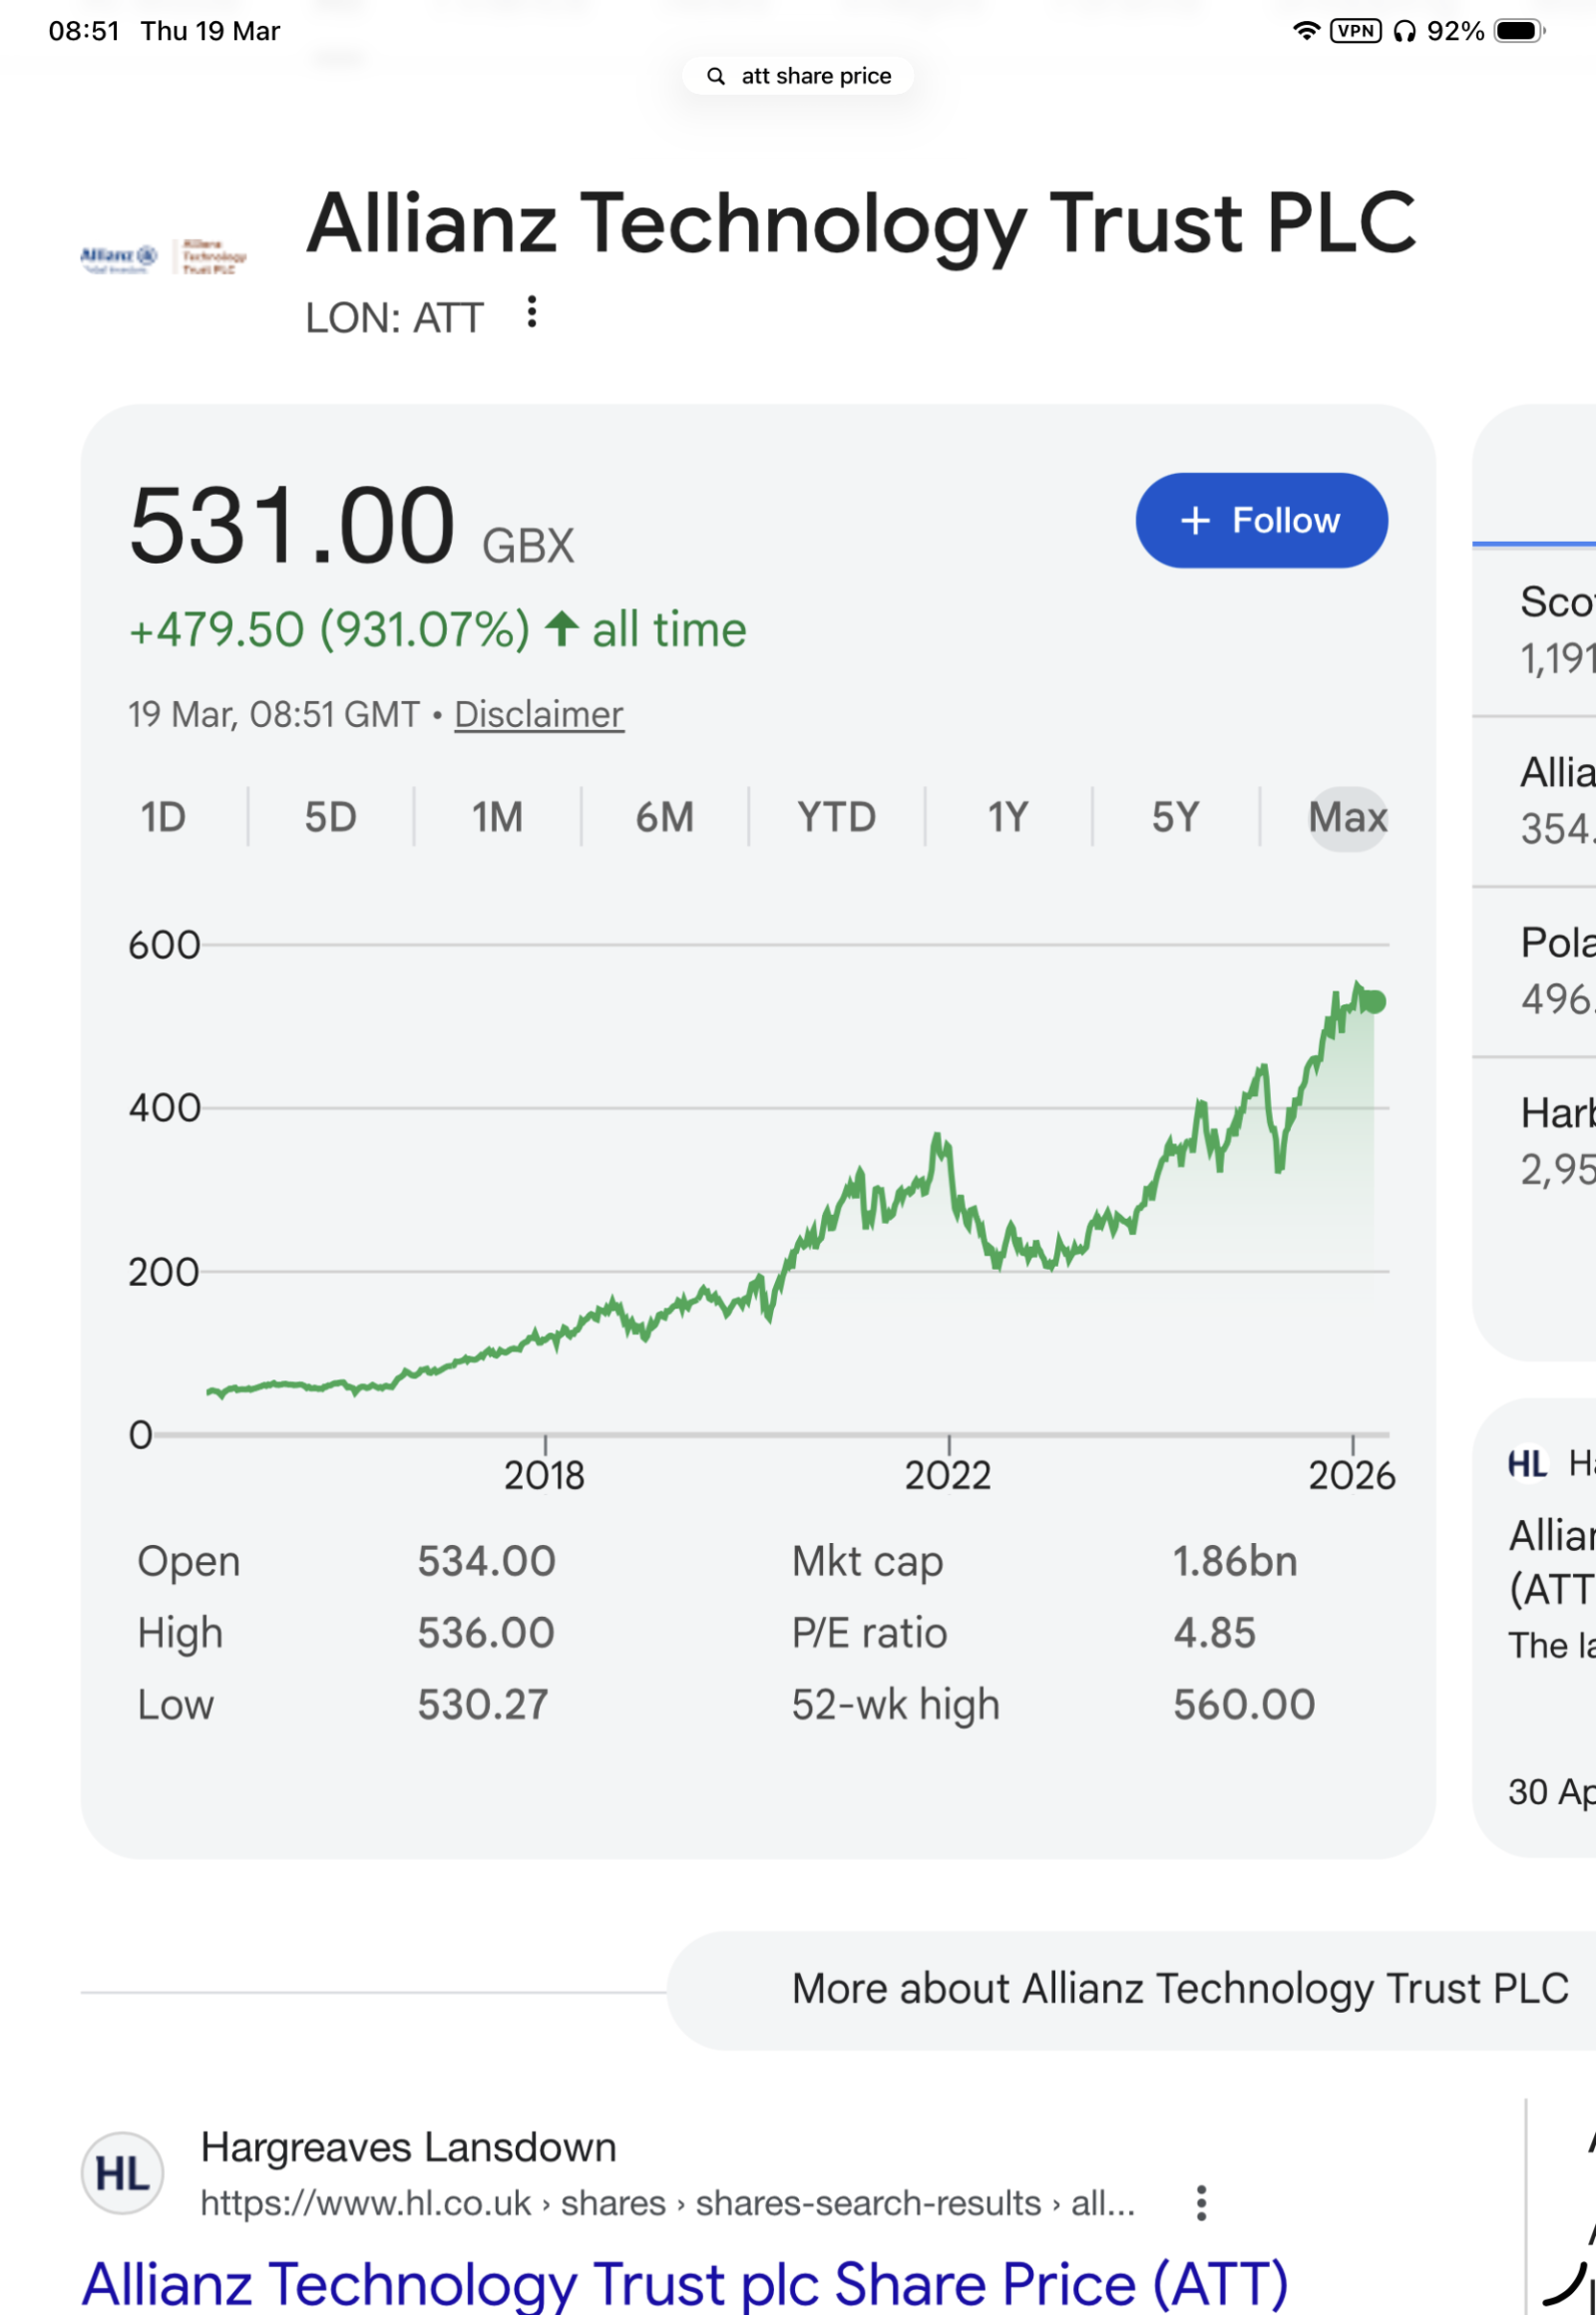
That Google graph doesn’t go further back than 2014 for “Max” which is odd as it goes further back for CTY …
 0
-
Probably because this trust was originally Finsbury Tech Trust (approx 1995, I think), then it became something like RCM Tech Trust before eventually becoming Alliance Tech Trust. So, the Ticker(s) would most likely have changed too.
1 -
Fidelity have prices of ITs typically going back as far as the late 1960s or early 70s (where they existed). For example, ATT is at (click on 'interactive chart'). Here's the graph for ATT back to inception in 1995.
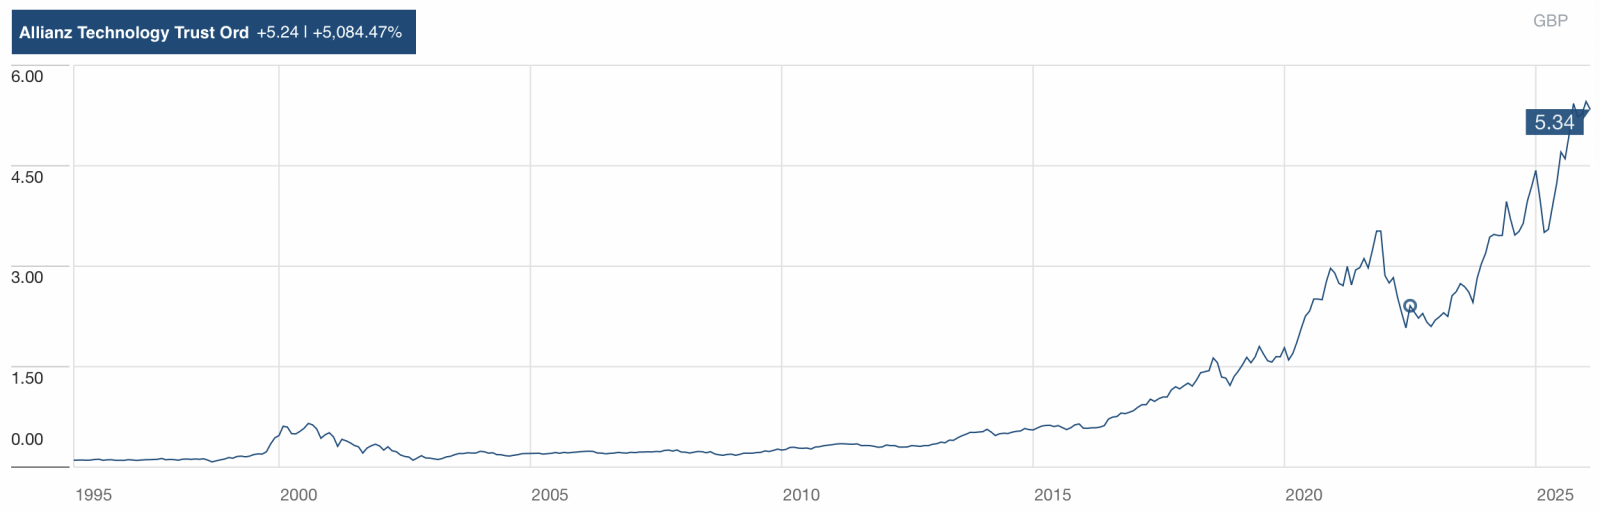
While it did OK for the first 20 years of its life (notwithstanding the dotcom bust), it is only the last decade or so where it has done really well. I've no idea whether 'tech' will continue to perform well or not over the next few years.
0 -
I imagine if you put a log scale on the y-axis, the recent period would become quite reminiscent of the post-millennium period. It will be interesting to see if history repeats or rhymes.
0 -
On the subject of O/P, April 23 had a few maturing fixed rates ISAs, rates looked quite settled, fixed 7 years at 4.10%, couple of months later paid 365 day penalty, August 23 fixed again at 5.61% for 4 years.
1 -
Yes, it's important to remember that it is easy to become anchored to rates being at a particular level and then become very disappointed when they rise. I can remember taking out some fixes around 2020 and being very glad when they matured and I was able to reinvest at much improved rates!
1














Confirm your email address to Create Threads and Reply

Categories
- All Categories
- 356K Banking & Borrowing
- 255K Reduce Debt & Boost Income
- 456.3K Spending & Discounts
- 248.5K Work, Benefits & Business
- 606.2K Mortgages, Homes & Bills
- 179.1K Life & Family
- 264K Travel & Transport
- 1.5M Hobbies & Leisure
- 16.2K Discuss & Feedback
- 37.7K Read-Only Boards