We’d like to remind Forumites to please avoid political debate on the Forum.
This is to keep it a safe and useful space for MoneySaving discussions. Threads that are – or become – political in nature may be removed in line with the Forum’s rules. Thank you for your understanding.
📨 Have you signed up to the Forum's new Email Digest yet? Get a selection of trending threads sent straight to your inbox daily, weekly or monthly!
The Forum now has a brand new text editor, adding a bunch of handy features to use when creating posts. Read more in our how-to guide
Is the 4% rule still applicable today?
Comments
-
That's what I'm saying - we might have missed the inherent worry about the future within the question. Twenty years ago the 4% rule was gladly accepted and it has worked pretty well up to now, so why are people now questioning it?westv said:
Fear? I didn't notice any fear.Bostonerimus1 said:
Another tweak that can be made to retirement portfolios that models have shown improves SWR is a rising equity allocation with age after retirement. Here's a paper by Pfau.OldScientist said:
Yes, the rising percentage of portfolio will result in a smaller (but not depleted) portfolio since it extracts more income - it is less extreme than VPW, which in one form will completely deplete the portfolio at the end of the planning period. The following graphs show real portfolio value (top row) and real WR (lower row) at various percedntiles (0=worst case, 10, 25, 50=median, 75, and 99=best case) as a function of time for rising PoP (left column) and constant PoPTriumph13 said:A fascinating little analysis OldScientist. Thank you. Is the reason you have upped the variable percentage by 0.2% pa because you are aiming for portfolio depletion? I'm always nervous of such an approach in case one ends up living longer than expected. Fortunately I have inheritance as a key aim so I'm happy with a constant perecntage.
Plenty of off the shelf lifestyling funds are available Bostoneremus1 where assets are progressively moved into suitable gilt funds to try to minimise last minute volatility in the amount of annuity income that can be purchased. They have long been the standard for work DC pensions before the drawdown freedoms came in and are probably worth the marginally higher fees for most people vs trying to manage the locking in of annuity rates themselves. I do agree that, unless annuity rates crash again in another bond bubble, we definitely need to move back to annuities being the default position for the average pensioner. I fear that won't happen until we have an awful lot of people screw up their drawdown.
As expected, the amount in the portfolio was lower for the rising case and the withdrawals after 10-20 years were higher in the worst cases, but lower towards the end.
A smaller increase in the percentage (e.g., 0.1 pp per year instead of 0.2) will make the graphs closer to constant case. Again, this is, yet another, decision to be made. Personally, a rising percentage makes sense for us since we are unlikely to need income from our portfolio once our state pensions are in payment (we were aiming for a peak income after 10-15 years and then zero after that).
https://www.financialplanningassociation.org/article/journal/JAN14-reducing-retirement-risk-rising-equity-glide-path
The allocation to bond/fixed income at retirement is to reduce sequence of returns risk, but as the diminishes as you age you go to more equities for their greater potential return. This sort of approach is psychologically easier to use when you have taken pressure off your SWR by reducing fixed costs and maybe with partial annuitization...but of course an annuity is the ultimate in conservative fixed income ;-)
But we might be missing the fear behind the original question. The 4% rule is derived from historical data from stock and bond markets and in times like these is that really a sensible way to approach retirement. The world looks scary to many people and uncertainty is not conducive to long term planning and if the economy changes significantly from what it was in the past then the 4% rule will become irrelevant; for all we know it already is.And so we beat on, boats against the current, borne back ceaselessly into the past.0 -
Just to be clear, the rising percentage withdrawal I used above is a percentage of the portfolio not a constant inflation adjusted withdrawal (SWR) - i.e., variable withdrawals.Bostonerimus1 said:
Another tweak that can be made to retirement portfolios that models have shown improves SWR is a rising equity allocation with age after retirement. Here's a paper by Pfau.OldScientist said:
Yes, the rising percentage of portfolio will result in a smaller (but not depleted) portfolio since it extracts more income - it is less extreme than VPW, which in one form will completely deplete the portfolio at the end of the planning period. The following graphs show real portfolio value (top row) and real WR (lower row) at various percedntiles (0=worst case, 10, 25, 50=median, 75, and 99=best case) as a function of time for rising PoP (left column) and constant PoPTriumph13 said:A fascinating little analysis OldScientist. Thank you. Is the reason you have upped the variable percentage by 0.2% pa because you are aiming for portfolio depletion? I'm always nervous of such an approach in case one ends up living longer than expected. Fortunately I have inheritance as a key aim so I'm happy with a constant perecntage.
Plenty of off the shelf lifestyling funds are available Bostoneremus1 where assets are progressively moved into suitable gilt funds to try to minimise last minute volatility in the amount of annuity income that can be purchased. They have long been the standard for work DC pensions before the drawdown freedoms came in and are probably worth the marginally higher fees for most people vs trying to manage the locking in of annuity rates themselves. I do agree that, unless annuity rates crash again in another bond bubble, we definitely need to move back to annuities being the default position for the average pensioner. I fear that won't happen until we have an awful lot of people screw up their drawdown.
As expected, the amount in the portfolio was lower for the rising case and the withdrawals after 10-20 years were higher in the worst cases, but lower towards the end.
A smaller increase in the percentage (e.g., 0.1 pp per year instead of 0.2) will make the graphs closer to constant case. Again, this is, yet another, decision to be made. Personally, a rising percentage makes sense for us since we are unlikely to need income from our portfolio once our state pensions are in payment (we were aiming for a peak income after 10-15 years and then zero after that).
https://www.financialplanningassociation.org/article/journal/JAN14-reducing-retirement-risk-rising-equity-glide-path
The allocation to bond/fixed income at retirement is to reduce sequence of returns risk, but as the diminishes as you age you go to more equities for their greater potential return. This sort of approach is psychologically easier to use when you have taken pressure off your SWR by reducing fixed costs and maybe with partial annuitization...but of course an annuity is the ultimate in conservative fixed income ;-)
But we might be missing the fear behind the original question. The 4% rule is derived from historical data from stock and bond markets and in times like these is that really a sensible way to approach retirement. The world looks scary to many people and uncertainty is not conducive to long term planning and if the economy changes significantly from what it was in the past then the 4% rule will become irrelevant; for all we know it already is.
The effects of changing allocation are relatively small and possibly localised to the US. The results Estrada presents (https://blog.iese.edu/jestrada/files/2015/08/Glidepath-2.pdf - there's a later version available at https://blog.iese.edu/jestrada/files/2016/07/Glidepath-2.pdf but the first page is not readable on my browser) suggests that a downward glide path may have been better.
It is also noteworthy that Estrada comes to the following conclusion:The financial world is becoming increasingly complex, often for all the wrong reasons; and yet simple strategies, however underrated, are sometimes hard to beat. This certainly applies to the many and varied recommendations that retirees have received from financial planners over the years. And yet a simple, static all‐equity portfolio or a 60‐40 stock‐bond allocation are not only easy for retirees to implement but also supported by the comprehensive evidence discussed here.
1 -
Yes, more complicated than just holding a global equity fund (to be fair, we hold global equity and a small portion of global small cap).Pat38493 said:
Yes this is indeed an interesting point.OldScientist said:Pat38493 said:This is a graph produced by a historic stress testing tool, using a £1m portfolio in an uncrystallised pension.. Withdrawals are £40K per year net after tax, increasing with historic inflation.
Retiring at age 60.
864 scenarios were modelled starting in 1915 using historic market data.
No state pension assumed.
100% Equities in this case but you can simulate various allocations. 0.3% charges.
According to this software, there is a 99% chance of reaching age 98, and in no case would you run out of money before age 89. 98 was chosen as it's the date when there is less than 10% probability of being alive.
So according to this tool, the 4% rule actually works in 99% of the time for UK retirees if you use 100% equity allocation! In fact it's even more than 4% since I input £40K net spend and there was £6K of tax in year 1, giving 4.6% withdrawal rate. This seems to go against other research findings but there you go.
The software uses UFPLS withdrawals to model the tax payable throughout the plan.
If you add in a full new state pension from age 67, the success rate unsurprisingly goes to 100%.
Red line is the worst case scenario which was 1915. 1969 also failed but you ran out of money at age 94. 2000-2008 is not included as there are not enough years after that for the model to work.
She shaded bands are the likely (30 to 70 percentile), less likely, and rare scenarios.
The bigger thing to note around SWR, is that even in the less likely lower scenario band, you ended up with more money than you started - if using this approach you will highly likely be able to increase your spend over time.
Also interesting to note - reducing the equity allocation below 100% gives worse results, but any equity allocation 50% or more gave 95%+ success rates and 100% to age 81.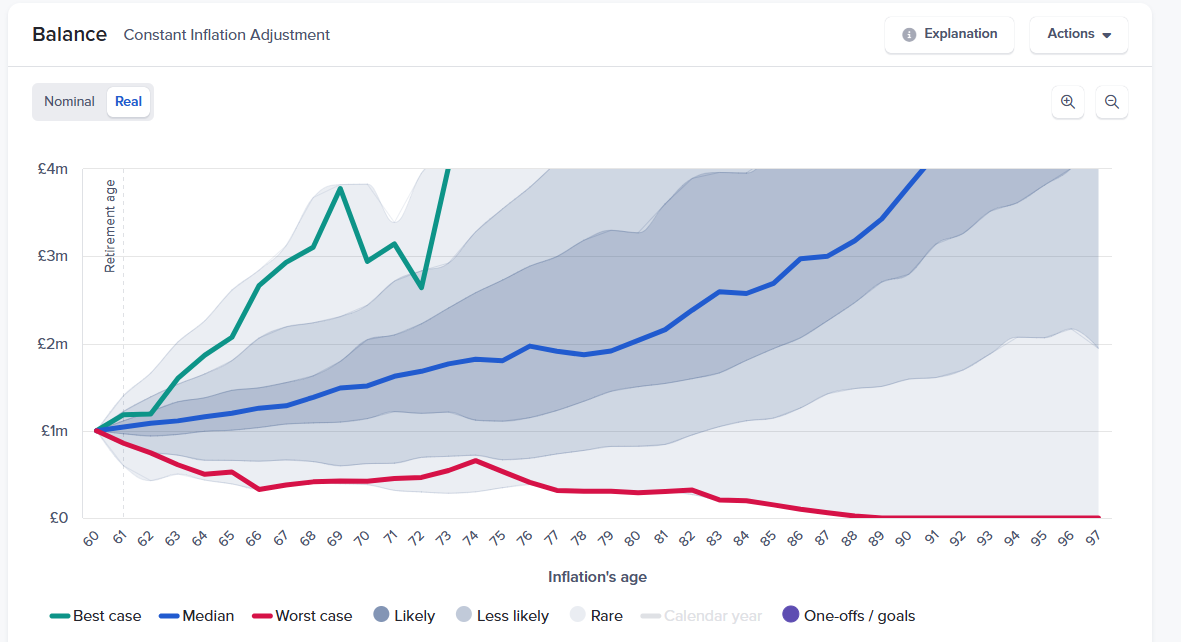
An interesting graph (if it unfortunate that the software you are using is no longer available to new retail clients). That 100% stocks for UK retirees improved SWR is fairly well known (e.g., see https://blog.iese.edu/jestrada/files/2018/03/MaxWR.pdf ), but the removal of data before 1915 does skew the results (I'm not sure why 1915 was chosen, except that for the UK it was the first year in which dated gilts, as opposed to consols, were issued in significant numbers).
For example, the SWR as a function of start year is plotted in the following graph (50% UK stocks, 50% US stocks and a 38 year retirement period to match 60 to 97 in your graph). The vertical and horizontal dashed lines indicate 1915 and 4.6%, respectively.
Using this data set shows that there was a decade of poor results (below 4.6%) in the run up to 1915 (which are ignore in your graph) together with 1969 (which you did find in your results) and 1972-1973 (the latter caused by the high proportion of UK stocks I've used and the UK crash in the early 1970s - the UK stocks market was 10% of the global market in 1987 - not sure about the 1970s, but Figure 4 in https://doi.org/10.1016/j.jfineco.2021.09.008 suggest around 10% or so).
It would be interesting to know exactly what the portfolio of 100% stocks was in your model (e.g., global cap weighted or some other combination).
I was using a sample 100% portfolio that's included with the model. Behind the scenes it translates this into percentages of a number of preset categories - see the 2 screenshots below.
If I changed the allocation to 100% global equities to represent the global passive tracker fund that many DIY retirees would use, the % success goes down 4 clicks to 95% - it's a known trick that adding value stocks and small cap stocks into the mix will eliminate some failures in SWR calculations, but I think the jury is out on whether this effect is still valid as it didn't work for about the last 30 years.
On the other hand, if you have a complicated allocation like that one below you are probably using an IFA - therefore if I increased the charges from 0.3% to 1%, the results are pretty much the same again - 95% success.
To me for my retirement plan, I am just as interested when the earliest failure is coming, as the overall % - 99% success, but with all the faiures after only 7 years is still much riskier than 99% with only failing at 95 years old. In my case, from the time we are both 67, 90%+ of our forecasted needs are covered by DB/SP sources. However the test below is just a simple test of the 4% rule not related to my own plan.

It would appear by far the largest effect on the outcomes is the removal of the pre-1915 data. My understanding (possibly wrong) is that the tool you're using uses the Dimson et al. data set that goes back to 1900 for many/some stock markets - but it may be that some of the asset classes do not go so far back and hence the 1915 cutoff. Clearly, the real holdings have only existed for a few decades at most.
Broadly speaking, the results are similar enough given uncertainties as to how well historical results will map to the future (IMV, they are a good guide, but not a good predictor).
0 -
Your graph above goes back to 1870 and it looks like if you went back that far, it would work again?OldScientist said:
Yes, more complicated than just holding a global equity fund (to be fair, we hold global equity and a small portion of global small cap).Pat38493 said:
Yes this is indeed an interesting point.OldScientist said:Pat38493 said:This is a graph produced by a historic stress testing tool, using a £1m portfolio in an uncrystallised pension.. Withdrawals are £40K per year net after tax, increasing with historic inflation.
Retiring at age 60.
864 scenarios were modelled starting in 1915 using historic market data.
No state pension assumed.
100% Equities in this case but you can simulate various allocations. 0.3% charges.
According to this software, there is a 99% chance of reaching age 98, and in no case would you run out of money before age 89. 98 was chosen as it's the date when there is less than 10% probability of being alive.
So according to this tool, the 4% rule actually works in 99% of the time for UK retirees if you use 100% equity allocation! In fact it's even more than 4% since I input £40K net spend and there was £6K of tax in year 1, giving 4.6% withdrawal rate. This seems to go against other research findings but there you go.
The software uses UFPLS withdrawals to model the tax payable throughout the plan.
If you add in a full new state pension from age 67, the success rate unsurprisingly goes to 100%.
Red line is the worst case scenario which was 1915. 1969 also failed but you ran out of money at age 94. 2000-2008 is not included as there are not enough years after that for the model to work.
She shaded bands are the likely (30 to 70 percentile), less likely, and rare scenarios.
The bigger thing to note around SWR, is that even in the less likely lower scenario band, you ended up with more money than you started - if using this approach you will highly likely be able to increase your spend over time.
Also interesting to note - reducing the equity allocation below 100% gives worse results, but any equity allocation 50% or more gave 95%+ success rates and 100% to age 81.
An interesting graph (if it unfortunate that the software you are using is no longer available to new retail clients). That 100% stocks for UK retirees improved SWR is fairly well known (e.g., see https://blog.iese.edu/jestrada/files/2018/03/MaxWR.pdf ), but the removal of data before 1915 does skew the results (I'm not sure why 1915 was chosen, except that for the UK it was the first year in which dated gilts, as opposed to consols, were issued in significant numbers).
For example, the SWR as a function of start year is plotted in the following graph (50% UK stocks, 50% US stocks and a 38 year retirement period to match 60 to 97 in your graph). The vertical and horizontal dashed lines indicate 1915 and 4.6%, respectively.
Using this data set shows that there was a decade of poor results (below 4.6%) in the run up to 1915 (which are ignore in your graph) together with 1969 (which you did find in your results) and 1972-1973 (the latter caused by the high proportion of UK stocks I've used and the UK crash in the early 1970s - the UK stocks market was 10% of the global market in 1987 - not sure about the 1970s, but Figure 4 in https://doi.org/10.1016/j.jfineco.2021.09.008 suggest around 10% or so).
It would be interesting to know exactly what the portfolio of 100% stocks was in your model (e.g., global cap weighted or some other combination).
I was using a sample 100% portfolio that's included with the model. Behind the scenes it translates this into percentages of a number of preset categories - see the 2 screenshots below.
If I changed the allocation to 100% global equities to represent the global passive tracker fund that many DIY retirees would use, the % success goes down 4 clicks to 95% - it's a known trick that adding value stocks and small cap stocks into the mix will eliminate some failures in SWR calculations, but I think the jury is out on whether this effect is still valid as it didn't work for about the last 30 years.
On the other hand, if you have a complicated allocation like that one below you are probably using an IFA - therefore if I increased the charges from 0.3% to 1%, the results are pretty much the same again - 95% success.
To me for my retirement plan, I am just as interested when the earliest failure is coming, as the overall % - 99% success, but with all the faiures after only 7 years is still much riskier than 99% with only failing at 95 years old. In my case, from the time we are both 67, 90%+ of our forecasted needs are covered by DB/SP sources. However the test below is just a simple test of the 4% rule not related to my own plan.
It would appear by far the largest effect on the outcomes is the removal of the pre-1915 data. My understanding (possibly wrong) is that the tool you're using uses the Dimson et al. data set that goes back to 1900 for many/some stock markets - but it may be that some of the asset classes do not go so far back and hence the 1915 cutoff. Clearly, the real holdings have only existed for a few decades at most.
Broadly speaking, the results are similar enough given uncertainties as to how well historical results will map to the future (IMV, they are a good guide, but not a good predictor).
There are also other nuances that come up as well - e.g. DB pensions didn't exist in 1915 as far as I'm aware. From what I can tell, this model used to hold DB and SP pensions flat if there was deflation in any year, which gave it an even higher success rate. However they changed it about a year ago to deflate guaranteed income sources when there was deflation. I guess this is debatable either way - the former approach is technically correct according to the rules of most DB pensions, but since DB pensions didn't exist back then, it's probably better to deflate them.
0 -
I think the endless debate has been going on for some time. Pages and pages of threads on here and elsewhere, books and other Internet pages.Bostonerimus1 said:
That's what I'm saying - we might have missed the inherent worry about the future within the question. Twenty years ago the 4% rule was gladly accepted and it has worked pretty well up to now, so why are people now questioning it?westv said:
Fear? I didn't notice any fear.Bostonerimus1 said:
Another tweak that can be made to retirement portfolios that models have shown improves SWR is a rising equity allocation with age after retirement. Here's a paper by Pfau.OldScientist said:
Yes, the rising percentage of portfolio will result in a smaller (but not depleted) portfolio since it extracts more income - it is less extreme than VPW, which in one form will completely deplete the portfolio at the end of the planning period. The following graphs show real portfolio value (top row) and real WR (lower row) at various percedntiles (0=worst case, 10, 25, 50=median, 75, and 99=best case) as a function of time for rising PoP (left column) and constant PoPTriumph13 said:A fascinating little analysis OldScientist. Thank you. Is the reason you have upped the variable percentage by 0.2% pa because you are aiming for portfolio depletion? I'm always nervous of such an approach in case one ends up living longer than expected. Fortunately I have inheritance as a key aim so I'm happy with a constant perecntage.
Plenty of off the shelf lifestyling funds are available Bostoneremus1 where assets are progressively moved into suitable gilt funds to try to minimise last minute volatility in the amount of annuity income that can be purchased. They have long been the standard for work DC pensions before the drawdown freedoms came in and are probably worth the marginally higher fees for most people vs trying to manage the locking in of annuity rates themselves. I do agree that, unless annuity rates crash again in another bond bubble, we definitely need to move back to annuities being the default position for the average pensioner. I fear that won't happen until we have an awful lot of people screw up their drawdown.
As expected, the amount in the portfolio was lower for the rising case and the withdrawals after 10-20 years were higher in the worst cases, but lower towards the end.
A smaller increase in the percentage (e.g., 0.1 pp per year instead of 0.2) will make the graphs closer to constant case. Again, this is, yet another, decision to be made. Personally, a rising percentage makes sense for us since we are unlikely to need income from our portfolio once our state pensions are in payment (we were aiming for a peak income after 10-15 years and then zero after that).
https://www.financialplanningassociation.org/article/journal/JAN14-reducing-retirement-risk-rising-equity-glide-path
The allocation to bond/fixed income at retirement is to reduce sequence of returns risk, but as the diminishes as you age you go to more equities for their greater potential return. This sort of approach is psychologically easier to use when you have taken pressure off your SWR by reducing fixed costs and maybe with partial annuitization...but of course an annuity is the ultimate in conservative fixed income ;-)
But we might be missing the fear behind the original question. The 4% rule is derived from historical data from stock and bond markets and in times like these is that really a sensible way to approach retirement. The world looks scary to many people and uncertainty is not conducive to long term planning and if the economy changes significantly from what it was in the past then the 4% rule will become irrelevant; for all we know it already is.0 -
I'm not sure looking at the era of the Wild West has much relevance in 2025, unless comparing the price of gold nuggets. I have learnt in life that past events cannot predict future ones, which must also apply to financial performance. If something has usually happened before it doesn't mean it will again. I guess you have to use something though....or wave your finger in the air.Pat38493 said:
Your graph above goes back to 1870 and it looks like if you went back that far, it would work again?OldScientist said:
Yes, more complicated than just holding a global equity fund (to be fair, we hold global equity and a small portion of global small cap).Pat38493 said:
Yes this is indeed an interesting point.OldScientist said:Pat38493 said:This is a graph produced by a historic stress testing tool, using a £1m portfolio in an uncrystallised pension.. Withdrawals are £40K per year net after tax, increasing with historic inflation.
Retiring at age 60.
864 scenarios were modelled starting in 1915 using historic market data.
No state pension assumed.
100% Equities in this case but you can simulate various allocations. 0.3% charges.
According to this software, there is a 99% chance of reaching age 98, and in no case would you run out of money before age 89. 98 was chosen as it's the date when there is less than 10% probability of being alive.
So according to this tool, the 4% rule actually works in 99% of the time for UK retirees if you use 100% equity allocation! In fact it's even more than 4% since I input £40K net spend and there was £6K of tax in year 1, giving 4.6% withdrawal rate. This seems to go against other research findings but there you go.
The software uses UFPLS withdrawals to model the tax payable throughout the plan.
If you add in a full new state pension from age 67, the success rate unsurprisingly goes to 100%.
Red line is the worst case scenario which was 1915. 1969 also failed but you ran out of money at age 94. 2000-2008 is not included as there are not enough years after that for the model to work.
She shaded bands are the likely (30 to 70 percentile), less likely, and rare scenarios.
The bigger thing to note around SWR, is that even in the less likely lower scenario band, you ended up with more money than you started - if using this approach you will highly likely be able to increase your spend over time.
Also interesting to note - reducing the equity allocation below 100% gives worse results, but any equity allocation 50% or more gave 95%+ success rates and 100% to age 81.
An interesting graph (if it unfortunate that the software you are using is no longer available to new retail clients). That 100% stocks for UK retirees improved SWR is fairly well known (e.g., see https://blog.iese.edu/jestrada/files/2018/03/MaxWR.pdf ), but the removal of data before 1915 does skew the results (I'm not sure why 1915 was chosen, except that for the UK it was the first year in which dated gilts, as opposed to consols, were issued in significant numbers).
For example, the SWR as a function of start year is plotted in the following graph (50% UK stocks, 50% US stocks and a 38 year retirement period to match 60 to 97 in your graph). The vertical and horizontal dashed lines indicate 1915 and 4.6%, respectively.
Using this data set shows that there was a decade of poor results (below 4.6%) in the run up to 1915 (which are ignore in your graph) together with 1969 (which you did find in your results) and 1972-1973 (the latter caused by the high proportion of UK stocks I've used and the UK crash in the early 1970s - the UK stocks market was 10% of the global market in 1987 - not sure about the 1970s, but Figure 4 in https://doi.org/10.1016/j.jfineco.2021.09.008 suggest around 10% or so).
It would be interesting to know exactly what the portfolio of 100% stocks was in your model (e.g., global cap weighted or some other combination).
I was using a sample 100% portfolio that's included with the model. Behind the scenes it translates this into percentages of a number of preset categories - see the 2 screenshots below.
If I changed the allocation to 100% global equities to represent the global passive tracker fund that many DIY retirees would use, the % success goes down 4 clicks to 95% - it's a known trick that adding value stocks and small cap stocks into the mix will eliminate some failures in SWR calculations, but I think the jury is out on whether this effect is still valid as it didn't work for about the last 30 years.
On the other hand, if you have a complicated allocation like that one below you are probably using an IFA - therefore if I increased the charges from 0.3% to 1%, the results are pretty much the same again - 95% success.
To me for my retirement plan, I am just as interested when the earliest failure is coming, as the overall % - 99% success, but with all the faiures after only 7 years is still much riskier than 99% with only failing at 95 years old. In my case, from the time we are both 67, 90%+ of our forecasted needs are covered by DB/SP sources. However the test below is just a simple test of the 4% rule not related to my own plan.
It would appear by far the largest effect on the outcomes is the removal of the pre-1915 data. My understanding (possibly wrong) is that the tool you're using uses the Dimson et al. data set that goes back to 1900 for many/some stock markets - but it may be that some of the asset classes do not go so far back and hence the 1915 cutoff. Clearly, the real holdings have only existed for a few decades at most.
Broadly speaking, the results are similar enough given uncertainties as to how well historical results will map to the future (IMV, they are a good guide, but not a good predictor).
You can read now about potential 20% dips due to Nvidia (AI crash) etc, which has similarities to 2000 but will be different....and may/may not happen in the same way. The world just changes at a rapid pace.
If you don't have a DB, or chosen not to buy an annuity, nor have oodles of cash in ISA's/the bank and your investment performance is a primary focus in life then you probably don't sleep very well.0 -
Cobbler_tone said:
I'm not sure looking at the era of the Wild West has much relevance in 2025, unless comparing the price of gold nuggets. I have learnt in life that past events cannot predict future ones, which must also apply to financial performance. If something has usually happened before it doesn't mean it will again. I guess you have to use something though....or wave your finger in the air.Pat38493 said:
Your graph above goes back to 1870 and it looks like if you went back that far, it would work again?OldScientist said:
Yes, more complicated than just holding a global equity fund (to be fair, we hold global equity and a small portion of global small cap).Pat38493 said:
Yes this is indeed an interesting point.OldScientist said:Pat38493 said:This is a graph produced by a historic stress testing tool, using a £1m portfolio in an uncrystallised pension.. Withdrawals are £40K per year net after tax, increasing with historic inflation.
Retiring at age 60.
864 scenarios were modelled starting in 1915 using historic market data.
No state pension assumed.
100% Equities in this case but you can simulate various allocations. 0.3% charges.
According to this software, there is a 99% chance of reaching age 98, and in no case would you run out of money before age 89. 98 was chosen as it's the date when there is less than 10% probability of being alive.
So according to this tool, the 4% rule actually works in 99% of the time for UK retirees if you use 100% equity allocation! In fact it's even more than 4% since I input £40K net spend and there was £6K of tax in year 1, giving 4.6% withdrawal rate. This seems to go against other research findings but there you go.
The software uses UFPLS withdrawals to model the tax payable throughout the plan.
If you add in a full new state pension from age 67, the success rate unsurprisingly goes to 100%.
Red line is the worst case scenario which was 1915. 1969 also failed but you ran out of money at age 94. 2000-2008 is not included as there are not enough years after that for the model to work.
She shaded bands are the likely (30 to 70 percentile), less likely, and rare scenarios.
The bigger thing to note around SWR, is that even in the less likely lower scenario band, you ended up with more money than you started - if using this approach you will highly likely be able to increase your spend over time.
Also interesting to note - reducing the equity allocation below 100% gives worse results, but any equity allocation 50% or more gave 95%+ success rates and 100% to age 81.
An interesting graph (if it unfortunate that the software you are using is no longer available to new retail clients). That 100% stocks for UK retirees improved SWR is fairly well known (e.g., see https://blog.iese.edu/jestrada/files/2018/03/MaxWR.pdf ), but the removal of data before 1915 does skew the results (I'm not sure why 1915 was chosen, except that for the UK it was the first year in which dated gilts, as opposed to consols, were issued in significant numbers).
For example, the SWR as a function of start year is plotted in the following graph (50% UK stocks, 50% US stocks and a 38 year retirement period to match 60 to 97 in your graph). The vertical and horizontal dashed lines indicate 1915 and 4.6%, respectively.
Using this data set shows that there was a decade of poor results (below 4.6%) in the run up to 1915 (which are ignore in your graph) together with 1969 (which you did find in your results) and 1972-1973 (the latter caused by the high proportion of UK stocks I've used and the UK crash in the early 1970s - the UK stocks market was 10% of the global market in 1987 - not sure about the 1970s, but Figure 4 in https://doi.org/10.1016/j.jfineco.2021.09.008 suggest around 10% or so).
It would be interesting to know exactly what the portfolio of 100% stocks was in your model (e.g., global cap weighted or some other combination).
I was using a sample 100% portfolio that's included with the model. Behind the scenes it translates this into percentages of a number of preset categories - see the 2 screenshots below.
If I changed the allocation to 100% global equities to represent the global passive tracker fund that many DIY retirees would use, the % success goes down 4 clicks to 95% - it's a known trick that adding value stocks and small cap stocks into the mix will eliminate some failures in SWR calculations, but I think the jury is out on whether this effect is still valid as it didn't work for about the last 30 years.
On the other hand, if you have a complicated allocation like that one below you are probably using an IFA - therefore if I increased the charges from 0.3% to 1%, the results are pretty much the same again - 95% success.
To me for my retirement plan, I am just as interested when the earliest failure is coming, as the overall % - 99% success, but with all the faiures after only 7 years is still much riskier than 99% with only failing at 95 years old. In my case, from the time we are both 67, 90%+ of our forecasted needs are covered by DB/SP sources. However the test below is just a simple test of the 4% rule not related to my own plan.
It would appear by far the largest effect on the outcomes is the removal of the pre-1915 data. My understanding (possibly wrong) is that the tool you're using uses the Dimson et al. data set that goes back to 1900 for many/some stock markets - but it may be that some of the asset classes do not go so far back and hence the 1915 cutoff. Clearly, the real holdings have only existed for a few decades at most.
Broadly speaking, the results are similar enough given uncertainties as to how well historical results will map to the future (IMV, they are a good guide, but not a good predictor).
You can read now about potential 20% dips due to Nvidia (AI crash) etc, which has similarities to 2000 but will be different....and may/may not happen in the same way. The world just changes at a rapid pace.
If you don't have a DB, or chosen not to buy an annuity, nor have oodles of cash in ISA's/the bank and your investment performance is a primary focus in life then you probably don't sleep very well.
History doesn’t repeat itself but it often rhymes - Mark Twain / Theodore Reik") 1
1 -
It is only the returns and sequence of returns that we are using, so what caused them is irrelevant. While having exactly the same sequence of returns for both equities and bonds is unlikely, some similarities may occur in the future. As I said above, history is good at providing guidance but is not good at prediction. This is why trying to pin down SWRs to an accuracy of 0.1% or failure rates to the nearest % is a futile exercise.Cobbler_tone said:
I'm not sure looking at the era of the Wild West has much relevance in 2025, unless comparing the price of gold nuggets. I have learnt in life that past events cannot predict future ones, which must also apply to financial performance. If something has usually happened before it doesn't mean it will again. I guess you have to use something though....or wave your finger in the air.Pat38493 said:
Your graph above goes back to 1870 and it looks like if you went back that far, it would work again?OldScientist said:
Yes, more complicated than just holding a global equity fund (to be fair, we hold global equity and a small portion of global small cap).Pat38493 said:
Yes this is indeed an interesting point.OldScientist said:Pat38493 said:This is a graph produced by a historic stress testing tool, using a £1m portfolio in an uncrystallised pension.. Withdrawals are £40K per year net after tax, increasing with historic inflation.
Retiring at age 60.
864 scenarios were modelled starting in 1915 using historic market data.
No state pension assumed.
100% Equities in this case but you can simulate various allocations. 0.3% charges.
According to this software, there is a 99% chance of reaching age 98, and in no case would you run out of money before age 89. 98 was chosen as it's the date when there is less than 10% probability of being alive.
So according to this tool, the 4% rule actually works in 99% of the time for UK retirees if you use 100% equity allocation! In fact it's even more than 4% since I input £40K net spend and there was £6K of tax in year 1, giving 4.6% withdrawal rate. This seems to go against other research findings but there you go.
The software uses UFPLS withdrawals to model the tax payable throughout the plan.
If you add in a full new state pension from age 67, the success rate unsurprisingly goes to 100%.
Red line is the worst case scenario which was 1915. 1969 also failed but you ran out of money at age 94. 2000-2008 is not included as there are not enough years after that for the model to work.
She shaded bands are the likely (30 to 70 percentile), less likely, and rare scenarios.
The bigger thing to note around SWR, is that even in the less likely lower scenario band, you ended up with more money than you started - if using this approach you will highly likely be able to increase your spend over time.
Also interesting to note - reducing the equity allocation below 100% gives worse results, but any equity allocation 50% or more gave 95%+ success rates and 100% to age 81.
An interesting graph (if it unfortunate that the software you are using is no longer available to new retail clients). That 100% stocks for UK retirees improved SWR is fairly well known (e.g., see https://blog.iese.edu/jestrada/files/2018/03/MaxWR.pdf ), but the removal of data before 1915 does skew the results (I'm not sure why 1915 was chosen, except that for the UK it was the first year in which dated gilts, as opposed to consols, were issued in significant numbers).
For example, the SWR as a function of start year is plotted in the following graph (50% UK stocks, 50% US stocks and a 38 year retirement period to match 60 to 97 in your graph). The vertical and horizontal dashed lines indicate 1915 and 4.6%, respectively.
Using this data set shows that there was a decade of poor results (below 4.6%) in the run up to 1915 (which are ignore in your graph) together with 1969 (which you did find in your results) and 1972-1973 (the latter caused by the high proportion of UK stocks I've used and the UK crash in the early 1970s - the UK stocks market was 10% of the global market in 1987 - not sure about the 1970s, but Figure 4 in https://doi.org/10.1016/j.jfineco.2021.09.008 suggest around 10% or so).
It would be interesting to know exactly what the portfolio of 100% stocks was in your model (e.g., global cap weighted or some other combination).
I was using a sample 100% portfolio that's included with the model. Behind the scenes it translates this into percentages of a number of preset categories - see the 2 screenshots below.
If I changed the allocation to 100% global equities to represent the global passive tracker fund that many DIY retirees would use, the % success goes down 4 clicks to 95% - it's a known trick that adding value stocks and small cap stocks into the mix will eliminate some failures in SWR calculations, but I think the jury is out on whether this effect is still valid as it didn't work for about the last 30 years.
On the other hand, if you have a complicated allocation like that one below you are probably using an IFA - therefore if I increased the charges from 0.3% to 1%, the results are pretty much the same again - 95% success.
To me for my retirement plan, I am just as interested when the earliest failure is coming, as the overall % - 99% success, but with all the faiures after only 7 years is still much riskier than 99% with only failing at 95 years old. In my case, from the time we are both 67, 90%+ of our forecasted needs are covered by DB/SP sources. However the test below is just a simple test of the 4% rule not related to my own plan.
It would appear by far the largest effect on the outcomes is the removal of the pre-1915 data. My understanding (possibly wrong) is that the tool you're using uses the Dimson et al. data set that goes back to 1900 for many/some stock markets - but it may be that some of the asset classes do not go so far back and hence the 1915 cutoff. Clearly, the real holdings have only existed for a few decades at most.
Broadly speaking, the results are similar enough given uncertainties as to how well historical results will map to the future (IMV, they are a good guide, but not a good predictor).
You can read now about potential 20% dips due to Nvidia (AI crash) etc, which has similarities to 2000 but will be different....and may/may not happen in the same way. The world just changes at a rapid pace.
If you don't have a DB, or chosen not to buy an annuity, nor have oodles of cash in ISA's/the bank and your investment performance is a primary focus in life then you probably don't sleep very well.
I agree with much of your last sentence. If you want at least some certainty in retirement income then exposure to the market (either equities or bond funds) will not provide it. Guaranteed income (whether SP, DB, RPI annuity, or inflation linked gilt ladder) will minimise market and inflation risks and provide more certainty.
0 -
In the "problem of induction" David Hume pointed out the problems with using what you know about the past to predict the future. In the physical sciences you can philosophize through this problem by assuming that physical laws are time invariant, but those arguments don't work well in economics. This is why I decided to use rent, DB pensions, SPs and an annuity for my retirement income. So I suppose I gave up on the "4% rule" a while ago.OldScientist said:
It is only the returns and sequence of returns that we are using, so what caused them is irrelevant. While having exactly the same sequence of returns for both equities and bonds is unlikely, some similarities may occur in the future. As I said above, history is good at providing guidance but is not good at prediction. This is why trying to pin down SWRs to an accuracy of 0.1% or failure rates to the nearest % is a futile exercise.Cobbler_tone said:
I'm not sure looking at the era of the Wild West has much relevance in 2025, unless comparing the price of gold nuggets. I have learnt in life that past events cannot predict future ones, which must also apply to financial performance. If something has usually happened before it doesn't mean it will again. I guess you have to use something though....or wave your finger in the air.Pat38493 said:
Your graph above goes back to 1870 and it looks like if you went back that far, it would work again?OldScientist said:
Yes, more complicated than just holding a global equity fund (to be fair, we hold global equity and a small portion of global small cap).Pat38493 said:
Yes this is indeed an interesting point.OldScientist said:Pat38493 said:This is a graph produced by a historic stress testing tool, using a £1m portfolio in an uncrystallised pension.. Withdrawals are £40K per year net after tax, increasing with historic inflation.
Retiring at age 60.
864 scenarios were modelled starting in 1915 using historic market data.
No state pension assumed.
100% Equities in this case but you can simulate various allocations. 0.3% charges.
According to this software, there is a 99% chance of reaching age 98, and in no case would you run out of money before age 89. 98 was chosen as it's the date when there is less than 10% probability of being alive.
So according to this tool, the 4% rule actually works in 99% of the time for UK retirees if you use 100% equity allocation! In fact it's even more than 4% since I input £40K net spend and there was £6K of tax in year 1, giving 4.6% withdrawal rate. This seems to go against other research findings but there you go.
The software uses UFPLS withdrawals to model the tax payable throughout the plan.
If you add in a full new state pension from age 67, the success rate unsurprisingly goes to 100%.
Red line is the worst case scenario which was 1915. 1969 also failed but you ran out of money at age 94. 2000-2008 is not included as there are not enough years after that for the model to work.
She shaded bands are the likely (30 to 70 percentile), less likely, and rare scenarios.
The bigger thing to note around SWR, is that even in the less likely lower scenario band, you ended up with more money than you started - if using this approach you will highly likely be able to increase your spend over time.
Also interesting to note - reducing the equity allocation below 100% gives worse results, but any equity allocation 50% or more gave 95%+ success rates and 100% to age 81.
An interesting graph (if it unfortunate that the software you are using is no longer available to new retail clients). That 100% stocks for UK retirees improved SWR is fairly well known (e.g., see https://blog.iese.edu/jestrada/files/2018/03/MaxWR.pdf ), but the removal of data before 1915 does skew the results (I'm not sure why 1915 was chosen, except that for the UK it was the first year in which dated gilts, as opposed to consols, were issued in significant numbers).
For example, the SWR as a function of start year is plotted in the following graph (50% UK stocks, 50% US stocks and a 38 year retirement period to match 60 to 97 in your graph). The vertical and horizontal dashed lines indicate 1915 and 4.6%, respectively.
Using this data set shows that there was a decade of poor results (below 4.6%) in the run up to 1915 (which are ignore in your graph) together with 1969 (which you did find in your results) and 1972-1973 (the latter caused by the high proportion of UK stocks I've used and the UK crash in the early 1970s - the UK stocks market was 10% of the global market in 1987 - not sure about the 1970s, but Figure 4 in https://doi.org/10.1016/j.jfineco.2021.09.008 suggest around 10% or so).
It would be interesting to know exactly what the portfolio of 100% stocks was in your model (e.g., global cap weighted or some other combination).
I was using a sample 100% portfolio that's included with the model. Behind the scenes it translates this into percentages of a number of preset categories - see the 2 screenshots below.
If I changed the allocation to 100% global equities to represent the global passive tracker fund that many DIY retirees would use, the % success goes down 4 clicks to 95% - it's a known trick that adding value stocks and small cap stocks into the mix will eliminate some failures in SWR calculations, but I think the jury is out on whether this effect is still valid as it didn't work for about the last 30 years.
On the other hand, if you have a complicated allocation like that one below you are probably using an IFA - therefore if I increased the charges from 0.3% to 1%, the results are pretty much the same again - 95% success.
To me for my retirement plan, I am just as interested when the earliest failure is coming, as the overall % - 99% success, but with all the faiures after only 7 years is still much riskier than 99% with only failing at 95 years old. In my case, from the time we are both 67, 90%+ of our forecasted needs are covered by DB/SP sources. However the test below is just a simple test of the 4% rule not related to my own plan.
It would appear by far the largest effect on the outcomes is the removal of the pre-1915 data. My understanding (possibly wrong) is that the tool you're using uses the Dimson et al. data set that goes back to 1900 for many/some stock markets - but it may be that some of the asset classes do not go so far back and hence the 1915 cutoff. Clearly, the real holdings have only existed for a few decades at most.
Broadly speaking, the results are similar enough given uncertainties as to how well historical results will map to the future (IMV, they are a good guide, but not a good predictor).
You can read now about potential 20% dips due to Nvidia (AI crash) etc, which has similarities to 2000 but will be different....and may/may not happen in the same way. The world just changes at a rapid pace.
If you don't have a DB, or chosen not to buy an annuity, nor have oodles of cash in ISA's/the bank and your investment performance is a primary focus in life then you probably don't sleep very well.
I agree with much of your last sentence. If you want at least some certainty in retirement income then exposure to the market (either equities or bond funds) will not provide it. Guaranteed income (whether SP, DB, RPI annuity, or inflation linked gilt ladder) will minimise market and inflation risks and provide more certainty.And so we beat on, boats against the current, borne back ceaselessly into the past.1 -
But another wise man said "Those who do not study history are doomed to repeat it".
Even if the future behaves exactly like the past (not sure how we measure that anyway), the 4% rule is still not guaranteed to work as there could be sequences of inflation, equity and bond returns which break it. You have to start somewhere, and I think a 3% rule is a good way to estimate a floor under your income given your starting pot. There is nobody I would trust to predict future economics more than a historian. Maybe Michael Saylor is right and we should all buy levered bitcoin. Or Jack bogle, who died 6 years ago is wiser with sensible drawdown from a 60:40 portfolio.
In the end, having a large portfolio is the most likely measure of success. If you have more than you need, and you draw any kind of reasonable income, you are likely to be fine. If your portfolio is barely sufficient to meet your needs then it is down to luck as much as skilled management whether you end up comfortable or destitute.1


Confirm your email address to Create Threads and Reply

Categories
- All Categories
- 354.2K Banking & Borrowing
- 254.3K Reduce Debt & Boost Income
- 455.3K Spending & Discounts
- 247.2K Work, Benefits & Business
- 603.8K Mortgages, Homes & Bills
- 178.4K Life & Family
- 261.3K Travel & Transport
- 1.5M Hobbies & Leisure
- 16.1K Discuss & Feedback
- 37.7K Read-Only Boards