We’d like to remind Forumites to please avoid political debate on the Forum.
This is to keep it a safe and useful space for MoneySaving discussions. Threads that are – or become – political in nature may be removed in line with the Forum’s rules. Thank you for your understanding.
📨 Have you signed up to the Forum's new Email Digest yet? Get a selection of trending threads sent straight to your inbox daily, weekly or monthly!
House/home insurance inflation.
Jakethedawg
Posts: 1 Newbie


Hi Folks,
I've been tracking my domestic building/contents insurance renewal inflation since 2020, shopping around each year to try to get the best price. The cheapest cover has always come from the same broker (sometimes loyalty does pay?) but price inflation has been as follows:
20/21 0.00%
21/22 -13.40%
22/23 +13.76%
23/24 +272.43% (no, not a typo!)
24/25 +41.45%.
I have tried to find out why, but apart from a re-drawing of the local flood map (I thought Flood Re was supposed to negate this) nothing else has changed.
So, 3 questions.
1. Has anyone else experienced or heard of similar (is it common)?
2. Why such extreme inflation?
3. If flood risk is the issue, how might I opt out of flood cover and get back to sensible prices (area might be a flood risk (doubtful) but my property definitely is not).
All guesses welcome!
Thanks.
0
Comments
-
Flood Re is simply a reinsurance policy, an insurer can choose to buy it or not. Similar to other common pool arrangements like Pool Re or TRIA (both terrorism reinsurance) the rates are effectively set by the government on a not for profit basis but cannot be commercially negotiated. Some insurers buy into it, some buy commercially available reinsurance and some will retain the risk.

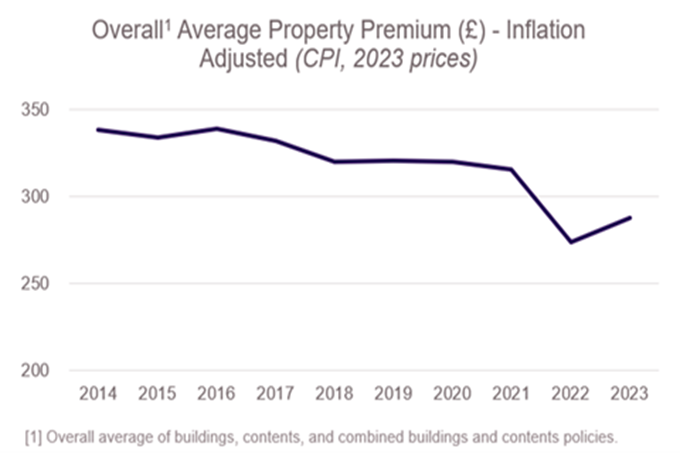
The above is a chart from the ABI of average home insurance prices if you remove the impact of general inflation. The ABI haven't published an updated version of the chart since 2023 however Which have a non-inflation adjusted one which shows a c33% increase from mid 2022 to end 2024
2. Weather, insurers paid out £5.7bn in 2024 which is the highest number on record and 28% higher than 2023. Storm was the main problem with 12 named storms in 15 months, worst for over 7 years.
You ideally wouldn't be tracking just your best price but that plus the average of say the next 4 insurers, this gives a broader picture of what's happening for you and removes the influence of what may be happening just to your insurer. Certainly the 23/24 looks like a price correction as whilst the general market saw increases it was nothing to that extent.
3. Getting non-standard cover moves you out of the mass market space which operates with fairly fine margins and in a highly automated way into the niche coverage area which has much less competitive pressures to keep premiums low. Niche can also mean dealing with humans not machines and people demand salaries, support staff etc and you arent paying for the 20 minutes they spend doing your quote but the other 9 quotes they have to do to get 1 sale too. A former client can write almost anything, in their London Market division, they cover satellites in space, national art collections and Jennifer Lopez's butt however they will never quote below £10,000 as to do so just isnt worth their time. Their former Chairman used to introduce himself as a high stakes gambler after seeing reporters glaze over when he said he worked in insurance.1
Confirm your email address to Create Threads and Reply

Categories
- All Categories
- 352.3K Banking & Borrowing
- 253.6K Reduce Debt & Boost Income
- 454.3K Spending & Discounts
- 245.3K Work, Benefits & Business
- 601K Mortgages, Homes & Bills
- 177.5K Life & Family
- 259.1K Travel & Transport
- 1.5M Hobbies & Leisure
- 16K Discuss & Feedback
- 37.7K Read-Only Boards
