We’d like to remind Forumites to please avoid political debate on the Forum.
This is to keep it a safe and useful space for MoneySaving discussions. Threads that are – or become – political in nature may be removed in line with the Forum’s rules. Thank you for your understanding.
📨 Have you signed up to the Forum's new Email Digest yet? Get a selection of trending threads sent straight to your inbox daily, weekly or monthly!
The Forum now has a brand new text editor, adding a bunch of handy features to use when creating posts. Read more in our how-to guide
Compound Interest
Comments
-
An "average" return of an investment over several years is a slippery concept; you might say "it's the best I can guess at", but what you're really calculating is a theoretical steady return.Ivkoto said:
The OP question was very simple, but some of you are trying to make it looks very complicated.
He asked, if the AVERAGE return over 20 years is 5%, what would be the final result. He didn't asked what would have happened if at year 21 the fund lost 50% or whatever.
Consider investing yearly in 2 pharma companies over 20 years, both starting at £10 per share. A plc finds its wonder drug in the first year, its share price doubles by year 2, and then stays steady for the next 19. But B plc finds its wonder drug in year 20, after 19 years of the share price staying at £10. Neither pays dividends.
Both companies end up with a share price of £20, twice the start. Do they have the same "average return"? Well, if you invested from years 2 through 19 in A plc, you'd have been buying half the number of shares each year than if you were buying B plc. But the end price is the same, so an investor in B plc has done much better.
So how would you work out an "average return"? By putting such precise figures on it, it makes it look as if you've got an answer. But you haven't; you've assumed a constant return.
What we can say is "stocks tend to increase, so if you accumulate the dividends, meaning they are invested rather than removing them (and then just letting the cash sit in a current account without touching it), you'll likely get more money". Putting precise figures on them is taking one specific scenario, and claiming it's "average".
And I'd add I've now watched the whole of the YouTube video, and the guy doesn't once point out the difference between income (or "distributing") and accumulating funds. Which means he's not telling you how to invest to get the long term growth. And that's the problem with the video - he keeps on saying "interest", but he's talking about the growth in the S&P 500 (and, by implication, the long term dollar to pound exchange rate). And that's how the OP ended up worrying about "interest" from HL, when that's entirely irrelevant. The guy in the video was not (in 2021, anyway) someone to take investment advice from. (He also doesn't point out that the assumption of 2% inflation means his final figures of a £2.5 million pot should be looked at in today's money terms - at 2% inflation, you should divide the final figure by about 2.3 (1.02^42) to get its worth today.)0 -
The OP is talking about a world index tracker, invested regularly over 20 years, not individual stocks or buying in Y2 and selling in Y19. Your example is not useful.
It's ordinary to reflect on investments in terms of annual value change. If you average it out then you can apply the idea of compounding to it. It's not as predictable, it is not only up, and in some ways it's more useful as a "look back" rather than a prediction. Compounding (+ taking into account cost averaging) absolutely applies to passing investing.
1 -
EthicsGradient said:
An "average" return of an investment over several years is a slippery concept; you might say "it's the best I can guess at", but what you're really calculating is a theoretical steady return.Ivkoto said:
The OP question was very simple, but some of you are trying to make it looks very complicated.
He asked, if the AVERAGE return over 20 years is 5%, what would be the final result. He didn't asked what would have happened if at year 21 the fund lost 50% or whatever.
Consider investing yearly in 2 pharma companies over 20 years, both starting at £10 per share. A plc finds its wonder drug in the first year, its share price doubles by year 2, and then stays steady for the next 19. But B plc finds its wonder drug in year 20, after 19 years of the share price staying at £10. Neither pays dividends.
Both companies end up with a share price of £20, twice the start. Do they have the same "average return"? Well, if you invested from years 2 through 19 in A plc, you'd have been buying half the number of shares each year than if you were buying B plc. But the end price is the same, so an investor in B plc has done much better.
So how would you work out an "average return"? By putting such precise figures on it, it makes it look as if you've got an answer. But you haven't; you've assumed a constant return.
What we can say is "stocks tend to increase, so if you accumulate the dividends, meaning they are invested rather than removing them (and then just letting the cash sit in a current account without touching it), you'll likely get more money". Putting precise figures on them is taking one specific scenario, and claiming it's "average".
Well, we are talking, if at the end of the 20th year, the fund achieved 5% average return during the period, what would be the outcome.
If the final total-weighted return is 171.26%
( regardless at what price you buying the fund during the years ), the result is the same ( see below )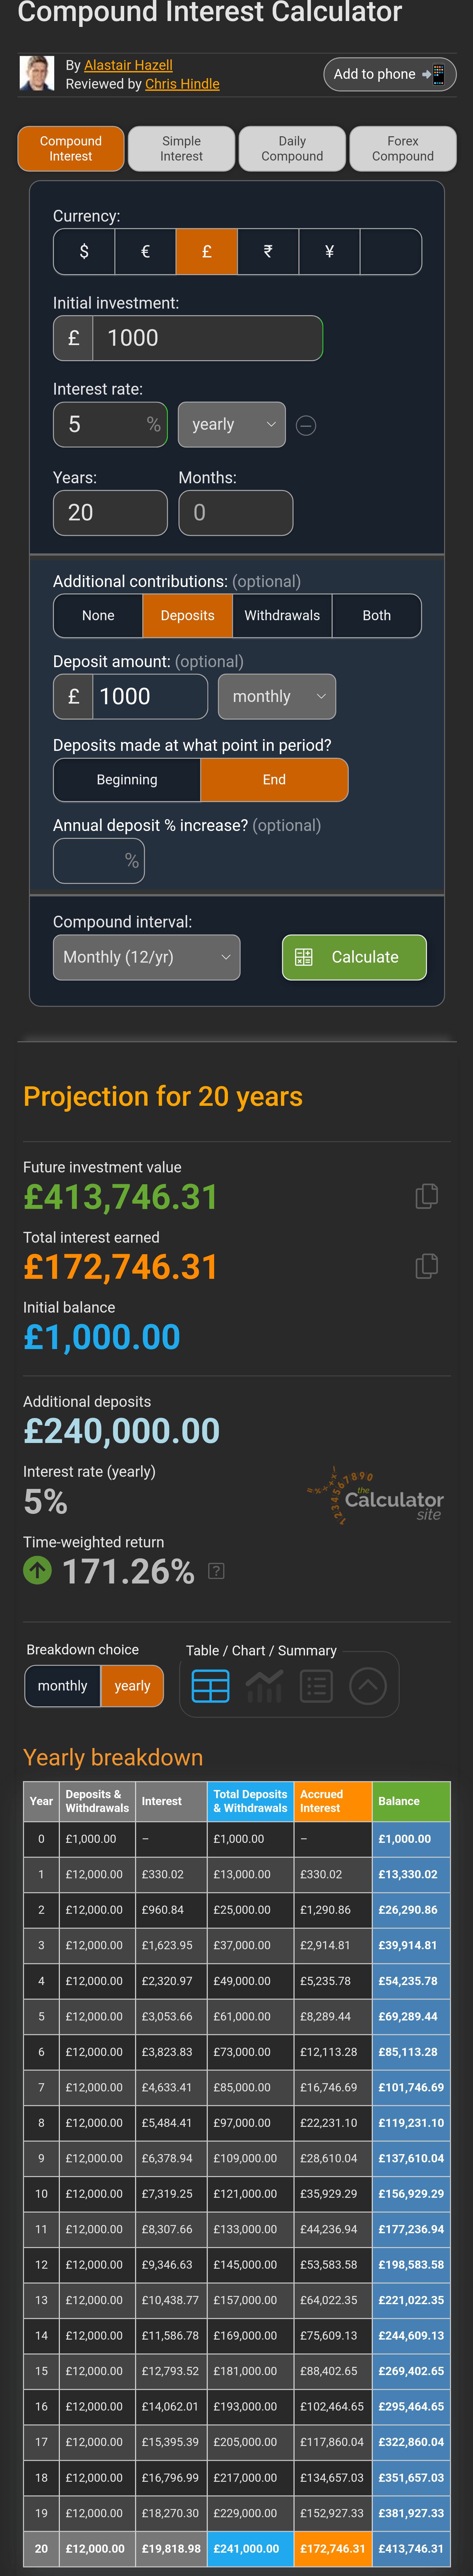
0 -
"Well, we are talking, if at the end of the 20th year, the fund achieved 5% average return during the period, what would be the outcome.
If the final total-weighted return is 171.26%
( regardless at what price you buying the fund during the years ), the result is the same ( see below )"
I think you're proving my point - you still think there is an "average return", and that the final return doesn't depend on the price you buy during the years. It does depend on the price you buy at, each time.0 -
EthicsGradient said:"Well, we are talking, if at the end of the 20th year, the fund achieved 5% average return during the period, what would be the outcome.
If the final total-weighted return is 171.26%
( regardless at what price you buying the fund during the years ), the result is the same ( see below )"
I think you're proving my point - you still think there is an "average return", and that the final return doesn't depend on the price you buy during the years. It does depend on the price you buy at, each time.
Of course it depends on price you buying at, but we have assumption of 5% average return at the end of the 20th year.0 -
For a 20 year period, taking an annualised real return in the range 0% to 5% is probably good enough as a guide given that no-one has any idea of what the actual returns will be over the next 20 years.
If you want to do it more 'precisely' then you can either
a) use historic return data (with an implict assumption that the future won't look too different to the past) or
b) implement a Monte Carlo approach making assumptions about mean returns and standard deviations (which can be derived from historic data and, indirectly, makes an implicit assumption about the future).
As an example using approach a), a 100% equity portfolio (I've used historic returns for UK equities since I have the data to hand from macrohistory.net) and assumed that an inflation adjusted £12k per year is invested (i.e., if £12k was invested in the first year and inflation was then 10%, £13.2k nominal would be invested in the second year, etc.)
The graph below shows the final amount (after 20 years) in real £k. as a function of start year for the 20-year rolling periods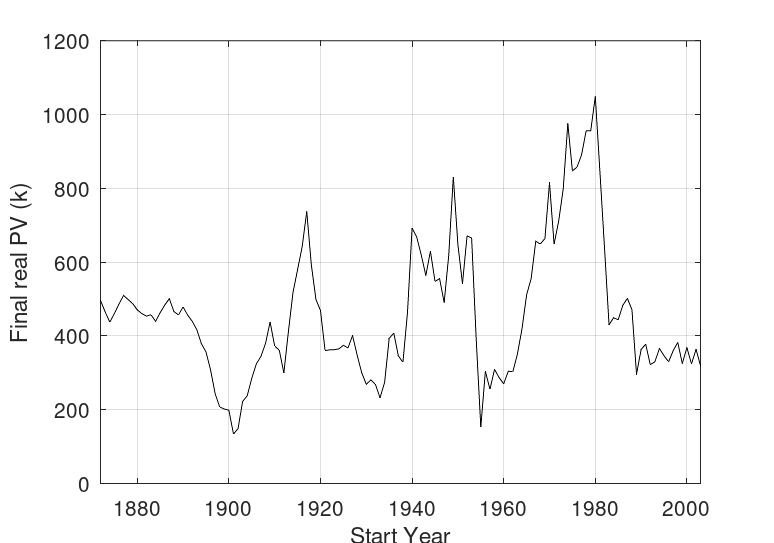
There are two, relatively short, periods where the outcomes are poor, one starting in 1902 which was affected, amongst other things, by high inflation towards the end of WWI, and the other in 1955 (which ended during the UK stock market crash of 1974-1975). At the other end of the spectrum, the period starting in 1980 was a very good one with a final amount (£1m) nearly 10 times that of the worst cases.
For those who prefer the statistics, the outcomes ranged from £130k (0th percentile), £270k (10th percentile), £330k (25th percentile), and £440k (median, i.e., 50th percentile). Remember these are real (i.e., inflation adjusted) values referenced to the beginning of the investing period.
A few observations:
1) The 10th percentile value is similar to that assuming a constant annualised real return of 0%
2) The 50th percentile value is similar to that assuming a constant annualised real return of 5%.
In other words, as I said at the beginning of this post, taking a constant annualised return is a good enough approximation provided one doesn't get fixated upon a single return. So using a range from, say 0% real (even -1% might be worth doing, although the moneysavingexpert calculator I linked to earlier does not allow this) to 5% real captures most of the outcomes below the median. If things turn out better than the median, it is likely that the OP will be very happy indeed!
But these are projections - the actual value is unknown and unknowable in advance, so the effect on the outcome of the precise detail of the calculations is dwarfed by known unknowns (e.g., stock market volatility) let alone unknown unknowns (with apologies to Donald Rumsfeld).
I shall leave implementing and obtaining results from a Monte Carlo approach as an exercise for the reader (although I note that there may be online or spreadsheet versions already out there)!
3 -
Compound dividends maybe!?0
-
Hello, regarding compounding, I understand it is a lot more complex than with compounding in savings with interest. Does anyone know why then do people on the internet and Netflix like Ramit Sethi who are self proclaimed financial 'gurus' go on and on about starting investing as early as you can because of compounding? He said you can hopefully expect 7% returns over the long term. He must be a little bit right surely otherwise Netflix wouldn't let him say it??? Or am I being naive.0
-
It's simply being couched in layperson language so that it can be easily conceptualised. Most investing does not provide linear returns. But for the most part there are returns in the long run (reflected in capital and/or distribution). If the capital returns and/or distributed returns are reinvested, they will also generate returns in addition to the original investment. Those returns compounding over multiple years and cycles is where the 7% estimate comes from (based on historical averages).
3 -

The blue line is a return over time of a investment, the green line is a compound interest return.
When they talk about the returns compounding, they mean looking back between two points, then the return would have been equivalent to a compound interest of x% (the green line), however what happened between those two points (the blue line) is in no way as smooth and even as the green line. Describing compounding for investments is always looking backwards like this, nobody can guarantee that this return will remain the same in the future.3


Confirm your email address to Create Threads and Reply

Categories
- All Categories
- 354.7K Banking & Borrowing
- 254.5K Reduce Debt & Boost Income
- 455.6K Spending & Discounts
- 247.6K Work, Benefits & Business
- 604.5K Mortgages, Homes & Bills
- 178.6K Life & Family
- 262.1K Travel & Transport
- 1.5M Hobbies & Leisure
- 16.1K Discuss & Feedback
- 37.7K Read-Only Boards