We’d like to remind Forumites to please avoid political debate on the Forum.
This is to keep it a safe and useful space for MoneySaving discussions. Threads that are – or become – political in nature may be removed in line with the Forum’s rules. Thank you for your understanding.
📨 Have you signed up to the Forum's new Email Digest yet? Get a selection of trending threads sent straight to your inbox daily, weekly or monthly!
The Forum now has a brand new text editor, adding a bunch of handy features to use when creating posts. Read more in our how-to guide
Gas Prices
Comments
-
I pay 0.1243020 (£/kWh). Daily standing charge 0.16353
Last year it was 0.017350. Standing charge 0.15816
0 -
The Ofgem cap average from start of July is around 7.5p/kWh - and the standing charge 29.11p for DD payment method - both figures including vat.So your local block supply is currently 5p/kWh higher - but that offset a tiny amount by the 13.3p saving in standing charges.But comparing to the Ofgem cap - whilst obviously frustrating - is essentially pointless - it simply doesn't apply to your situation.Thats the problem with being on a communal heating supply. Not unique to care homes - many blocks of flats have them - old and new - private and social landlords.As to market pricing trends - thenThe good news - is your rate has fallen 5p/kWh Edit following correction below - unless you really were paying 1.7p and not 17p I coreecred to assuming thatvwas a typo - per unit last year - which seems really cheap(posts a few months back had people getting their revised annual prices - which relected last years higher average rates - and so their prices where going up - some iirc near trebling)Because of the way the EPG worked - what people on that system paid only fell 2.8p (from c10.3 to c7.5p - 10.3p had iirc a 2.2p ex vat discount from Apr to Jun - so the total drop from Ofgem cap - based on 3m averaging - roughly the same 5p).But in Jan to Mar that EPG discount was 6.4p so in reality the Ofgem cap was 17p - not disimilar to your old 17.3p rate.I am not sure any of the schemes really offer you any help - does anyone know if OP can claim AFP £200 - he has gas - but not directly from a normal supplier - so no domestic supply EPG savings I guess.
0 -
Nope, that closed ages ago even if it did apply (it doesn't).Scot_39 said:I am not sure any of the schemes really offer you any help - does anyone know if OP can claim AFP £200 - he has gas - but not directly from a normal supplier - so no domestic supply EPG savings I guess.
I don't know of any others and they probably would have already closed now anyway.1 -
I pay 0.1243020 (£/kWh) per unit
0.16353 (£/kWh) standing charge0 -
Wind stopped blowing, simple.SAC2334 said:
4.03 p kwh for me today in Yorkshire area. That is the dearest its been for a couple of weeks .armistice said:Today 3.78p octopus tracker.Barnsley, South Yorkshire
Solar PV 5.25kWp SW facing (14 x 375) installed Mar 22
Lux 3.6kw hybrid inverter and 9.6kw Pylontech batteries
Daikin 8kW ASHP installed Jan 25
Octopus Cosy/Fixed Outgoing1 -
Just wait till it - a still wind period - happens mid winter - and it does.But I suspect it would have to stop for a long time - to offset the savings over summer months - but lets see what happens in winter (and how close Octopus's "likely double" tracker FAQ comment actually is to actual pricing).Both big wholesale electric prices in last year - associated with a higher gas mix - due to low wind.Bit I do wonder if a spell likelast Aug (UK hit a record day ahead price for electricity - around £530 - cannot remember the exact figure - and a week aver of c£460 -that itself higher thanthe 3 week spike like last December (around £400/MWh electric at mid point)will see an exodus from likes of Agile and Tracker.Orwhether most will ride the peaks to benefit from the low rates at other times.PS Does anyone know what happened to gas market wholesale rates at those high electric points - probably a bit less volatile.Or a good site to look back historically - for both gas and electric market pricing - that you don't have to be a customer or register for etc.I tend to use grid.iamkate.com for electric - simple/quick for some here I guess - but gives weekly trends - colourful but not high res data long term.
0 -
You can see historical Agile and Tracker prices charted for the past year at on the energy-stats site, and I think you can download the underlying data. It's then relatively easy to convert those back to the raw wholesale prices.Scot_39 said:Or a good site to look back historically - for both gas and electric market pricing - that you don't have to be a customer or register for etc.
N. Hampshire, he/him. Octopus Intelligent Go elec & Tracker gas / Vodafone BB / iD mobile. Kirk Hill Co-op member.Ofgem cap table, Ofgem cap explainer. Economy 7 cap explainer. Gas vs E7 vs peak elec heating costs, Best kettle!
2.72kWp PV facing SSW installed Jan 2012. 11 x 247w panels, 3.6kw inverter. 35 MWh generated, long-term average 2.6 Os.1 -
Past performance is clearly no indication of future trends but the 365 day graph is quite revealing:QrizB said:
You can see historical Agile and Tracker prices charted for the past year at on the energy-stats site, and I think you can download the underlying data. It's then relatively easy to convert those back to the raw wholesale prices.Scot_39 said:Or a good site to look back historically - for both gas and electric market pricing - that you don't have to be a customer or register for etc.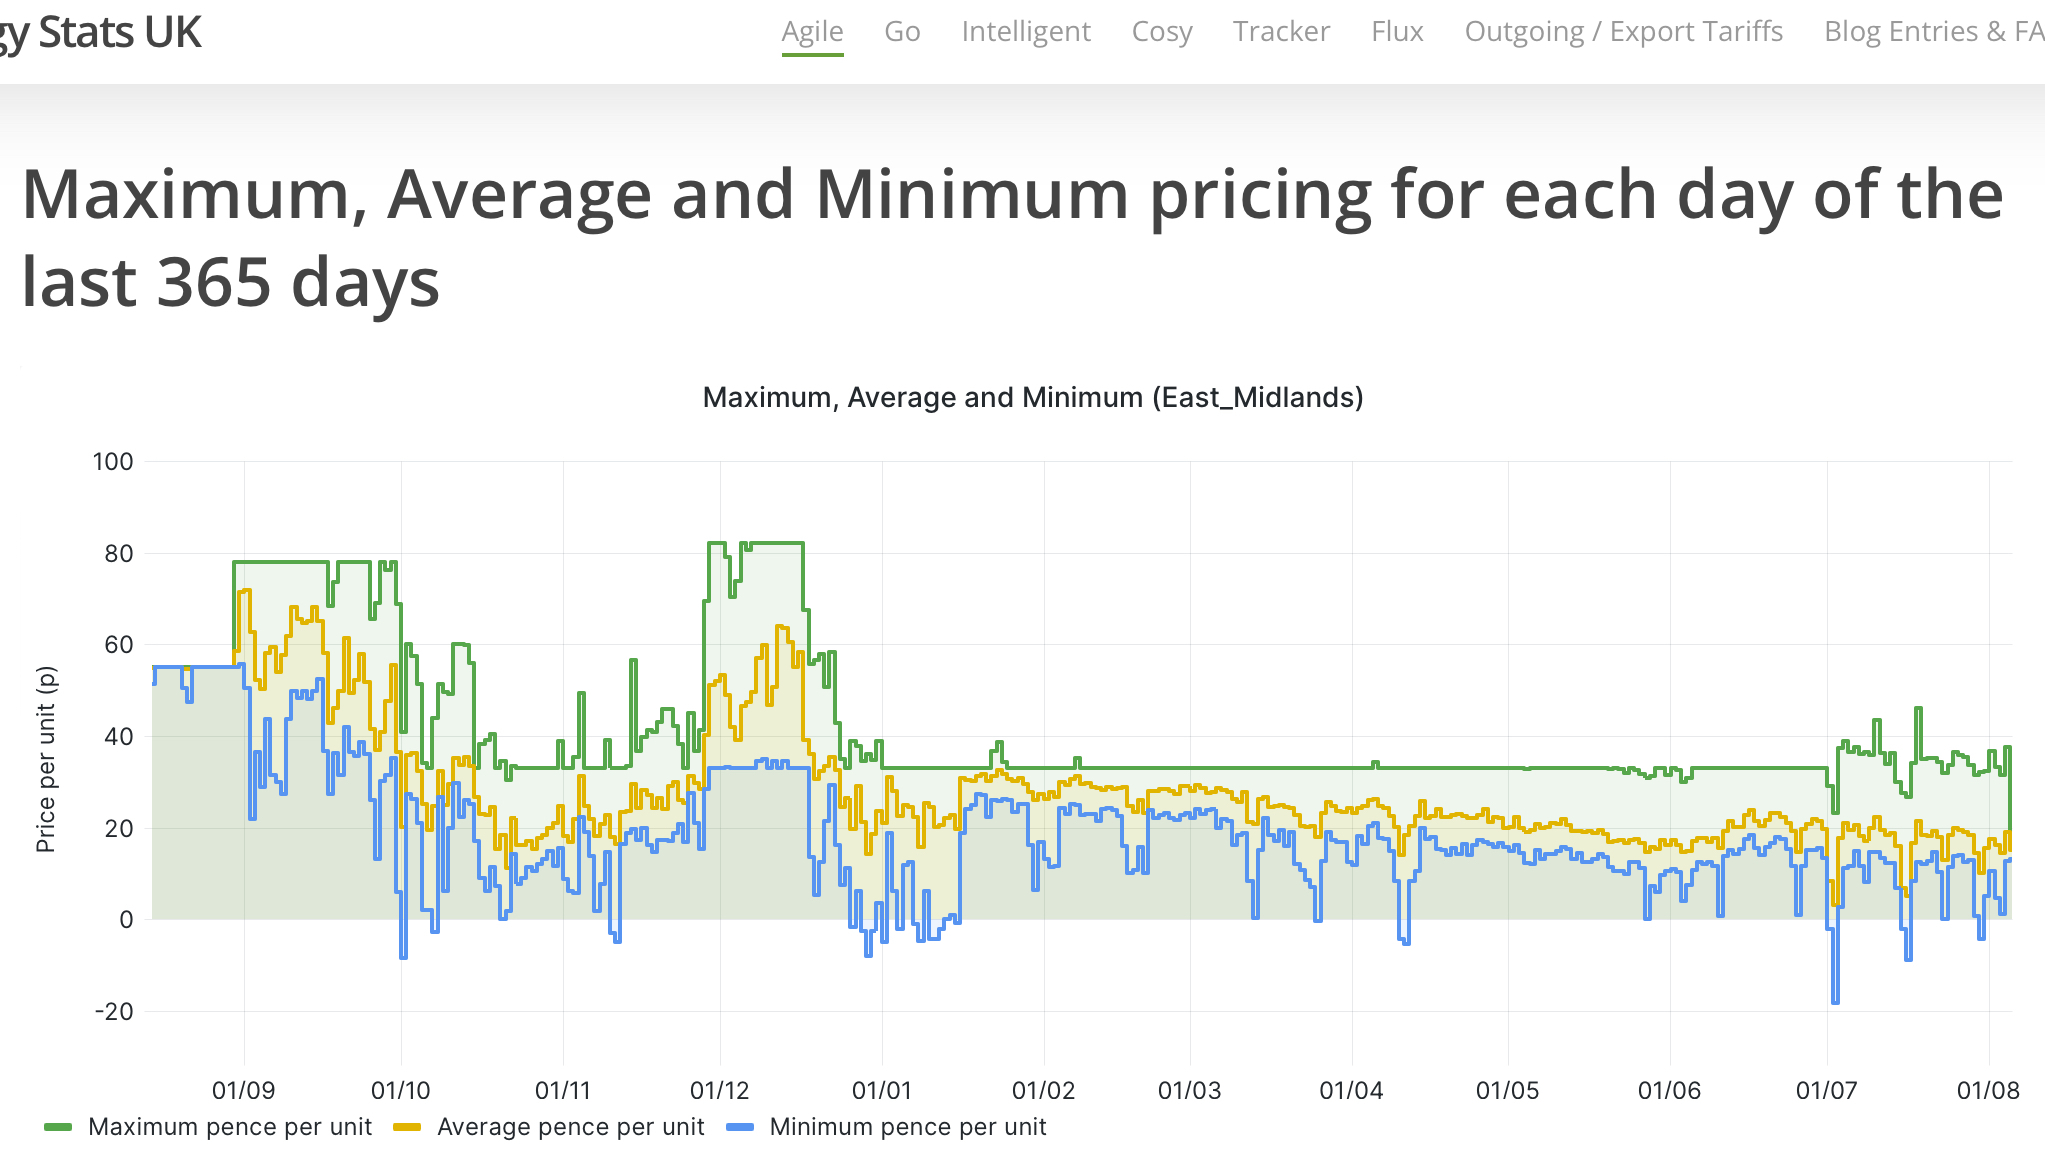 Credit: EnergyStats UK1
 -
Doesn't adding in Octopus tracker rates just confuse the poor OP who is effectively stuck on a business contract and can never ever get those rate?
Sort of rubbing salt in the already open wound and I can't for the life of me see how that helps.
Very weird2


Confirm your email address to Create Threads and Reply

Categories
- All Categories
- 354.8K Banking & Borrowing
- 254.5K Reduce Debt & Boost Income
- 455.6K Spending & Discounts
- 247.6K Work, Benefits & Business
- 604.5K Mortgages, Homes & Bills
- 178.6K Life & Family
- 262.1K Travel & Transport
- 1.5M Hobbies & Leisure
- 16.1K Discuss & Feedback
- 37.7K Read-Only Boards