We’d like to remind Forumites to please avoid political debate on the Forum.
This is to keep it a safe and useful space for MoneySaving discussions. Threads that are – or become – political in nature may be removed in line with the Forum’s rules. Thank you for your understanding.
📨 Have you signed up to the Forum's new Email Digest yet? Get a selection of trending threads sent straight to your inbox daily, weekly or monthly!
The Forum now has a brand new text editor, adding a bunch of handy features to use when creating posts. Read more in our how-to guide
Future distribution yield of bond funds
Comments
-
I'm glad to hear it turned out to be of use.
1 -
Looking at I/L gilts, where do I please find a schedule of previous coupon payments, eg for TR24?Also, the bid/offer after market closed shows 101.02 / 103.99 (with the last trade at 102.71) which is wider than closing spreads shown for nominal bonds. This of course does not reflect actual trading prices but are spreads on I/L gilts - and possibly on short dated ones? - wider than on nominal bonds?0
-
aroominyork said:Looking at I/L gilts, where do I please find a schedule of previous coupon payments, eg for TR24?Also, the bid/offer after market closed shows 101.02 / 103.99 (with the last trade at 102.71) which is wider than closing spreads shown for nominal bonds. This of course does not reflect actual trading prices but are spreads on I/L gilts - and possibly on short dated ones? - wider than on nominal bonds?My understanding is that it's a more illiquid market than nominal gilts, which would lead to higher spreads. I'm not aware of any site showing the historic distributions, but the prospectus outlines how to work these out and they are defined at issue. You can probably simplify the calculation to get a guide - some of the refinements, such as calculating indexation to the day are not going to make a great difference.Given that RPI is now going to be fiddled by the Truss tax on medium term energy, I'd be cautious about buying in on current expectations.
1 -
Curious that historic distributions are not published or listed somewhere. Whether or not Truss's plans are a fiddle, I'm not planning to buy - I'm happy with TN24; just building my knowledge about gilts.masonic said:aroominyork said:Looking at I/L gilts, where do I please find a schedule of previous coupon payments, eg for TR24?Also, the bid/offer after market closed shows 101.02 / 103.99 (with the last trade at 102.71) which is wider than closing spreads shown for nominal bonds. This of course does not reflect actual trading prices but are spreads on I/L gilts - and possibly on short dated ones? - wider than on nominal bonds?My understanding is that it's a more illiquid market than nominal gilts, which would lead to higher spreads. I'm not aware of any site showing the historic distributions, but the prospectus outlines how to work these out and they are defined at issue. You can probably simplify the calculation to get a guide - some of the refinements, such as calculating indexation to the day are not going to make a great difference.Given that RPI is now going to be fiddled by the Truss tax on medium term energy, I'd be cautious about buying in on current expectations.
0 -
The DMO's website has the data, or at least you can infer it.aroominyork said:
Curious that historic distributions are not published or listed somewhere. Whether or not Truss's plans are a fiddle, I'm not planning to buy - I'm happy with TN24; just building my knowledge about gilts.masonic said:aroominyork said:Looking at I/L gilts, where do I please find a schedule of previous coupon payments, eg for TR24?Also, the bid/offer after market closed shows 101.02 / 103.99 (with the last trade at 102.71) which is wider than closing spreads shown for nominal bonds. This of course does not reflect actual trading prices but are spreads on I/L gilts - and possibly on short dated ones? - wider than on nominal bonds?My understanding is that it's a more illiquid market than nominal gilts, which would lead to higher spreads. I'm not aware of any site showing the historic distributions, but the prospectus outlines how to work these out and they are defined at issue. You can probably simplify the calculation to get a guide - some of the refinements, such as calculating indexation to the day are not going to make a great difference.Given that RPI is now going to be fiddled by the Truss tax on medium term energy, I'd be cautious about buying in on current expectations.
https://www.dmo.gov.uk/data/pdfdatareport?reportCode=D1A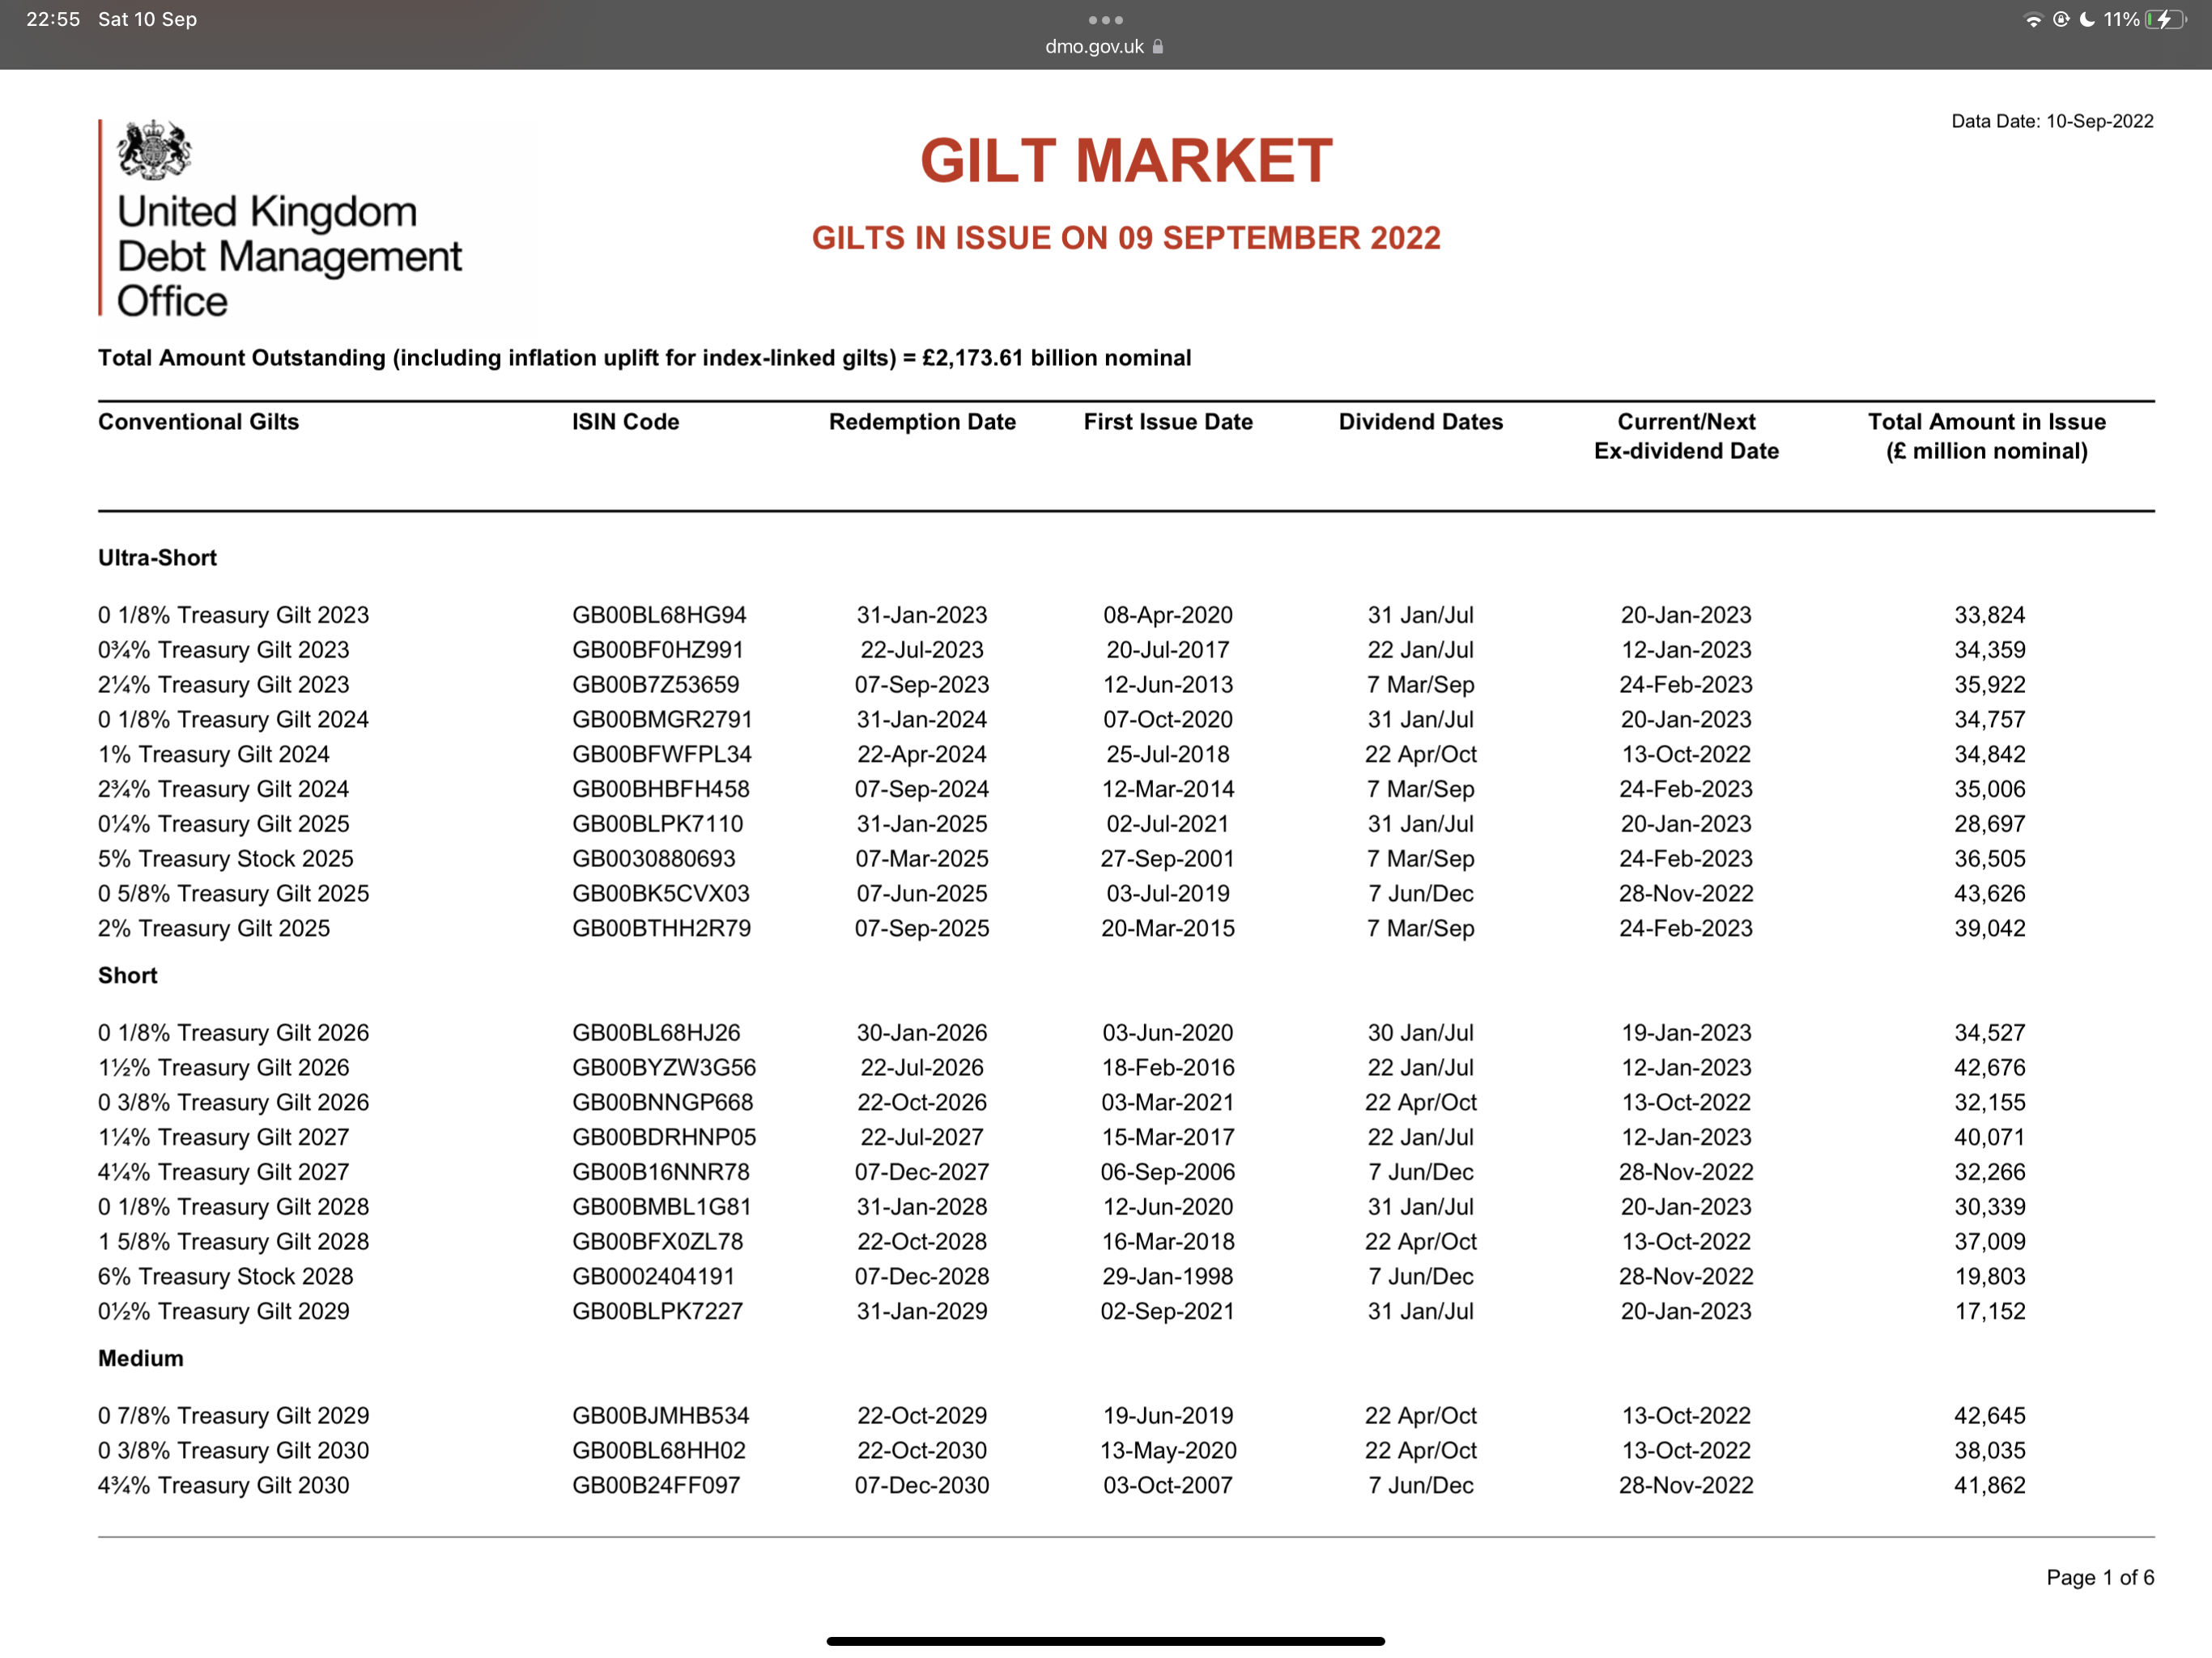
0


Confirm your email address to Create Threads and Reply

Categories
- All Categories
- 354.4K Banking & Borrowing
- 254.4K Reduce Debt & Boost Income
- 455.4K Spending & Discounts
- 247.3K Work, Benefits & Business
- 604K Mortgages, Homes & Bills
- 178.4K Life & Family
- 261.5K Travel & Transport
- 1.5M Hobbies & Leisure
- 16K Discuss & Feedback
- 37.7K Read-Only Boards