We’d like to remind Forumites to please avoid political debate on the Forum.
This is to keep it a safe and useful space for MoneySaving discussions. Threads that are – or become – political in nature may be removed in line with the Forum’s rules. Thank you for your understanding.
📨 Have you signed up to the Forum's new Email Digest yet? Get a selection of trending threads sent straight to your inbox daily, weekly or monthly!
The Forum now has a brand new text editor, adding a bunch of handy features to use when creating posts. Read more in our how-to guide
Is it conservative to assume a 5% annual return on a S&S LISA - Vanguard 100
Comments
-
I think mid 50s for me is a target I want to keep even though it clearly would be a good time to increase saving rate with kids through uni etc. I would rather cut my cloth accordingly and have the time rather than more money.
I guess it depends on your experience though. I had one parent die in their late 60s and one early 70s so I am conscious life is far too short. I don't want to die rich without living life.5 -
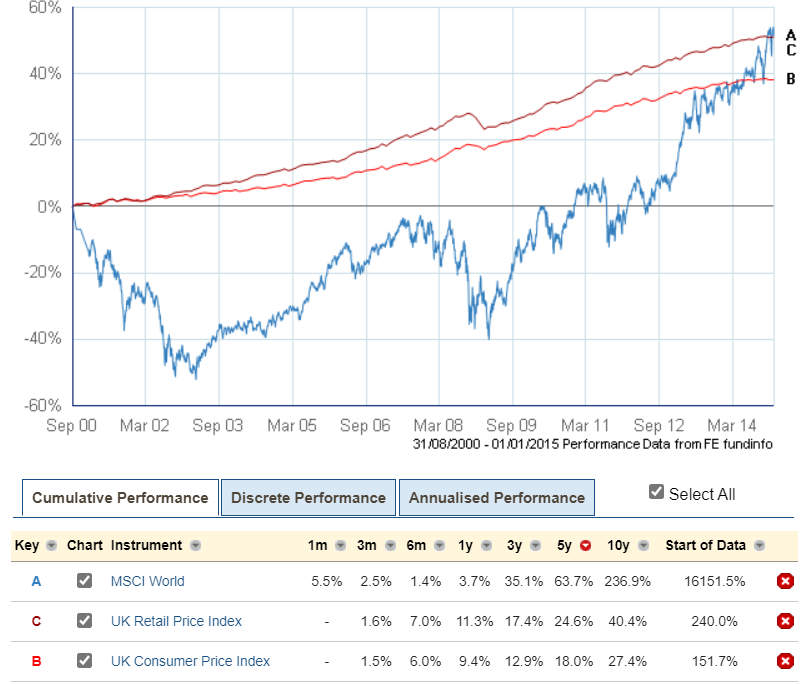
I use this graph as a reminder of how good its been recently compared to how it looked soon after I started my first pension. There were several times I doubted if it was worth it. Not helped by the fact that I lost a fair bit of income during both of those downturns and couldn't take advantage.
5 -
It is total return (so includes income reinvested - it was the ACC units). It was the R share class of the L&G tracker. The clean share classes didn't have a history going back that far. So, they would be a bit better.JohnWinder said:In the decade from 2000 to 2009, global trackers made nothing. 10 years and your value was lower than you started.Useful chart, but the Y axis is ambiguous. Is it the changing price of a unit in the fund, and you actually did make something in terms of distributions (not the end of the world); or is it the changing value of an investment with distributions reinvested (closer to the end of the world)?
The real point was to indicate that even over 10 year periods, you can get little or no growth.I am an Independent Financial Adviser (IFA). The comments I make are just my opinion and are for discussion purposes only. They are not financial advice and you should not treat them as such. If you feel an area discussed may be relevant to you, then please seek advice from an Independent Financial Adviser local to you.6 -
I've just set up a spreadsheet to work out the return on investing £1000, uprated by the UK RPI each year, for 12 years in the MSCI World (dividends reinvested) index (so converted into dollars at that year's rate), and then left to accumulate for 10 years, and then converted back into pounds and expressed in real terms compared to the starting year.
In the 20 most recent runs (ie starting from 1981, up to starting in 2000), returns vary from £18,138 (equivalent of a steady 2.7% real rate of return) to £38,490 (about 7.6%). Median was about 4.8% - £25,145. 3 out of 20 were under 3%; 8 out of 20 under 4%.
So I'd say a real rate of return of 5% is fairly optimistic. Maybe 3% is the conservative figure - beaten 85% of the time?3 -
Interesting info. Although some of the other graphs posted showed 2000 to 2010 as a zero return. Maybe an exchange rate issue.EthicsGradient said:I've just set up a spreadsheet to work out the return on investing £1000, uprated by the UK RPI each year, for 12 years in the MSCI World (dividends reinvested) index (so converted into dollars at that year's rate), and then left to accumulate for 10 years, and then converted back into pounds and expressed in real terms compared to the starting year.
In the 20 most recent runs (ie starting from 1981, up to starting in 2000), returns vary from £18,138 (equivalent of a steady 2.7% real rate of return) to £38,490 (about 7.6%). Median was about 4.8% - £25,145. 3 out of 20 were under 3%; 8 out of 20 under 4%.
So I'd say a real rate of return of 5% is fairly optimistic. Maybe 3% is the conservative figure - beaten 85% of the time?
By the wayI think the OP was ignoring inflation, as they were aiming to reach a specific cash sum to pay off a remaining mortgage debt, which would not be increasing by inflation0 -
The graphs show the value of a lump sum invested in 2000, which is very different from the value of paying in regularly for 12 years, and then leaving it there for 10 years, which is the OP's plan. The idea was to show the variation in the effective rate of return.Albermarle said:
Interesting info. Although some of the other graphs posted showed 2000 to 2010 as a zero return. Maybe an exchange rate issue.EthicsGradient said:I've just set up a spreadsheet to work out the return on investing £1000, uprated by the UK RPI each year, for 12 years in the MSCI World (dividends reinvested) index (so converted into dollars at that year's rate), and then left to accumulate for 10 years, and then converted back into pounds and expressed in real terms compared to the starting year.
In the 20 most recent runs (ie starting from 1981, up to starting in 2000), returns vary from £18,138 (equivalent of a steady 2.7% real rate of return) to £38,490 (about 7.6%). Median was about 4.8% - £25,145. 3 out of 20 were under 3%; 8 out of 20 under 4%.
So I'd say a real rate of return of 5% is fairly optimistic. Maybe 3% is the conservative figure - beaten 85% of the time?
By the wayI think the OP was ignoring inflation, as they were aiming to reach a specific cash sum to pay off a remaining mortgage debt, which would not be increasing by inflation
It seems reasonable to assume the regular amount that you pay in over the 12 years goes up in line with inflation (and since their original question was "is a real rate of growth of 5% conservative?", then we should indeed make constant real-terms payments, and look at what the result is in real terms (which was what their original calculation for 5% growth did, as well). The purpose is both to pay off the mortgage and be able to retire at 60, so the cost of living by the time they're 60 is also relevant.0 -
The graphs show the value of a lump sum invested in 2000, which is very different from the value of paying in regularly for 12 years, and then leaving it there for 10 years, which is the OP's plan. The idea was to show the variation in the effective rate of return.Not necessarily as the charts show a lump sum value invested in 2000 and left for 10 years. The op is building up that lump sum over 12 years but then leaving it for 10 years.It seems reasonable to assume the regular amount that you pay in over the 12 years goes up in line with inflation (and since their original question was "is a real rate of growth of 5% conservative?",You would like to think that would happen but a common failure in planning is for people not to increase their regular contributions.
I am an Independent Financial Adviser (IFA). The comments I make are just my opinion and are for discussion purposes only. They are not financial advice and you should not treat them as such. If you feel an area discussed may be relevant to you, then please seek advice from an Independent Financial Adviser local to you.0 -
OP saidEthicsGradient said:
The graphs show the value of a lump sum invested in 2000, which is very different from the value of paying in regularly for 12 years, and then leaving it there for 10 years, which is the OP's plan. The idea was to show the variation in the effective rate of return.Albermarle said:
Interesting info. Although some of the other graphs posted showed 2000 to 2010 as a zero return. Maybe an exchange rate issue.EthicsGradient said:I've just set up a spreadsheet to work out the return on investing £1000, uprated by the UK RPI each year, for 12 years in the MSCI World (dividends reinvested) index (so converted into dollars at that year's rate), and then left to accumulate for 10 years, and then converted back into pounds and expressed in real terms compared to the starting year.
In the 20 most recent runs (ie starting from 1981, up to starting in 2000), returns vary from £18,138 (equivalent of a steady 2.7% real rate of return) to £38,490 (about 7.6%). Median was about 4.8% - £25,145. 3 out of 20 were under 3%; 8 out of 20 under 4%.
So I'd say a real rate of return of 5% is fairly optimistic. Maybe 3% is the conservative figure - beaten 85% of the time?
By the wayI think the OP was ignoring inflation, as they were aiming to reach a specific cash sum to pay off a remaining mortgage debt, which would not be increasing by inflation
It seems reasonable to assume the regular amount that you pay in over the 12 years goes up in line with inflation (and since their original question was "is a real rate of growth of 5% conservative?", then we should indeed make constant real-terms payments, and look at what the result is in real terms (which was what their original calculation for 5% growth did, as well). The purpose is both to pay off the mortgage and be able to retire at 60, so the cost of living by the time they're 60 is also relevant.
I have excluded inflation and based it on todays money......as cash....not on buying power....
0 -
Exactly. That "excluded inflation" remark came after "where is inflation in your equation?" "Thanks, is 7.5%-10% more realistic?". 5% was the "in real terms" figure they were thinking of, 7.5-10% in cash terms.Albermarle said:
OP saidEthicsGradient said:
The graphs show the value of a lump sum invested in 2000, which is very different from the value of paying in regularly for 12 years, and then leaving it there for 10 years, which is the OP's plan. The idea was to show the variation in the effective rate of return.Albermarle said:
Interesting info. Although some of the other graphs posted showed 2000 to 2010 as a zero return. Maybe an exchange rate issue.EthicsGradient said:I've just set up a spreadsheet to work out the return on investing £1000, uprated by the UK RPI each year, for 12 years in the MSCI World (dividends reinvested) index (so converted into dollars at that year's rate), and then left to accumulate for 10 years, and then converted back into pounds and expressed in real terms compared to the starting year.
In the 20 most recent runs (ie starting from 1981, up to starting in 2000), returns vary from £18,138 (equivalent of a steady 2.7% real rate of return) to £38,490 (about 7.6%). Median was about 4.8% - £25,145. 3 out of 20 were under 3%; 8 out of 20 under 4%.
So I'd say a real rate of return of 5% is fairly optimistic. Maybe 3% is the conservative figure - beaten 85% of the time?
By the wayI think the OP was ignoring inflation, as they were aiming to reach a specific cash sum to pay off a remaining mortgage debt, which would not be increasing by inflation
It seems reasonable to assume the regular amount that you pay in over the 12 years goes up in line with inflation (and since their original question was "is a real rate of growth of 5% conservative?", then we should indeed make constant real-terms payments, and look at what the result is in real terms (which was what their original calculation for 5% growth did, as well). The purpose is both to pay off the mortgage and be able to retire at 60, so the cost of living by the time they're 60 is also relevant.
I have excluded inflation and based it on todays money......as cash....not on buying power....
"Not necessarily as the charts show a lump sum value invested in 2000 and left for 10 years. The op is building up that lump sum over 12 years but then leaving it for 10 years. "
Yes, so that's investing over 22 years, with some of it pound-cost averaged, not 10 - quite different.0 -
I'm sure that someone will be angry about my message, but I strongly think that the LISA, as well as the other stupid gov schemes, are just scams, UK is top level for such scams.
Review the rules and think if you wanna have control over the money, or if you easily wanna profit more than the stock market average (common indexes), both things are not satisfied with a LISA, so it's a scam!
Obviously, we may have another 2008, but guess what, the gov has your money anyway, in one way, you are gonna pay for the next crash.
In the meanwhile, there is still a stock market crash compared to a few dozens of months ago ONLY, we are just going into the real estate crash, signals have been seen, but it's moving slowly, as expected.
You may even don't believe in it, but inflation creates recession later on, and that's for everyone, no one will escape.
Your LISA doesn't resolve anything, actually it creates only problems.
0










Confirm your email address to Create Threads and Reply

Categories
- All Categories
- 354.6K Banking & Borrowing
- 254.5K Reduce Debt & Boost Income
- 455.5K Spending & Discounts
- 247.5K Work, Benefits & Business
- 604.4K Mortgages, Homes & Bills
- 178.6K Life & Family
- 261.9K Travel & Transport
- 1.5M Hobbies & Leisure
- 16.1K Discuss & Feedback
- 37.7K Read-Only Boards