We’d like to remind Forumites to please avoid political debate on the Forum.
This is to keep it a safe and useful space for MoneySaving discussions. Threads that are – or become – political in nature may be removed in line with the Forum’s rules. Thank you for your understanding.
Foolishness of the 4% rule
Comments
-
Back in the 1970's people were still using DB plans and annuities to fund retirement and even if they did have a 60/40 portfolio they would have been foolish to not stress test their plan and have a good cash buffer, and a guaranteed income floor that would keep the wolf from the door. That is why all retirees should think about what they would do if their retirement date was the beginning of a decade like the 1970s. I did that and decided that a rental property and actively taking a job with a DB plan would secure enough income for me to live on in retirement. I also planned ahead and paid voluntary NICs. Others might look at SP and natural yield or even a small annuity (yikes)...This requires planning ahead and probably aggressive saving but just a 60/40 portfolio and a 4% withdrawal rate is foolish unless you understand, accept and enjoy the risks involved.itwasntme001 said:Deleted_User said:Equities do normally protect from inflation. Very well. Over long term, as per usual. In the short term they could fall as the inflation and interest rates go up.Try telling that to someone who retired in 1970 at the age of 60, heavily invested in a 60/40 portfolio, and was about to start on a 10 year spending spree to enjoy retirement before they became less able.Yes thought you would change your mind about "equities do normally protect from inflation".“So we beat on, boats against the current, borne back ceaselessly into the past.”0 -
Nice. This points out that small changes at the beginning of drawdown can compound and flow throughout the years of retirement. One question, in the "Real Withdrawal" step functions are these inflation adjusted back to "today's dollars" so they stay as constant percentages rather than growing with inflation?OldScientist said:
Going on your original premise, that was £25k withdrawn annually from the pot for 7 years (i.e. 5%) and then (roughly) £15k per year thereafter (i.e. 3%)MK62 said:
My apologies......in my haste to write that before going out last night, I've miscalculated.....I actually meant 4%, the original thread subject, which is £20k not £25k.....doh!!!MK62 said:It's a hypothetical, but assume good health, say £25k pa.......and as for leaving anything, ideally yes, but lets say that's not a necessity (as if it was it would exclude annuities)
PS....assume £12k essential income....
How would you do it if you were single, and then if you were married to a similar age partner?
I agree with Bostonerimus that £25k pa might be a bit ambitious in this scenario.
I'm interested to see how the proponents of annuities (at current rates) would tackle this.....
Here are some results for this withdrawal pattern (60/40 portfolio, US data - I really my update my code to deal with UK inflation at some point!)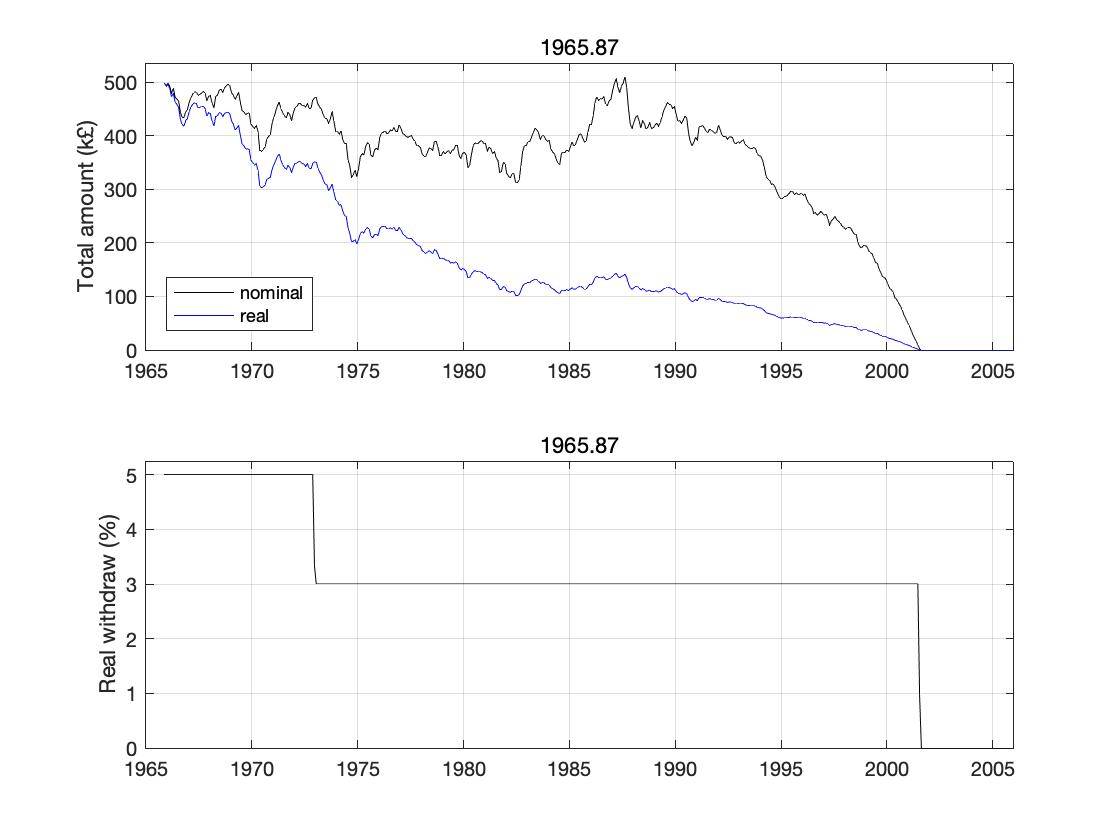
The portfolio lasted roughly 36 years (i.e. until the retiree is 96) - the period in the mid 60s, as usual, provides the worst cases). Overall the historical failure rate was about 1% (i.e. a lot better than a 40 year retirement with constant 4% where the failure rate was ~10%).
If you take your second version (i.e. 20k is required and not 25k) then things would have been even easier with an initial withdrawal of 4% and then 2% from year 7 onwards...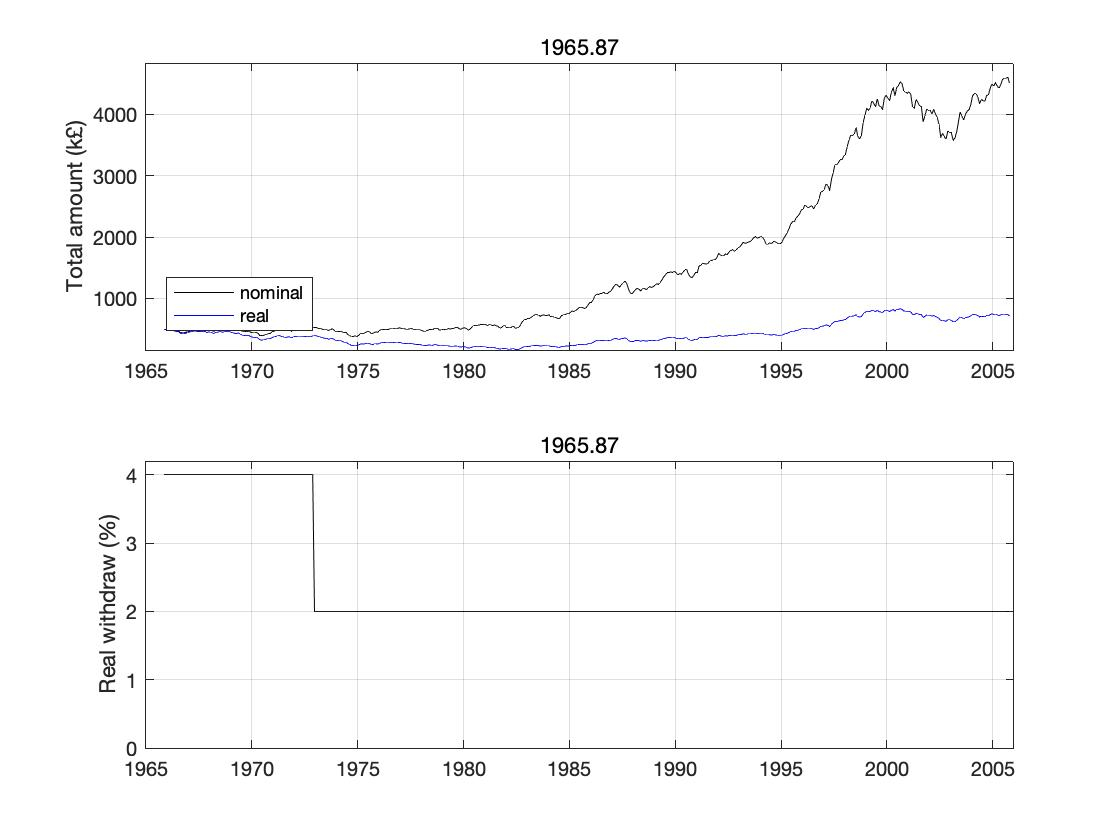
Here your heirs would have usually ended up very rich indeed (for 40 year retirements starting in 1980 you'd leave £5m in real terms).
For UK retirements, the first one would have been more of a stretch (the money would have run out a bit earlier - sorry, I don't know by how much), while the second one would almost certainly have been doable. While no-one can be certain, that implies that the first one, given that is is an edge case, may (or may not) work in the future, while the second has a lot more resilience built in since the portfolio was larger in real terms at the end than at the beginning in all historic cases.
Finally, what happens if we allow a small amount of variation in the spending in the first case. Here I've adjusted the required spending by 10% of the difference between the current portfolio value and the initial portfolio value, e.g. if the current portfolio was 50% of the initial portfolio in real terms and the desired spend 5%, then the actual spend would be 5*(1-(0.1*0.5))=4.75%, while if the current portfolio was 1.5 times bigger then the actual spend would be 5*(1+(0.1*0.5))=5.25%.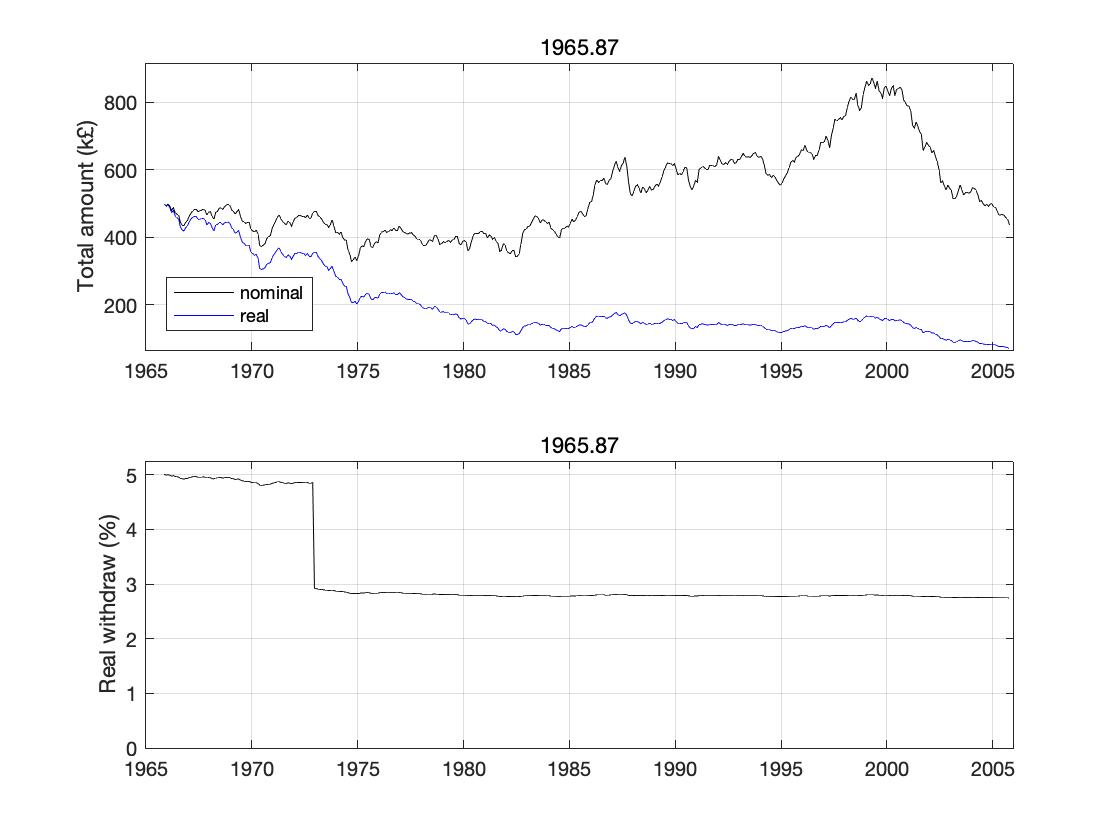
While the spend in the latter half of the retirement is below the 3% required (roughly 2.8%, i.e. 14k - taken with the 10k SP, then an income of £24k - not a huge sacrifice for more resilience). While the amount at the end of 40 years is quite small (about 70k in real-terms) it would actually have lasted until about 2011 (until the retiree was 106).“So we beat on, boats against the current, borne back ceaselessly into the past.”0 -
They present the probabilities of "success" given numerous arrangements of that data.
Yes, they generated a lot of scenarios for 30 year periods taking a 100 year US dataset. Basically they used a lot of overlapping data. They are not independent. A 30 year period starting in 1981 wouldn’t be all that different from one starting in 1980. Random sampling of years has the exact same problem.
If you take a 100 year period over which US moved from an emerging economy to an economic superpower, and assume the same dataset then you don’t need to run Monte Carlo. It obviously impressed people who don’t know stats but as a model to predict 30, 40, 50 years into the future (as it is being used)… Its complete nonsense.
And that’s ignoring the fact that FIAT money was introduced in 1970, then quantitative easing in 2008 and that the game played now has nothing to do with 1910 when US busted monopolies in a manner resembling today’s China. Today Washington might give them a slap on the wrist, and even that will be successfully challenged in courts.
0 -
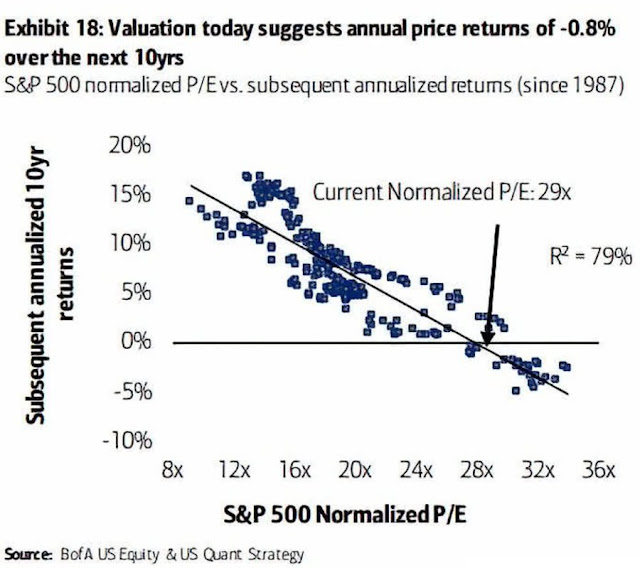
Recently Bank of America used the exact same overlapping dataset method to predict annual returns of -0.8% over the next decade based on P/E ratios. BofA stats look very impressive and correlations look strong until you realize they took 3 decades’ worth of data and all these dots on a straight line come from overlapping datasets. In reality you have just 3 independent points on this line, which is not enough for any kind of meaningful statistical analysis.
 0
0 -
Well it isn't as bad as 2009 and the last decade was ok. I did some rebalancing through that P/E spike and fall and things were ok. I won't do that this time though, I'll let it all ride and my bond allocation is now less than 20% so I expect some "fun". If you worry about P/E ratios then time the market or decouple your essential income from markets as much as you can so you can stop worrying about them.
“So we beat on, boats against the current, borne back ceaselessly into the past.”0 -
michaels said:
I think the issue there is that if you 'run a tight ship' then any reductions in income resulting form a variable drawdown strategy will directly hit standard of living as there is no 'fat to trim'. So yes in theory you need a smaller pot but in reality it is the minimum not the average of the return distribution that matters if you are not in a position to cut your expenditure.bostonerimus said:There's a natural tension in retirement planning between the income you need and the income you can genrate. A lot of thought goes into the income generation side of the equation and often very little into how much you really need to spend. I believe the spending side should get far more attention as big savings can be made in costs like housing, food, energy, taxes and insurance without much pain and often with actual well being gains.
Conversely though, someone living a lifestyle which already includes a lot of "fat", may feel that they are even harder done by than those who already "run a tight ship" (and I mean through choice not circumstance), if they should have to cut expenditure.
But I agree that the wiggle room to cut is there...but will probably be more strongly resisted. Maybe even turning to credit to sustain their "fatty" lifestyle. We see it elsewhere on these boards!!How's it going, AKA, Nutwatch? - 12 month spends to date = 2.60% of current retirement "pot" (as at end May 2025)0 -
michaels said:I think the issue there is that if you 'run a tight ship' then any reductions in income resulting form a variable drawdown strategy will directly hit standard of living as there is no 'fat to trim'. So yes in theory you need a smaller pot but in reality it is the minimum not the average of the return distribution that matters if you are not in a position to cut your expenditure.Any cut in income is going to hit your standard of living.......it might hit it in different ways of course, but one way or another, something has to give.For some, that might mean a Ford instead of a BMW, a hotel instead of a cruise, one restaurant a week instead of two......for others it could mean candles, blankets and beans on toast.That said, if you don't start retirement with a reasonable amount of wiggle room, you could be asking for trouble.......relatively speaking of course.0
-
the 'real withdrawal' is the index-linked withdrawal expressed as a percentage of the initial portfolio value (so for a £1m portfolio, the initial withdrawal here would be 50k and then index linked, at year 7, the withdrawal would be 30k plus inflation over the first 7 years. The withdrawal expressed as a percentage of the current portfolio value (whether real or nominal) gets quite large by 1972 - roughly 5*500/350~7% (one of the reasons the retirements in the 60s do so badly).bostonerimus said:
Nice. This points out that small changes at the beginning of drawdown can compound and flow throughout the years of retirement. One question, in the "Real Withdrawal" step functions are these inflation adjusted back to "today's dollars" so they stay as constant percentages rather than growing with inflation?OldScientist said:
Going on your original premise, that was £25k withdrawn annually from the pot for 7 years (i.e. 5%) and then (roughly) £15k per year thereafter (i.e. 3%)MK62 said:
My apologies......in my haste to write that before going out last night, I've miscalculated.....I actually meant 4%, the original thread subject, which is £20k not £25k.....doh!!!MK62 said:It's a hypothetical, but assume good health, say £25k pa.......and as for leaving anything, ideally yes, but lets say that's not a necessity (as if it was it would exclude annuities)
PS....assume £12k essential income....
How would you do it if you were single, and then if you were married to a similar age partner?
I agree with Bostonerimus that £25k pa might be a bit ambitious in this scenario.
I'm interested to see how the proponents of annuities (at current rates) would tackle this.....
Here are some results for this withdrawal pattern (60/40 portfolio, US data - I really my update my code to deal with UK inflation at some point!)
The portfolio lasted roughly 36 years (i.e. until the retiree is 96) - the period in the mid 60s, as usual, provides the worst cases). Overall the historical failure rate was about 1% (i.e. a lot better than a 40 year retirement with constant 4% where the failure rate was ~10%).
If you take your second version (i.e. 20k is required and not 25k) then things would have been even easier with an initial withdrawal of 4% and then 2% from year 7 onwards...
Here your heirs would have usually ended up very rich indeed (for 40 year retirements starting in 1980 you'd leave £5m in real terms).
For UK retirements, the first one would have been more of a stretch (the money would have run out a bit earlier - sorry, I don't know by how much), while the second one would almost certainly have been doable. While no-one can be certain, that implies that the first one, given that is is an edge case, may (or may not) work in the future, while the second has a lot more resilience built in since the portfolio was larger in real terms at the end than at the beginning in all historic cases.
Finally, what happens if we allow a small amount of variation in the spending in the first case. Here I've adjusted the required spending by 10% of the difference between the current portfolio value and the initial portfolio value, e.g. if the current portfolio was 50% of the initial portfolio in real terms and the desired spend 5%, then the actual spend would be 5*(1-(0.1*0.5))=4.75%, while if the current portfolio was 1.5 times bigger then the actual spend would be 5*(1+(0.1*0.5))=5.25%.
While the spend in the latter half of the retirement is below the 3% required (roughly 2.8%, i.e. 14k - taken with the 10k SP, then an income of £24k - not a huge sacrifice for more resilience). While the amount at the end of 40 years is quite small (about 70k in real-terms) it would actually have lasted until about 2011 (until the retiree was 106).
We've seen earlier in this thread (and in other threads elsewhere), where people broadly following the 4% rule-of-thumb say they'll adjust spending if they think their portfolio is going to crash. The question then has to be when and by how much? The method I described above was what I was originally going to use before I found VPW (the results from either approach were acceptable to me, even the much larger swings in income with VPW, but the simplicity of VPW won the day - my OH, who has little interest in the details of finance, is going to have to run this on my demise). The big advantage is that you can scale the percentage adjustment to your minimum acceptable income - e.g. I used 10% adjustment above, so the lowest withdrawal in the initial 7 years (if the portfolio went close to zero) would be 0.9*5=4.5%. If you were happy with 4% at this time, then you could up the adjustment to 20%. The big disadvantage, compared to VPW, is that you can still run out of money using this approach (it defers it to later than blindly following a 4% withdrawal).
0 -
Income is relatively easy to calculate - it is entirely a numerical process. Spending (and changes in spending) is more psychological and more variable from person to person (and we've seen from your squirrelled nuts, one person's spending contentment is another person's idea of hell) and, as such, much more difficult to address numerically, although there are some studies of retirement spending. I note that Kitces ratchet approach (https://www.kitces.com/blog/the-ratcheting-safe-withdrawal-rate-a-more-dominant-version-of-the-4-rule/) to withdrawal, tries to address this psychology (an unwillingness to cut spending) by starting with smallish withdrawals and then gradually increasing them if portfolio performance warrants this.Sea_Shell said:michaels said:
I think the issue there is that if you 'run a tight ship' then any reductions in income resulting form a variable drawdown strategy will directly hit standard of living as there is no 'fat to trim'. So yes in theory you need a smaller pot but in reality it is the minimum not the average of the return distribution that matters if you are not in a position to cut your expenditure.bostonerimus said:There's a natural tension in retirement planning between the income you need and the income you can genrate. A lot of thought goes into the income generation side of the equation and often very little into how much you really need to spend. I believe the spending side should get far more attention as big savings can be made in costs like housing, food, energy, taxes and insurance without much pain and often with actual well being gains.
Conversely though, someone living a lifestyle which already includes a lot of "fat", may feel that they are even harder done by than those who already "run a tight ship" (and I mean through choice not circumstance), if they should have to cut expenditure.
But I agree that the wiggle room to cut is there...but will probably be more strongly resisted. Maybe even turning to credit to sustain their "fatty" lifestyle. We see it elsewhere on these boards!!
1 -
I don’t worry about P/E ratio. I provided this to illustrate silliness of an approach similar to Bengen’s. Exactly same bad stats were used. BofA took 30 years worth of overlapping data from one index to predict the next 10. Bengen took 100 to predict 30. BofA got nonsensical R2 of 79%. Bengen derived nonsensical confidence levels.bostonerimus said:Well it isn't as bad as 2009 and the last decade was ok. I did some rebalancing through that P/E spike and fall and things were ok. I won't do that this time though. If you worry about P/E ratios then time the market or decouple your income from markets as much as you can so you can stop worrying about them.0


Confirm your email address to Create Threads and Reply

Categories
- All Categories
- 352.9K Banking & Borrowing
- 253.9K Reduce Debt & Boost Income
- 454.7K Spending & Discounts
- 246K Work, Benefits & Business
- 602K Mortgages, Homes & Bills
- 177.8K Life & Family
- 259.9K Travel & Transport
- 1.5M Hobbies & Leisure
- 16K Discuss & Feedback
- 37.7K Read-Only Boards