We’d like to remind Forumites to please avoid political debate on the Forum.
This is to keep it a safe and useful space for MoneySaving discussions. Threads that are – or become – political in nature may be removed in line with the Forum’s rules. Thank you for your understanding.
📨 Have you signed up to the Forum's new Email Digest yet? Get a selection of trending threads sent straight to your inbox daily, weekly or monthly!
Asset classes performance over time chart

nxdmsandkaskdjaqd
Posts: 876 Forumite


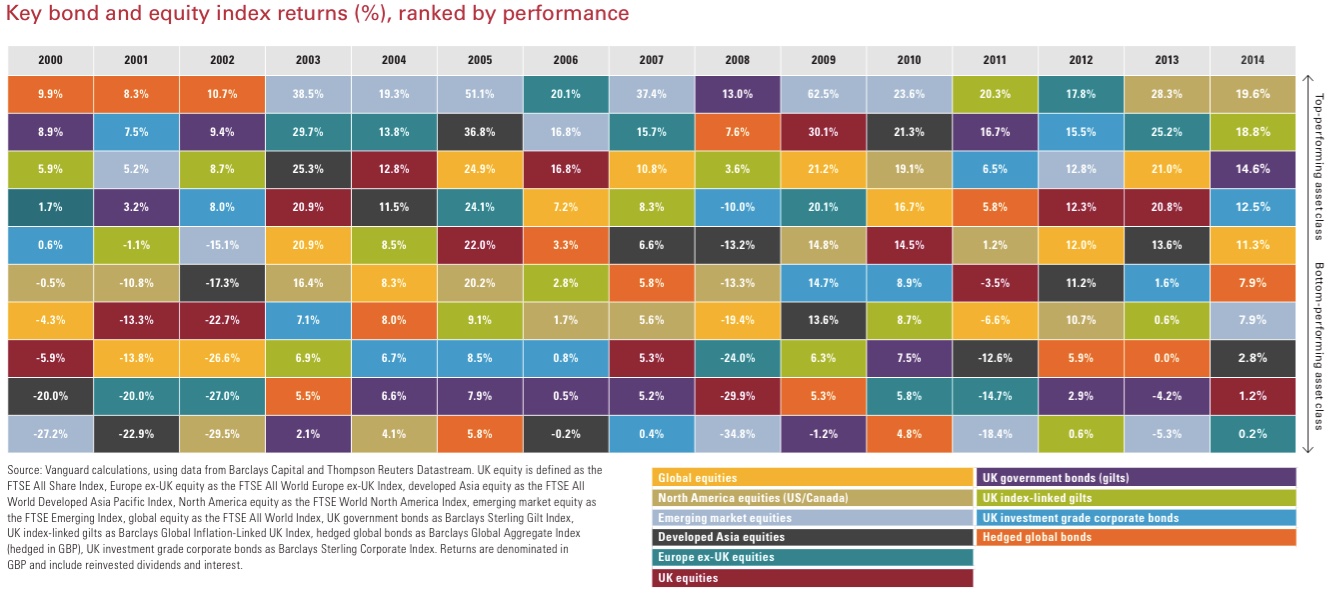
I have seen a chart of asset class performance over time as a chart (square boxes in different colours). So shows which assets (global, UK, Europe, Japan, etc) have performed best/worst over the years.
Anyone have a link to a current version?
Anyone have a link to a current version?
0
Comments
-
This is a system account and does not represent a real person. To contact the Forum Team email forumteam@moneysavingexpert.com0
-
They are widely available on the internet in a variety of types; regional, by country or by asset classes etc. Google 'Investment periodic tables'Old dog but always delighted to learn new tricks!0
-
-
The only problem with those is, they are always historic, you never see one for say the next five years.
 0
0 -
That would lead itself to some interesting back testing.
Eg suppose you put equal amounts (or any other proportions) in all classes and rebalanced every year,vs (say) all in any one class (global equities or teh classic 60/40 equities/bonds split being teh two obvious)0 -
Got the charts thanks0
-
AnotherJoe wrote: »That would lead itself to some interesting back testing.
Eg suppose you put equal amounts (or any other proportions) in all classes and rebalanced every year,vs (say) all in any one class (global equities or teh classic 60/40 equities/bonds split being teh two obvious)
Having spent some time spreadsheeting I can give you the answers, assuming no errors .......
Returns over 15 yars (2000-2014), starting with 10% in each class - this is 60/40 equity/bonds
1) Rebalanced every year: 146% total return = 6.18% annual
2) No rebalancing:128% total return = 5.65% annual
Global equity: 93% total return = 4.5% annual
The best single performer was EM equity at 221% total return=8.1% annually
Make of that what you will. Dont forget the time period contained 2 major equity crashes and only 1.5 recoveries. I think the results would be rather different if we could add in the past 5 years.0 -
These results seem sensible in my eyes. It's a real pity that they did not split up equities into subcategories. I would bet that tech/midcap stocks were at par with EM.0
-
AnotherJoe wrote: »The only problem with those is, they are always historic, you never see one for say the next five years.
Don't be so impatient, I have it on good authority that one is due to be published. Just give it a little time.") 0
0 -
Having spent some time spreadsheeting I can give you the answers, assuming no errors .......
Returns over 15 yars (2000-2014), starting with 10% in each class - this is 60/40 equity/bonds
1) Rebalanced every year: 146% total return = 6.18% annual
2) No rebalancing:128% total return = 5.65% annual
Global equity: 93% total return = 4.5% annual
The best single performer was EM equity at 221% total return=8.1% annually
Make of that what you will. Dont forget the time period contained 2 major equity crashes and only 1.5 recoveries. I think the results would be rather different if we could add in the past 5 years.
Here we go I think https://www.vanguard.co.uk/documents/adv/literature/tactical-asset-allocation-equity-and-bond.pdf0


This discussion has been closed.
Confirm your email address to Create Threads and Reply

Categories
- All Categories
- 355.1K Banking & Borrowing
- 254.7K Reduce Debt & Boost Income
- 455.8K Spending & Discounts
- 247.9K Work, Benefits & Business
- 605K Mortgages, Homes & Bills
- 178.8K Life & Family
- 262.7K Travel & Transport
- 1.5M Hobbies & Leisure
- 16.1K Discuss & Feedback
- 37.7K Read-Only Boards