We’d like to remind Forumites to please avoid political debate on the Forum.
This is to keep it a safe and useful space for MoneySaving discussions. Threads that are – or become – political in nature may be removed in line with the Forum’s rules. Thank you for your understanding.
Debate House Prices
In order to help keep the Forum a useful, safe and friendly place for our users, discussions around non MoneySaving matters are no longer permitted. This includes wider debates about general house prices, the economy and politics. As a result, we have taken the decision to keep this board permanently closed, but it remains viewable for users who may find some useful information in it. Thank you for your understanding.
📨 Have you signed up to the Forum's new Email Digest yet? Get a selection of trending threads sent straight to your inbox daily, weekly or monthly!
The Forum now has a brand new text editor, adding a bunch of handy features to use when creating posts. Read more in our how-to guide
How Cheap Can Solar Get?

Generali
Posts: 36,411 Forumite


Spoiler alert! Very cheap indeed.
http://rameznaam.com/2015/08/10/how-cheap-can-solar-get-very-cheap-indeed/
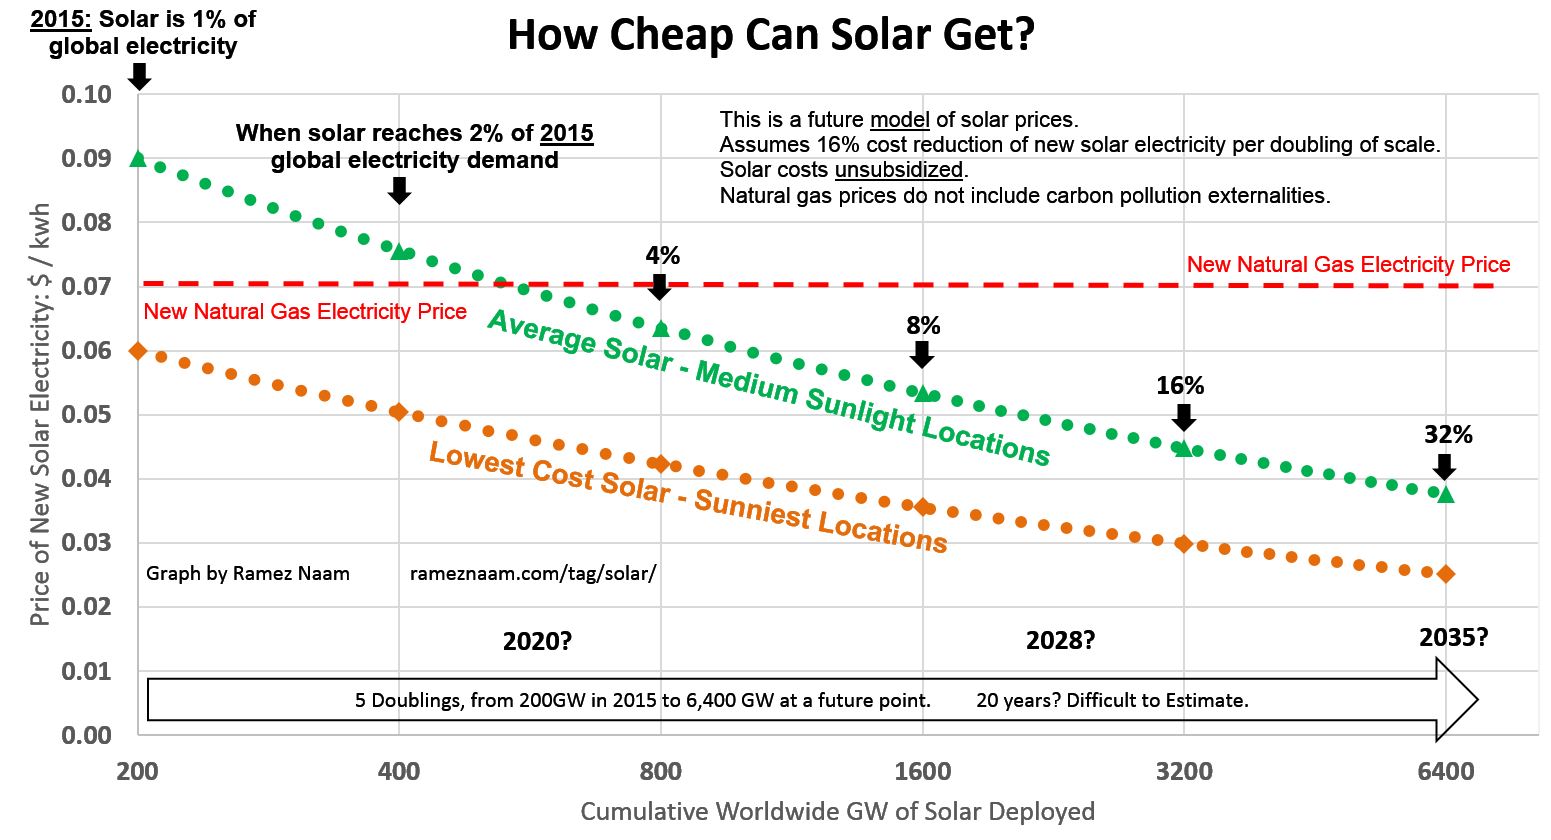
If you doubt whether prices will fall like that this is based on a conservative interpretation of history (according to the article). The Model T by comparison:
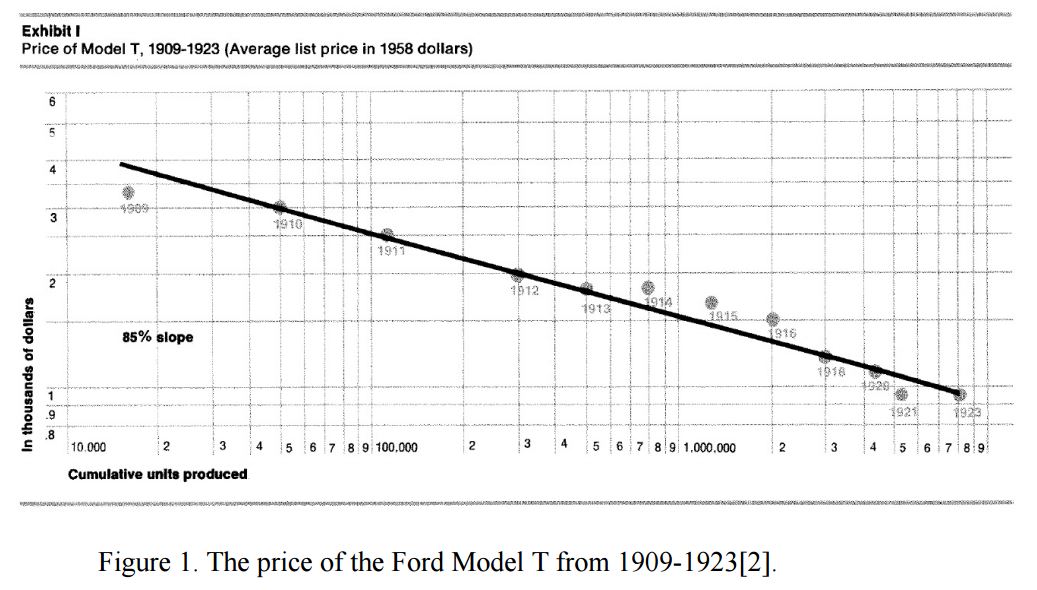
The retail price of electricity in NSW is currently about 20c/kWh and the wholesale price last year was about 4c per kWh (or more accurately $40 per MWh). If the graph holds, solar will be cheaper than the wholesale price of electricity within 20 years in sunny places.
http://rameznaam.com/2015/08/10/how-cheap-can-solar-get-very-cheap-indeed/
If you doubt whether prices will fall like that this is based on a conservative interpretation of history (according to the article). The Model T by comparison:
The retail price of electricity in NSW is currently about 20c/kWh and the wholesale price last year was about 4c per kWh (or more accurately $40 per MWh). If the graph holds, solar will be cheaper than the wholesale price of electricity within 20 years in sunny places.
0
Comments
-
Cells will know better than me, but I read a year or so ago that a disruptive new technology could be coming to solar, I think it was called thin photovoltaic film, or something like that.
So is there potential for even greater saving if
A) the user base increases making economies of scale greater") what is needed to deliver solar in terms of product can also be made simpler?
what is needed to deliver solar in terms of product can also be made simpler?
Interesting question though. Especially if it takes off to the extent that some manufacturing industries with relatively high energy inputs find it cheaper to move closer to the equator. Could prove quite a boost for poorer countries.
Meanwhile, back in cold Britain, aren't we due to get some geothermal energy from Iceland?Please stay safe in the sun and learn the A-E of melanoma: A = asymmetry, B = irregular borders, C= different colours, D= diameter, larger than 6mm, E = evolving, is your mole changing? Most moles are not cancerous, any doubts, please check next time you visit your GP.
0 -
Of course solar panels aren't much use when it is raining...yet!
http://www.msn.com/en-gb/money/technology/next-generation-solar-panel-technology-could-turn-rain-into-energy/ar-BBrFaQa?li=BBoPWjQI think....0 -
With my data presentation hat on, slightly poor form to post up normal and logarithmic axis graphs above each other for comparison.I think....0
-
http://www.bbc.co.uk/news/business-35942034
Story about a smart meter trial with cheap energy when the sun shines. The future looks like it's going to be one of smart devices and metering.0 -
solar install cant double every 5 years like that graph seems to suggest. That was a silly mistake the fans made when solar was small. Its already obvious that trend is dead since the last 3 years has been nowhere close to an exponential
Personally I think from here on the world will continue to add ~50GWp a year
Also a new gas plant in the USA which is where I assume the graph is from is closer to 3 cents at current gas prices not 7
fossil fuels can get cheaper before any competitor takes significant market share. look at oil it went from $100-->$30 and it can go from $30-->$10
Also the world is expanding its needs at a rate faster than that graph is expanding solar so it looks likely that for the next 20 years even if solar and wind install base grows a lot the net result is still no less fossil fuel burn.
but overall it does seem the trend in solar and wind is down over the next 20 years and its popular enough for the politions who only understand 'the sun is free'. Fossil fuels have had the price kicked out of them over the last 2 years its less clear what will happen there0 -
If you read the piece the writer seems to try to take a very conservative view of things.
the biggest mistake is the expectation of install base doubling every period
Nothing grows exponentially forever for obvious reasons. World has already likely in a linear growth stage for a few years and then it will be more of a flat install.0 -
the rate of interest is going to be key in the economics of large capital projects like solar/wind.
As rates have crashed it makes solar/wind more possible.
Like I discussed in other threads, the world needs to tend towards lower rates so as to allow longer term high capital cost projects to be viable.
Of course the PV plants will need much larger lifetimes hopefully 100+ years.0 -
The graph the IEA produce looks an awful lot like capacity is increasing at an exponential rate:
http://www.iea-pvps.org/index.php?id=trends0
This is a link to the IEA's graph on another website:
I don't see the slowdown in PV installation. What source do you have that is more authoritative than the IEA? Can you at least provide a link to back up your claims?
It's clear that you think you know what you're talking about but I find it hard to believe you when you make claims that are so easily refuted from what is surely the best source in the world.0 -
The graph the IEA produce looks an awful lot like capacity is increasing at an exponential rate:
http://www.iea-pvps.org/index.php?id=trends0
This is a link to the IEA's graph on another website:
I don't see the slowdown in PV installation. What source do you have that is more authoritative than the IEA? Can you at least provide a link to back up your claims?
It's clear that you think you know what you're talking about but I find it hard to believe you when you make claims that are so easily refuted from what is surely the best source in the world.
its simple mathematics nothing can grow exponentially for a long time.
plus the data is out there
2011: 30.1 GW
2012: 30.0 GW
2013: 38.4 GW
2014: 40.1 GW
That is not an exponential.
Of course draw a graph going back 20 years and you can hid the fact that things grow exponentially until they dont
I couldn't find 2015 data just predictions but the predictions seem to suggest 50GW. So yes its growing but its not exponential.0


This discussion has been closed.
Confirm your email address to Create Threads and Reply

Categories
- All Categories
- 353.6K Banking & Borrowing
- 254.2K Reduce Debt & Boost Income
- 455.1K Spending & Discounts
- 246.7K Work, Benefits & Business
- 603K Mortgages, Homes & Bills
- 178.1K Life & Family
- 260.7K Travel & Transport
- 1.5M Hobbies & Leisure
- 16K Discuss & Feedback
- 37.7K Read-Only Boards