We’d like to remind Forumites to please avoid political debate on the Forum.
This is to keep it a safe and useful space for MoneySaving discussions. Threads that are – or become – political in nature may be removed in line with the Forum’s rules. Thank you for your understanding.
📨 Have you signed up to the Forum's new Email Digest yet? Get a selection of trending threads sent straight to your inbox daily, weekly or monthly!
The Forum now has a brand new text editor, adding a bunch of handy features to use when creating posts. Read more in our how-to guide
Most Frightening Words
Comments
-
'It will be alright this time'.....0
-
for ppl complaining about taxes:
taxes are the price we pay for civilisation. do you hate civilisation?") 0
0 -
Wage differentials have risen to the point where the average FTSE boss gets 183 times his average worker."progressive taxation"
There's been a lot of "progression" of another sort: back in 1980 the top 1% of tax payers paid 11% of all income tax, today it's 30% of it.
Income tax may have fallen, but its been replaced by stealth taxes like higher VAT which hit the poorest hardest. People who are below the income tax thresholds pay the full increased rate of VAT for example“It is difficult to get a man to understand something, when his salary depends on his not understanding it.” --Upton Sinclair0 -
I agree with the implicit nomination of "income inequality" as frightening words.
nicknameless, UK income inequality was the lowest it'd been for 25 years in 2013. Of particular note: "On average, the bottom three-fifths of all households received more in benefits than they paid in taxes".
That's 60% of households who have an incentive to vote for more government spending, knowing that on average they won't be paying for it.
Suggest you dont use the Daily Mail as a source of reliable information. Try some calculations based on the ONS data here. Table 14 gives it as deciles.
In summary, if we look at a few examples of the ratio between the top 10% and the bottom 10% in final income after wages, benefits, taxes etc:
1977 - 4.23
1987 - 5.29
1997 - 5.87
2007 - 5.85
2013 - 6.11
One could map that data onto which party was in power at the time...0 -
My missus, Does my bum look big in this !!! , No darling you look lovely as usual.
The dreaded clothes shop to, Do you like this, Yes it looks good, Oh you are just saying that to be nice. !!!!0 -
Are there any pilots on board, or anyone with any flying experience, if so, please come to the front of the plane immediately.Chuck Norris can kill two stones with one birdThe only time Chuck Norris was wrong was when he thought he had made a mistakeChuck Norris puts the "laughter" in "manslaughter".I've started running again, after several injuries had forced me to stop0
-
I agree with the implicit nomination of "income inequality" as frightening words.
nicknameless, UK income inequality was the lowest it'd been for 25 years in 2013. Of particular note: "On average, the bottom three-fifths of all households received more in benefits than they paid in taxes".
That's 60% of households who have an incentive to vote for more government spending, knowing that on average they won't be paying for it.
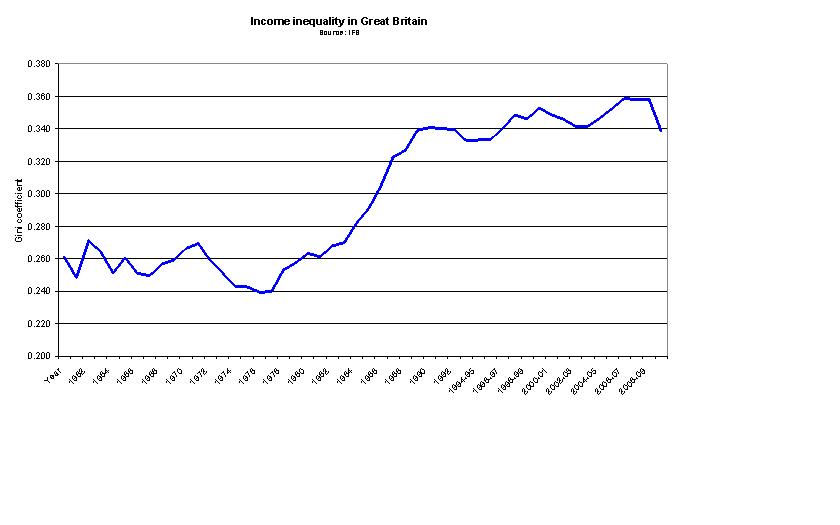
lol at the implicit misrepresentation
we can all pick a timepoint, such as the unprecented rise in income inequality in the 80s, which just happens to predate the above, but postdate your original point of reference from 1980.0 -
 0
0 -
Source of graph? How do the source define 'income inequality'?0
-
"let the market decide"0


This discussion has been closed.
Confirm your email address to Create Threads and Reply

Categories
- All Categories
- 354.8K Banking & Borrowing
- 254.5K Reduce Debt & Boost Income
- 455.6K Spending & Discounts
- 247.6K Work, Benefits & Business
- 604.5K Mortgages, Homes & Bills
- 178.6K Life & Family
- 262.1K Travel & Transport
- 1.5M Hobbies & Leisure
- 16.1K Discuss & Feedback
- 37.7K Read-Only Boards