We’d like to remind Forumites to please avoid political debate on the Forum.
This is to keep it a safe and useful space for MoneySaving discussions. Threads that are – or become – political in nature may be removed in line with the Forum’s rules. Thank you for your understanding.
📨 Have you signed up to the Forum's new Email Digest yet? Get a selection of trending threads sent straight to your inbox daily, weekly or monthly!
The Forum now has a brand new text editor, adding a bunch of handy features to use when creating posts. Read more in our how-to guide
Dow Jones Breaks 16000
Comments
-
I have been buying Gold and Silver coins for many years and as a Collection are worth more than the physical price.
I will not sell them unless I really have to, but what my Girls will do with their inheritance is another thing!!!
F40 -
I haven't got the bookmark to hand but didn't someone post a link to "DIY penion" blog recently that showed the long term trend average of the FTSE, in real terms, was relatively flat?
Without dividends it is only holding it's own.
As for markets pricing in they can only cry wolf so many times. They know that tapering will happen at some point."If you act like an illiterate man, your learning will never stop... Being uneducated, you have no fear of the future.".....
"big business is parasitic, like a mosquito, whereas I prefer the lighter touch, like that of a butterfly. "A butterfly can suck honey from the flower without damaging it," "Arunachalam Muruganantham0 -
0
-
I think one of the main points is that, let's say the money printing leads to an increase in inflation in excess of the long term average over the next decade, which is a reasonable expectation. Would this not make the analysis of any charts a pointless effort?
Technical analysis may lead someone to the belief that the FTSE or DOW is due a 20% drop - but the index could level off in nominal terms and the expected drop could come through one of today's pounds only being worth 80p in 5 years time.0 -
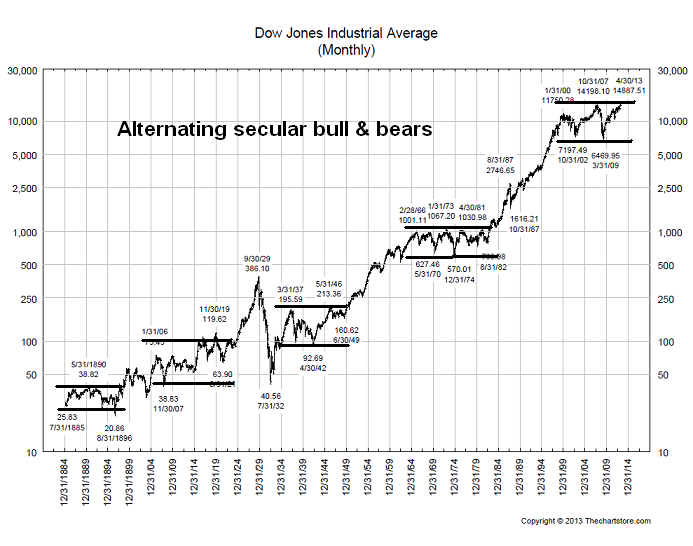
Thing is, you can prove anything you like with cherry picked lines on graphs.
Here's the one you posted (which I appreciate might not be your own view, so I'm not trying to shoot the messenger)...
Methodology: get a graph going back 25 years of the Dow capital value, excluding reinvested dividends and unadjusted for inflation. Arbitrarily quadruple the starting value to give you ~8600. Then wait an arbitrary 10 years and then draw a line through the bottom values you see from that point onwards, through to now.
Then go back to the highest quarterly peak in the five years after you started looking at the troughs, and draw a line from that to the top of the last peak before the collapse of Lehman Bros. Keep that line going and you'll hit today's value.
Then observe that the Dow value has never gone outside your triangle (apart from during the first 40% of the graph), and therefore the most likely outcome is that it will bounce off the ceiling of your triangle and go to 5000ish in relatively short order. It's written in the stars and proved by the graph. Anyone who calls coincidence and cherry-picking shall be derided as an uneducated buffoon who clearly has not been educated in technical analysis and chartism.
Let's try another:
Method: go back 16 years over which time the Dow has pretty much exactly doubled (an average 500 pts per year or a compound nominal return of 4.4%), which seems a reasonable return for a holding of 30 well-known blue chips which have not been selected for growth characteristics over a couple of economic cycles, and excludes dividends received along the way.
As in the first graph, draw a line from the start across the bottom points. Draw another line up to the top of the rally after the collapse of Enron, and continue to hit the next top point in 2007 pre credit crunch. Voila, another triangle. In this triangle, the Dow is not due a heavy downwards correction just yet, and will keep going to 18000.
One last one:
Method: go back 10-11 years, the minimum timeframe you should consider for making equity investments. From the bottom of the market trough you find there, draw a line of best fit up to the peak of the market some five years later.
Then wait for the market to return to your start point and draw a parallel line upwards again. Congratulations, you have drawn a rising channel within which the market has stayed over a period of about a decade. Any lower than 14000 would be too low, while the Dow could hit 25000 on the upside and still be in the channel.
None of these 3 charts necessarily reflects my view, they are simply alternatives out of infinite possiblities. I am of course happier buying stocks with Dow at 10,000 or FTSE at 5000 and there are perhaps more attractive markets than US industrials.
Glen Clark's comment that the value of fiat currency has fallen due to money printing is astute - clearly one would not expect the value of shares and their indexes to do anything other than go up in dollar terms in such a scenario. Tapering asset purchases has of course already been telegraphed by the Fed this year with the longer-term uptrend flattening accordingly each time someone senior reminds us about it. As Marathonic notes, the market is well aware that this is on the cards.
Of course there will be some correction when it does, but this could be single digit percentages..Who knows what solid economic improvements will provoke the turning off of the taps? But when it happens, merely tapering purchases is not the same as selling, which would not be done until the real economy is very significantly stronger, if at all, so I don't see the Dow back at 5000 any time soon.
To go back to the OP:
The purpose of the companies making up those indices, their very raison d'etre, is to generate profits for shareholders. The fact that over time their share prices rise in nominal dollar terms, is not newsworthy per se. If the share prices rose smoothly in a straight line you would beat an index record every day of your life.The Dow has broken 16000 and is at record levels closely followed by the S&P 500 heading above 1800.
The markets correct several times per second. Sometimes there are larger changes of direction visible on weekly charts, monthly charts, decade charts, or life to date charts. Are you expecting the next 'correction' to be one you can see from the end of your desk, the end of the garden, or from the moon? Merely stating that some sort of correction is around the corner and then leaving an ominous 'watch this space' memo - may get you some pats on the back when it happens in a month or a year or a decade but it is not very incisiveA correction must surely be just around the corner.
Personally I now have a greater percentage of my pension in non-equities than I did 25% growth ago, but I'm not taking all my chips off all the tables. Mostly reshuffling which for most people is worth doing every so often anyway, and I am more active than most.0 -
The Dow Jones industrial average topped 16,000 for the first time ever Monday, while the S&P 500 briefly surpassed 1,800. But neither indexes closed above those milestones.
The Dow rose to an all-time high of 16,040.20 but pulled back as the day wore on. The S&P 500 rose to a record of 1,802.37 but finished the day lower.
The Nasdaq fell 1% Monday, but it too is on the verge of a milestone. The tech-heavy index is nearing 4,000, a level it hasn't hit since September 2000 -- just months after the tech market collapsed.
Stocks lost momentum in afternoon trading after Carl Icahn said he is "very cautious" on the stock market going forward. Speaking at the Reuters Global Investment Outlook summit, the billionaire activist investor said he could see a "big drop" in stocks. Icahn blamed earnings for his downbeat outlook, nothing that companies are boosting profits thanks to low borrowing costs instead of strong management.
Still, the Dow and S&P 500 are up more than 20% so far in 2013.
Experts say that this year's roaring bull market is due largely to stimulative monetary policies from the Federal Reserve as well as decent corporate earnings.
Investors will be keeping a close eye on the Fed in particular during the coming months. Current Fed chairman Ben Bernanke, the architect of the central bank's bond purchase program, will leave that role when his term expires at the end of January. Bernanke is likely to be replaced by Fed vice chair Janet Yellen, who just needs to be confirmed by the Senate.
The market has been encouraged by comments from Yellen during her Senate confirmation hearing last week about how the Fed's policies, particularly the $85-billion-per-month bond-buying program, can continue to help the market and economy.
But ultimately, Yellen is expected to scale back, or taper, the bond buying program at some point next year, raising questions about how much longer the nearly 5-year old bull market can last. In fact, there are some traders who think it's possible the Fed could announce it will begin tapering following its next policy meeting in December.
StockTwits user Learnstocks101 quipped, "$SPY What happens if Ben yells 'taper' in a crowded bull market?"
When Bernanke first hinted at tapering in May, the S&P 500 tumbled 6% over the subsequent four weeks. But stocks have since rallied back.
"$SPY, The only fear in this market is the fear to actually sell a stock and miss out on the greed," noted Hoyasparanoia. "Dangerous!"
http://money.cnn.com/2013/11/18/investing/stocks-markets/index.html
The correction is coming.") 0
0 -
The country's goin' to hell faster than when that son of a !!!!! Roosevelt was in charge. Too much cheap money sloshing around the world. The worst mistake we ever made was letting Nixon get off the gold standard.
") 0
0 -
"If you act like an illiterate man, your learning will never stop... Being uneducated, you have no fear of the future.".....
"big business is parasitic, like a mosquito, whereas I prefer the lighter touch, like that of a butterfly. "A butterfly can suck honey from the flower without damaging it," "Arunachalam Muruganantham0 -
bowlhead99 wrote: »Thing is, you can prove anything you like with cherry picked lines on graphs.
Here's the one you posted (which I appreciate might not be your own view, so I'm not trying to shoot the messenger.]
It was taken from a blog...can't see huge drops myself just a correction at some point.
Heres one to make investors happy...its broken out of the range.
http://1.bp.blogspot.com/-ZJ0ZDCyEEu0/UYaTbTpuRXI/AAAAAAAAF4s/geidfAze-Ps/s1600/LT+Dow.png0 -
If our Prime Minister had kept his promises and done what he said he was going to do then cash savings would have been OK since he came into power
see link - and its not to some left wing rag its the Daily Torygraph: http://www.telegraph.co.uk/finance/personalfinance/pensions/10457090/Camerons-broken-promise-to-savers-costs-68bn.html“It is difficult to get a man to understand something, when his salary depends on his not understanding it.” --Upton Sinclair0


This discussion has been closed.
Confirm your email address to Create Threads and Reply

Categories
- All Categories
- 354.1K Banking & Borrowing
- 254.3K Reduce Debt & Boost Income
- 455.3K Spending & Discounts
- 247.1K Work, Benefits & Business
- 603.7K Mortgages, Homes & Bills
- 178.3K Life & Family
- 261.2K Travel & Transport
- 1.5M Hobbies & Leisure
- 16.1K Discuss & Feedback
- 37.7K Read-Only Boards