We’d like to remind Forumites to please avoid political debate on the Forum.
This is to keep it a safe and useful space for MoneySaving discussions. Threads that are – or become – political in nature may be removed in line with the Forum’s rules. Thank you for your understanding.
PLEASE READ BEFORE POSTING: Hello Forumites! In order to help keep the Forum a useful, safe and friendly place for our users, discussions around non-MoneySaving matters are not permitted per the Forum rules. While we understand that mentioning house prices may sometimes be relevant to a user's specific MoneySaving situation, we ask that you please avoid veering into broad, general debates about the market, the economy and politics, as these can unfortunately lead to abusive or hateful behaviour. Threads that are found to have derailed into wider discussions may be removed. Users who repeatedly disregard this may have their Forum account banned. Please also avoid posting personally identifiable information, including links to your own online property listing which may reveal your address. Thank you for your understanding.
📨 Have you signed up to the Forum's new Email Digest yet? Get a selection of trending threads sent straight to your inbox daily, weekly or monthly!
Offer advice on 300K..can I get under 250?
Comments
-
I got my £285k advertised house for £248.5k.
The sellers paid £270k for it 18 months previous.Thinking critically since 1996....0 -
marshall666 wrote: »I interpret that graph as follows:
The number sold between 200 and 240 are near enough equally distributed. There is a large rise between 240 and 250 which is likely due to the stamp duty. The lower number of houses selling between 250 and 270 indicates the extra houses in the 240-250 bin have come down in price rather than been raised up.
If the stamp duty threshold were not there, those houses would be selling between 250 and 270-275 (since there is already an even distribution between 200-240).
I.e stamp duty is pulling house prices down from 275 to 250.
this graph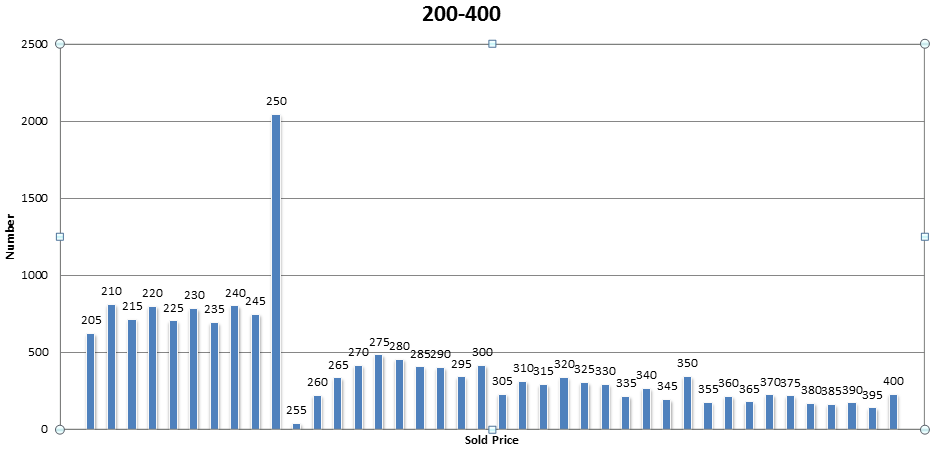
shows what is going on at a higher resolution. 275 looks like the magic number.
Stamp duty does bring down properties but not by £25k0 -
I just want to add a correction to my interpretation of the above graph. The fact that prices hold level to the left of the stamp duty threshold is in fact indicating that the threshold is also raising prices on that side.
If the the threshold were not there, you would expect to see some variation of a standard distribution drop (i.e slightly bell shaped) as you move away from the mean house price.0 -
marshall666 wrote: »I just want to add a correction to my interpretation of the above graph. The fact that prices hold level to the left of the stamp duty threshold is in fact indicating that the threshold is also raising prices on that side.
If the the threshold were not there, you would expect to see some variation of a standard distribution drop (i.e slightly bell shaped) as you move away from the mean house price.
I think you are thinking to deep there are more houses below £250k than above. Can you explain how the stamp duty would increase the price below the threshold . If you reduce a house that is worth £260k to £250k because of stamp duty that will make the house that was £250k worth less the number house sold will be more because of the additional houses from the £260k to £250k band.0 -
Put simply the OP can't afford the property.0
-
I think you are thinking to deep there are more houses below £250k than above. Can you explain how the stamp duty would increase the price below the threshold . If you reduce a house that is worth £260k to £250k because of stamp duty that will make the house that was £250k worth less the number house sold will be more because of the additional houses from the £260k to £250k band.
In an unskewed system, without the threshold I would expect to see a bell shaped decline in frequency as the price gets further from the average selling price. The housing system is right - skewed however so I expect a a bell shaped decline away from the median selling price, which is 174000.
The graph below shows the selling prices from 0-1.24M. It is pretty clear to see the right skewed distribution I am referring to. To the left of 250 the values are held higher (the flat portion):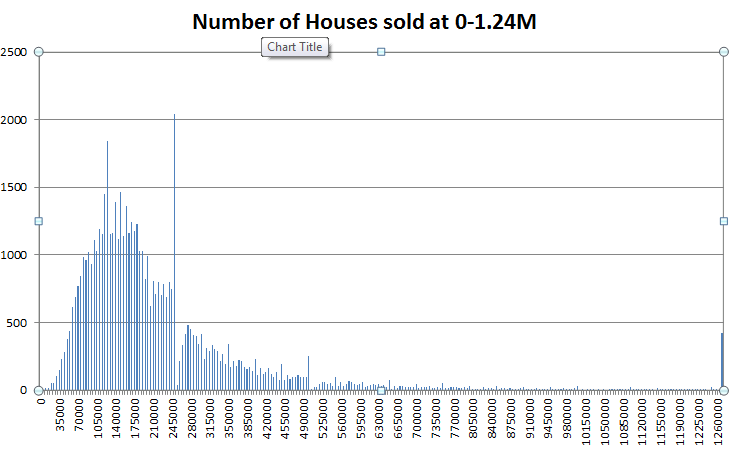
Note that you can see the same effect to the left of 500K also.
In terms of the reasoning behind this effect, I would argue that it is simply not the case that reducing the selling price of one property that is above the stamp duty threshold affects the value of a property below it.
(edit: title of graph is wrong - the range is higher than that)0 -
marshall666 wrote: »I'd rather pay 8K more at purchase and have it spread out over term of the mortgage (yes and end up paying interest on it) than be forced to save and then fork out 8K for the privilege of buying the house.
You are not paying more the vendors are getting less.
Your total spend is what it is, does not matter what it is made up of house solicitors, moving, application fees, surveys etc.
If you want to pay for those over a longer term borrow more money.
It makes no difference if the total is £300k with stamp duty or without, at the end of the day it is the vendor that gets less after all the bills are paid.0 -
marshall666 wrote: »In an unskewed system, without the threshold I would expect to see a bell shaped decline in frequency as the price gets further from the average selling price. The housing system is right - skewed however so I expect a a bell shaped decline away from the median selling price, which is 174000.
The graph below shows the selling prices from 0-1.24M. It is pretty clear to see the right skewed distribution I am referring to. To the left of 250 the values are held higher (the flat portion):
Note that you can see the same effect to the left of 500K also.
In terms of the reasoning behind this effect, I would argue that it is simply not the case that reducing the selling price of one property that is above the stamp duty threshold affects the value of a property below it.
(edit: title of graph is wrong - the range is higher than that)
So you would be happy to pay £250k foe a 3 bed semi when you could buy a 3 bed detached for the same because it has been reduced to get below stamp duty threasehold.0 -
Stamp duty does bring down properties but not by £25k
Thats not what the graph tells you.
It say that between £250 and £275 there is a trend to drop the selling price not by the full £25k but some of it.
So upto the extra stamp duty nearly all get sucked down to £250k then there will be a decreasing effect on reductions above that as people share the SDLT and then around £275 it is back to oh well it part of the sale but the effect will be across the board above that just reduces what people can pay.
if you graph the cost/net you will see the effect0 -
You guys are giving me a headache. ^_^
I have no idea about property really but if they want say 260k would thier not be a way around stamp duty by paying 10k seperatly?
But like others have said, they can only say no to an offerPeople don't know what they want until you show them.0


This discussion has been closed.
Confirm your email address to Create Threads and Reply

Categories
- All Categories
- 355.1K Banking & Borrowing
- 254.6K Reduce Debt & Boost Income
- 455.8K Spending & Discounts
- 247.8K Work, Benefits & Business
- 604.9K Mortgages, Homes & Bills
- 178.7K Life & Family
- 262.5K Travel & Transport
- 1.5M Hobbies & Leisure
- 16.1K Discuss & Feedback
- 37.7K Read-Only Boards