We’d like to remind Forumites to please avoid political debate on the Forum.
This is to keep it a safe and useful space for MoneySaving discussions. Threads that are – or become – political in nature may be removed in line with the Forum’s rules. Thank you for your understanding.
Debate House Prices
In order to help keep the Forum a useful, safe and friendly place for our users, discussions around non MoneySaving matters are no longer permitted. This includes wider debates about general house prices, the economy and politics. As a result, we have taken the decision to keep this board permanently closed, but it remains viewable for users who may find some useful information in it. Thank you for your understanding.
📨 Have you signed up to the Forum's new Email Digest yet? Get a selection of trending threads sent straight to your inbox daily, weekly or monthly!
The Forum now has a brand new text editor, adding a bunch of handy features to use when creating posts. Read more in our how-to guide
MSE News: Halifax: house prices down 1.5% in February
Comments
-
But the Halifax also pointed to a rise in the number of people putting their home on the market as a factor affecting prices.
"An increase in the number of properties available for sale has helped to reduce slightly the imbalance between supply and demand," said Martin Ellis, Halifax housing economist.
http://news.bbc.co.uk/1/hi/business/8549000.stm
AlsoNeither Halifax or Nationwide expects prices to remain on an upward course this year. Kate Barker, a member of the Bank of England's Monetary Policy Committee, cautioned that there may be further adjustment in prices given that mortgage lending remains relatively weak.
http://www.telegraph.co.uk/finance/economics/houseprices/7366364/UK-house-prices-fall-snapping-rally.html0 -
Chart time
 :cool:
0 -
Interesting that the price bounce is encouraging more people to attempt to sell their property. And not when you'd expect them to either.Low supply of properties for sale has been a key factor pushing up house prices. [FONT=Arial,Arial][FONT=Arial,Arial]The recent improvement in market conditions has encouraged more homeowners to attempt to sell their property. The stock of properties available for sale increased for the second successive month in January. Additionally, the ratio of completed sales to stock eased, indicating a modest loosening in market conditions. (Source: RICS monthly survey, January 2010.)
[/FONT][/FONT]0 -
House Prices crash 1.5% in February
 0
0 -
Thrugelmir wrote: »Interesting that the price bounce is encouraging more people to attempt to sell their property. And not when you'd expect them to either.
Not sure on that most people delay putting houses on the market until after Christmas.
But for sure a lot more have put them on this year than this time last year.0 -
Chart time
Oh good!
I would like to present this chart, which, so far, has shown the boom, the bust, the boom again which provides growth to replace around half of the bust, and then, as we see in january's figures, the fall again.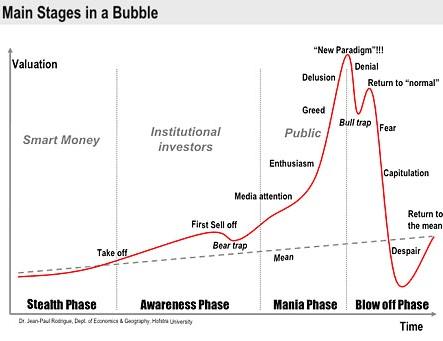
Currently, it appears, we are just on the peak of the "return to normal" stage, getting our sledges out to ride the rollercoaster down to despair.
Disclaimer: I don't actually believe this chart to much. However, must say, it's pretty much spot on if we see continued falls from now on.
Disclaimer V2: I do not want an argument about axis, timelines, tracing paper, or median rubbish. I just think this chart should be posted everywhere.
0 -
I would like to present this.
")
A lot more sensible tool if you think this is the same as previous crashes and want to find where the nominal bottom is on average.
http://www.mortgageguideuk.co.uk/housing/uk-house-price-index.html
I could draw a nice picture to go with it, but I always think this data can paint a thousand pictures. 0 -
I personally think house prices are like a womans moods....they go up and down, sometimes without any rhyme or reason!We made it! All three boys have graduated, it's been hard work but it shows there is a possibility of a chance of normal (ish) life after a diagnosis (or two) of ASD. It's not been the easiest route but I am so glad I ignored everything and everyone and did my own therapies with them.
Eldests' EDS diagnosis 4.5.10, mine 13.1.11 eekk - now having fun and games as a wheelchair user.0 -
Graham_Devon wrote: »Oh good!
I would like to present this chart, which, so far, has shown the boom, the bust, the boom again which provides growth to replace around half of the bust, and then, as we see in january's figures, the fall again.
Currently, it appears, we are just on the peak of the "return to normal" stage, getting our sledges out to ride the rollercoaster down to despair.
Disclaimer: I don't actually believe this chart to much. However, must say, it's pretty much spot on if we see continued falls from now on.
Disclaimer V2: I do not want an argument about axis, timelines, tracing paper, or median rubbish. I just think this chart should be posted everywhere.
Graham you may indeed be correct. (Though I hope not)
However, if we do get a spring/summer bounce in 2010 will you agree and accept that the model above does not apply to this particular crash? I've noticed how bears wheel the graph out on an almost constant basis and feel that we are surely approaching the point that it either applies or should be consigned to the scrap heap!Go round the green binbags. Turn right at the mouldy George Elliot, forward, forward, and turn left....at the dead badger0 -
Graham you may indeed be correct. (Though I hope not)
However, if we do get a spring/summer bounce in 2010 will you agree and accept that the model above does not apply to this particular crash? I've noticed how bears wheel the graph out on an almost constant basis and feel that we are surely approaching the point that it either applies or should be consigned to the scrap heap!
Course I will.
As I said in the disclaimer, I don't really believe it. Just seems very "right" at the moment, at least in the sense of the start of the crash, then boom to claw back about 50% falls, and then crash.
The key point is whether it falls from now or not. If it does, that chart, at least the crash part, will be pretty accurate. I find that quite interesting.
The chart also, for some reason, REALLY gripes some of those who believe upwards continually from here. I have never seen a chart cause so much controversy. There must be something in that.0


This discussion has been closed.
Confirm your email address to Create Threads and Reply

Categories
- All Categories
- 354.6K Banking & Borrowing
- 254.5K Reduce Debt & Boost Income
- 455.5K Spending & Discounts
- 247.5K Work, Benefits & Business
- 604.4K Mortgages, Homes & Bills
- 178.6K Life & Family
- 261.9K Travel & Transport
- 1.5M Hobbies & Leisure
- 16.1K Discuss & Feedback
- 37.7K Read-Only Boards