We’d like to remind Forumites to please avoid political debate on the Forum.
This is to keep it a safe and useful space for MoneySaving discussions. Threads that are – or become – political in nature may be removed in line with the Forum’s rules. Thank you for your understanding.
British Gas fixed Tariff Estimated Usage.




Hi all, just wondering on people thoughts, about what I am seeing on my account with British Gas.
I fixed my Energy Tariff with BG back in June it is the
Longer Fix Apr28 v2
The estimated usage when I signed up for the Tariff showed £2452 yearly. Since signing up If I look at my tariff on BG website it is showing me Estimated usage £2694. An increase of £242 since signing up which means roughly £80 every month, from beginning of June to end of August. The price per unit hasn't changed which is the main thing, but I am wondering why my estimated usage has increased slowly over the months since signing up.
I have a smart meter installed, so no worries about meter readings. None of my meter readings they have taken say estimated. So how can an estimated yearly usage jump £242 since signing up to new tariff. I would understand if i was a new customer, but I have been with BG for many years on varoius fixed Tariffs, so they know how much energy I use.
Comments
-
I am wondering why my estimated usage has increased slowly over the months since signing up.
It'll probably be because you've been using more energy than they expected when they gave your initial estimate.
Do the BG estimates tell you how much energy use they're based on? How many kWh per year of electricity (& gas, if you have gas)?
I have been with BG for many years on varoius fixed Tariffs, so they know how much energy I use.
As above, how have their estimates changed over that time? How do their estimates compare with your own calculations of how much energy you've used in the past 12 months?
An increase of £242 since signing up which means roughly £80 every month, from beginning of June to end of August.
That's not really how to think of it. They're predicting an annualised equivalent increase of £242, which is £20 a month averaged over the year, and probably only £5-10 a month during the summer months of June to August.
N. Hampshire, he/him. Octopus Intelligent Go elec / Fuse gas / Vodafone BB / iD mobile. Kirk Hill Co-op member.Economy 7 cap explainer. Gas vs E7 vs peak elec heating costs, Ecoflow Stream, Best kettle :-)
2.72kWp PV facing SSW installed Jan 2012. 11 x 247w panels, 3.6kw inverter. 37 MWh generated, long-term average 2.6 Os.1 -
If you are on a fixed monthly dierct debit they have probably over estmated your usage on purpose to keep you in credit druing the winter period. If you don't like it, see if your supplier allows monthly variable driect debit and then manage your own monthly payments into a savings account which you can use to cover your bill each month.
2 -
@QrizB I did take a look at my usage, I noticed some thing changed in May this year, as my electricity usage slightly increased since may last year. Jan, Feb, Mar, Apr this year were actually lower this year compared to last, but some changed in May, but don't know what. I put 2 new routers in, in June, I know they have a max of 60W under high traffic, but they have never been under high load. normal usage is about 24W each. and maybe using fans more due to hot weather.
0 -
@Swipe I pay quarterly, on receipt of bill, as I prefer it that way, as I don't like the thought of BG increasing my monthly out goings as and when they feel like it. I know it's probably the most expensive way to pay than DD. I just prefer paying that way. Plus I think paying DD, only increases the amount of interest the banks pay BG , when they accumulate the money earlier in BG bank account.
0 -
Call them and ask if they can put you on monthly variable direct debit where you pay your full monthly bill in arrears. You could make a decent saving that way.
2 -
@GmanGee wrote:
I noticed some thing changed in May this year, as my electricity usage slightly increased since may last year.
May this year was chiefly notable for the high temperatures. I did a wee comparison of the daily electricity consumption of the freezer in my kitchen against the temperature in there for the first few weeks:
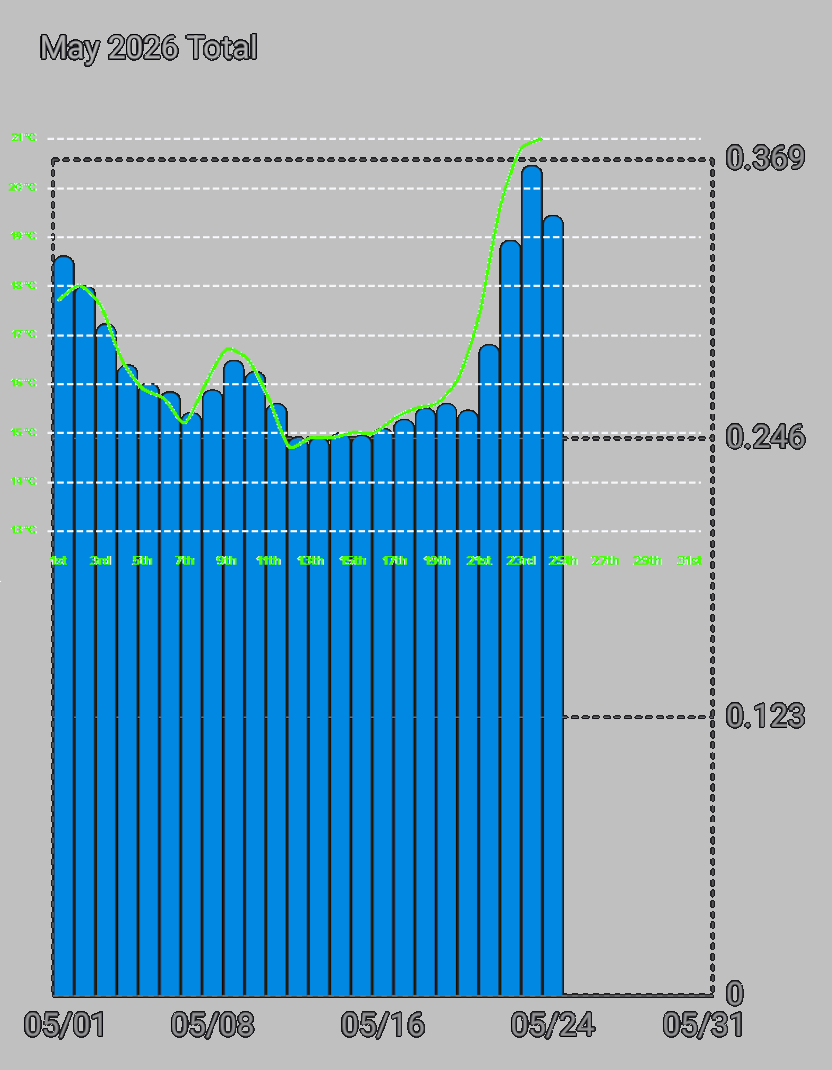
Yes, I manipulated the axes, but only to match the ups and downs of the two quite different datasets to each other. The blue bars are provided by the Tapo P110 smart socket the freezer is plugged in to. The green line is the average temperature recorded by the Netatmo weather station a couple of meters away from the freezer. I haven't looked at July, but I expect I'd see a similar degree of conformity with even higher numbers.
This is a tiny little counter-top freezer, consuming about 0.3kWh each day in a heatwave. Fridges and freezers are likely to consume a lot more juice than your routers and other electronic stuff. Fans can gobble up the watt-hours, too.
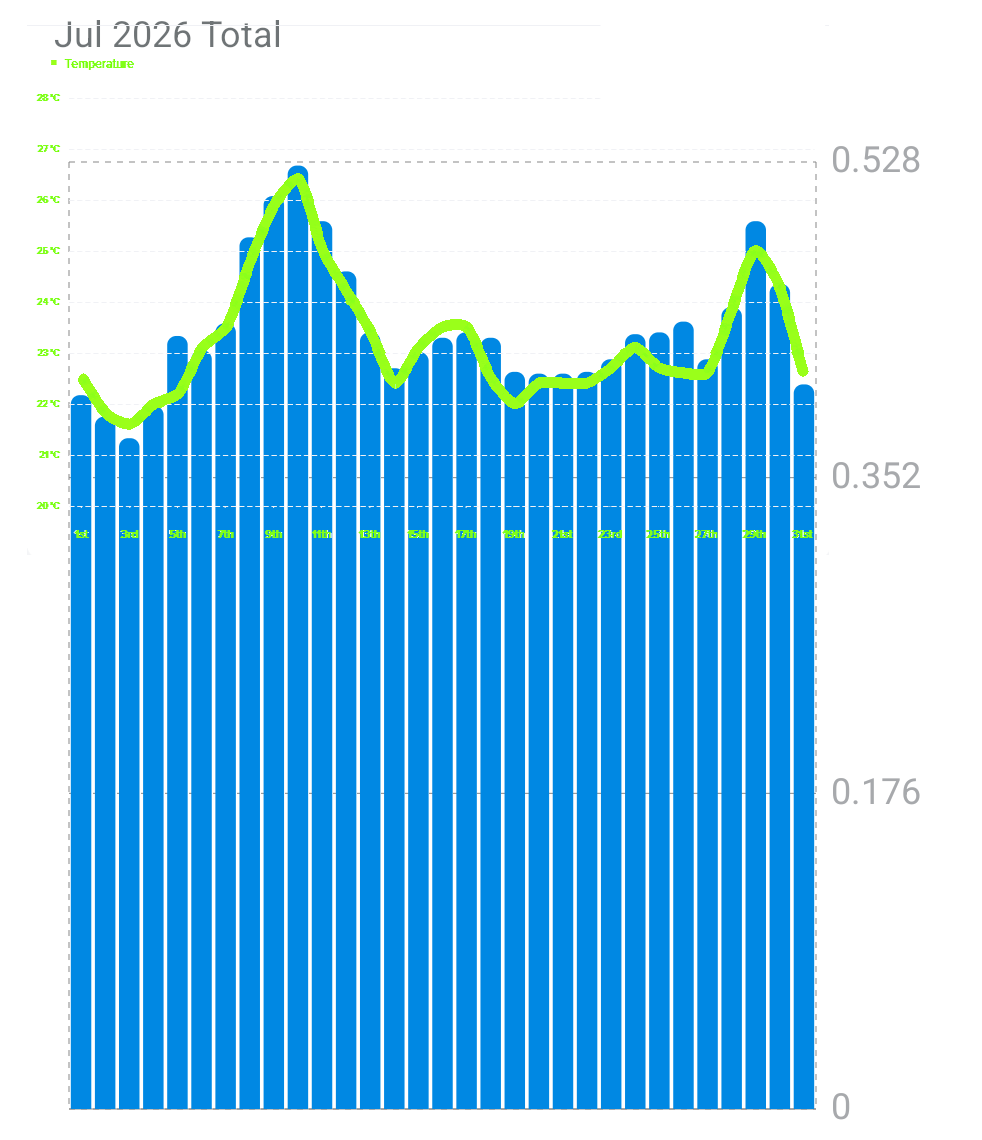
OK I had a look at July's figures, too. The average consumption is about 0.4kWh, significantly higher than in May. Agreement between the two curves is still remarkable IMHO; the odd outlier - e.g. on 5 July - shows the extra cost of refilling the freezer after a shopping expedition.
I'm not being lazy ... I'm just in energy-saving mode.
If you're asked to post a photo of your meter Meter Configuration Tables v2.0.xlsx1







Confirm your email address to Create Threads and Reply

Categories
- All Categories
- 355.7K Banking & Borrowing
- 254.9K Reduce Debt & Boost Income
- 456.1K Spending & Discounts
- 248.3K Work, Benefits & Business
- 605.8K Mortgages, Homes & Bills
- 179K Life & Family
- 263.6K Travel & Transport
- 1.5M Hobbies & Leisure
- 16.2K Discuss & Feedback
- 37.7K Read-Only Boards